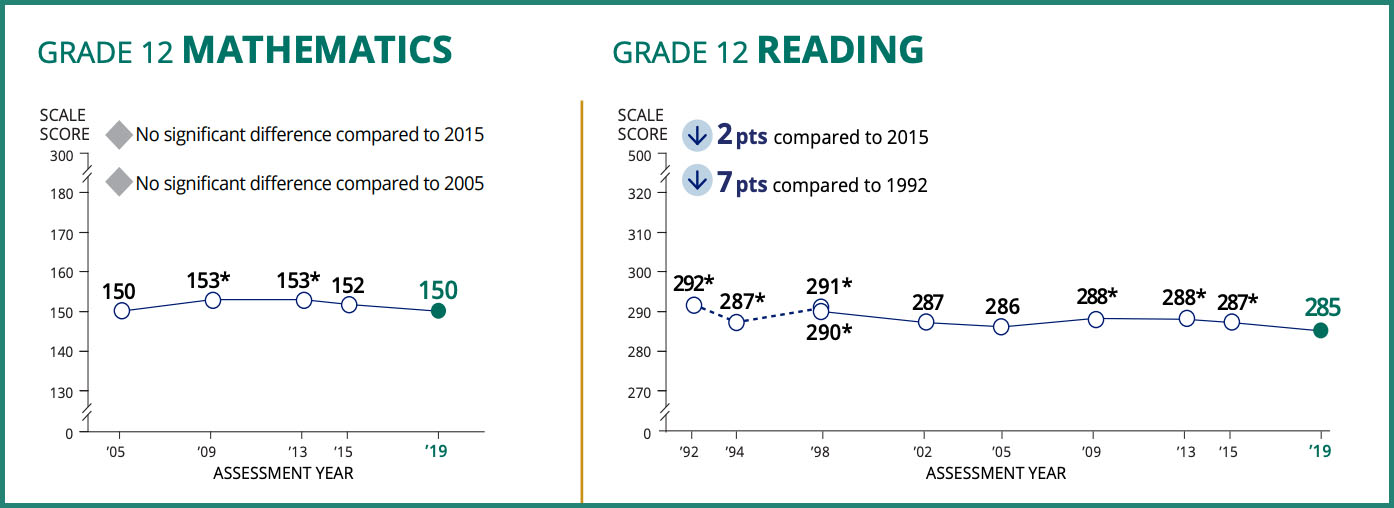
When it comes to America’s achievement trends, the bad news keeps coming. As we previously saw at the fourth grade and eighth grade levels, the just-released 2019 twelfth grade results in math and reading were mostly flat or down across the board, as well, with particularly sharp declines for our lowest-performing students in reading.
Figure 1. NAEP mathematics and reading scores for grade 12, 1992–2019
Source: The 74.
There’s no sugarcoating it. This does not bode well for this generation’s economic prospects, or the future of our country. But we shouldn’t be surprised. As I wrote on Monday, we already knew from the 2015 results that this cohort of students entered high school performing below their older peers, after suffering a major slow-down in progress between the fourth and eighth grades.
In fact, much of the declines that we see in twelfth grade when we compare the graduating class of 2019 to the class of 2015 were already apparent at the eighth grade level, especially in math.
Consider table 1 below. On average, the class of 2019 scored 1 point higher in fourth grade math than did the class of 2015. But by eighth grade, it scored 1 point lower, and remained 1 point lower by twelfth grade. This middle-school slide was most dramatic for Black students, who went from +2 in fourth grade to -2 in eighth, and then back to -1 by twelfth. Hispanic students, meanwhile, also lost ground from the fourth to the eighth grade—going from +2 to 0—and kept sliding to -1 in twelfth grade. Similar patterns were seen for students eligible for free or reduced-price lunch (FRPL) and the lowest performing students (those at the tenth percentile).
Table 1. NAEP mathematics scale scores, public school sample

In reading, trends for Black students were similar as those for math, with a slide starting between the fourth and eighth grades and continuing into twelfth, as seen in table 2. But for Hispanic and FRPL-eligible students, and those at the 10th percentile, most of the declines in reading happened between the eighth and the twelfth grades. The backward movement was particularly large for the lowest-performing students, going from flat results in fourth grade to -1 in eighth grade to -5 in twelfth. This might reflect the impact of falling dropout rates—an issue we’ll turn to below.
Table 2. NAEP reading scale scores, public school sample

Digging into these details is important for making an accurate diagnosis of what’s causing these disheartening trends. In short, high schools shouldn’t get all the blame, as many of the declines started before the eighth grade.
And this analysis should give us more confidence in the hypothesis that a major culprit here was the sharp decline in school spending between 2010 and 2013, which the class of 2019 experienced between their third and seventh grades.
I should pause to say that by fingering spending, I’m not letting school systems off the hook. Had they made smart cuts to their budgets, employing strategies like those spelled out in a 2010 book co-produced with Rick Hess, and updated in a recently-released sequel, they could have survived the lean times without hurting students and student achievement.
Let’s also acknowledge that, as NCES official Peggy Carr told reporters, some of what we’re seeing in the twelfth grade scores is almost surely related to the big decrease in the high school dropout rate. “There is a strong correlation between improvements in graduation rate, students who we are now able to test, and a decline in scores,” Carr said. “And that’s a good thing. Students who would normally not be in the assessment are now in the assessment.”
In other words, it used to be that the country’s most disadvantaged, lowest-performing students would have been long gone before they had a chance to sit for the twelfth grade NAEP. But now that states and districts have driven the graduation rate ever higher—through means both suspect and praiseworthy—many more of those kids are making it all the way across the graduation stage. That’s a good outcome. No one wins when kids drop out. They might also be dragging down the national averages, but that’s cold comfort.
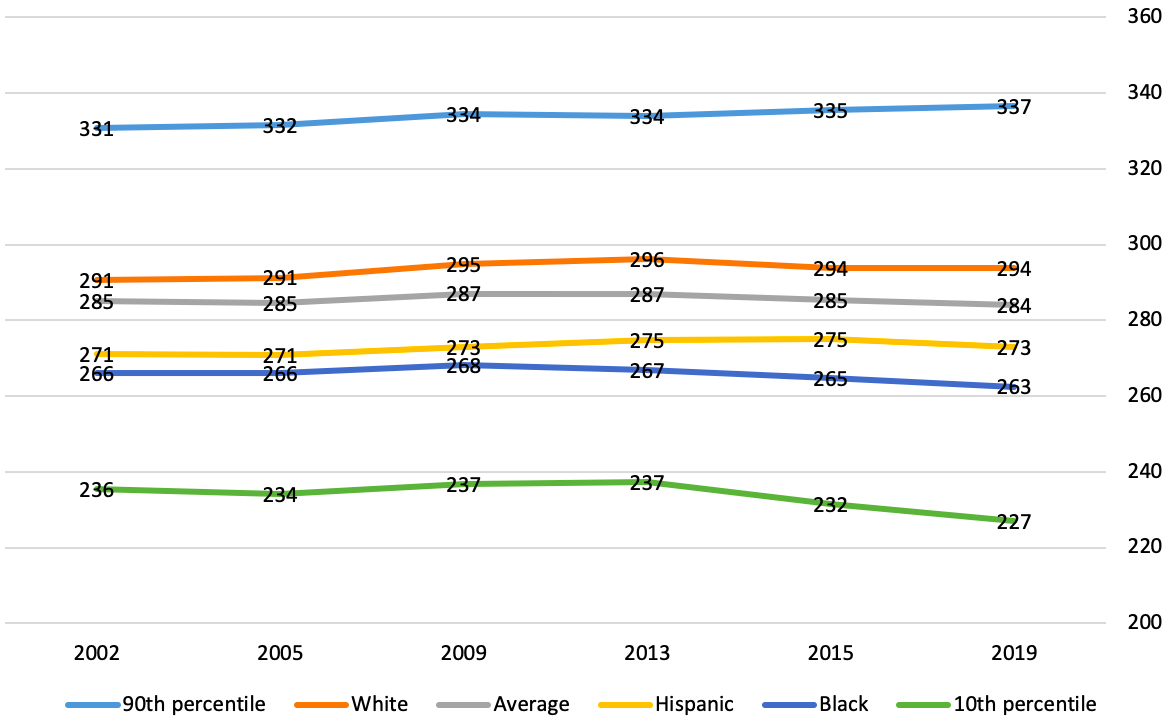
Consider the charts below. At both the fourth and eighth grade levels, reading scores are flat to slightly up if we look at scores for the graduating classes of 2002 through 2019, including for the lowest-performing students (those at the tenth percentile). But at the twelfth grade level, lately the bottom has fallen out for those lowest performers. That means one of two things: Either our high schools have suddenly gotten terrible at teaching reading to students struggling with basic literacy, or a lot more poor readers are staying in high school and taking the NAEP.
Figure 2. Average scale scores for grade 4 reading, public school sample, high school classes of 2002–19
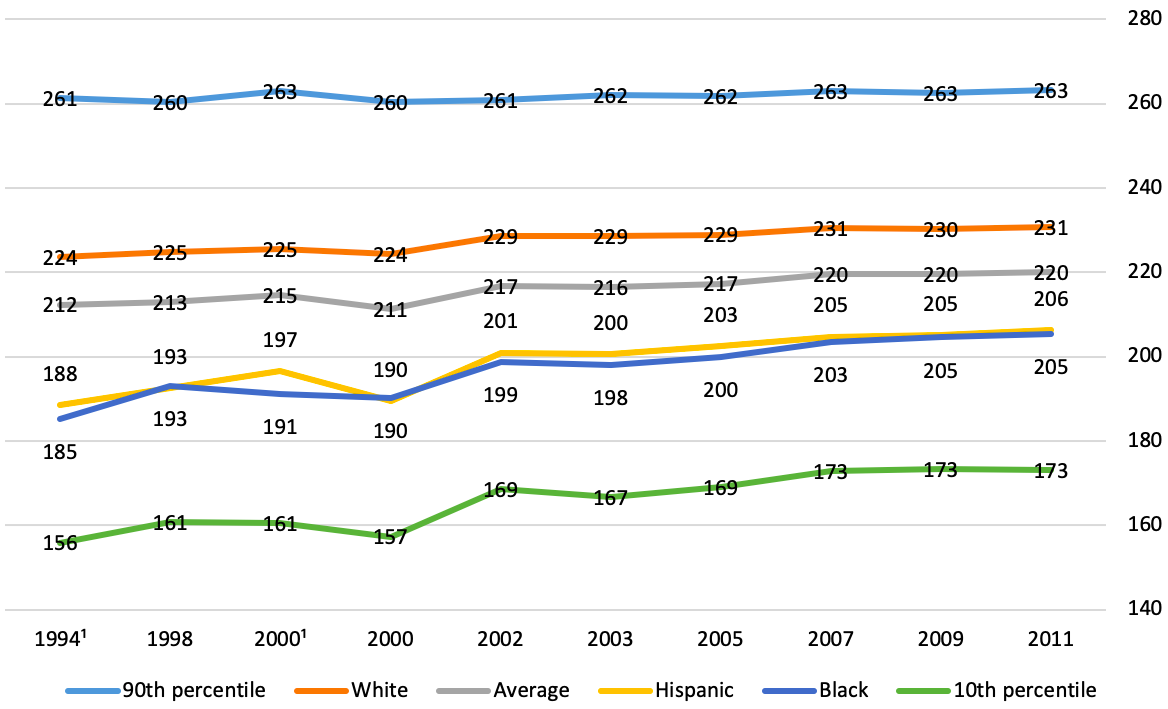
Figure 3. Average scale scores for grade 8 reading, public school sample, high school classes of 2002–19
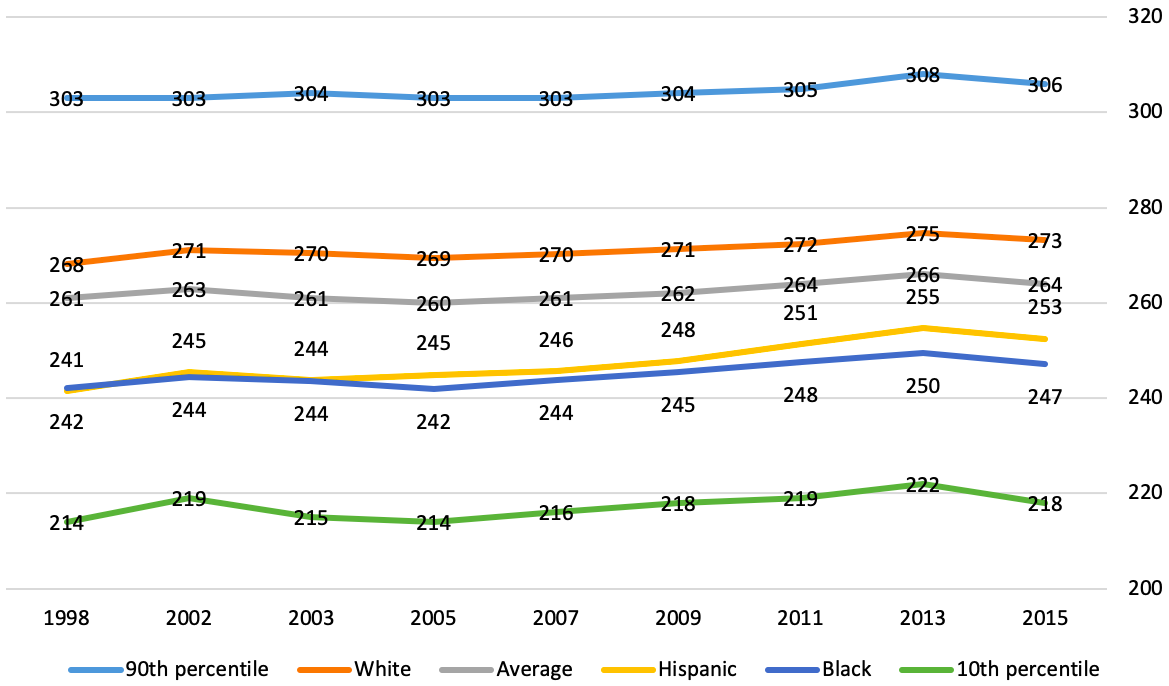
Figure 4. Average scale scores for grade 12 reading, public school sample, high school classes of 2002–19
Again, none of this is meant to let schools off the hook. Even before this awful pandemic, given trends at the fourth and eighth grade levels, our high schools already faced the challenge of coping with students coming into ninth grade performing at lower levels academically. By next fall, that problem is only going to grow worse—dramatically so. They had better figure out quickly how to meet the challenge and help students make up as much ground as possible before they take their diplomas into the world.
