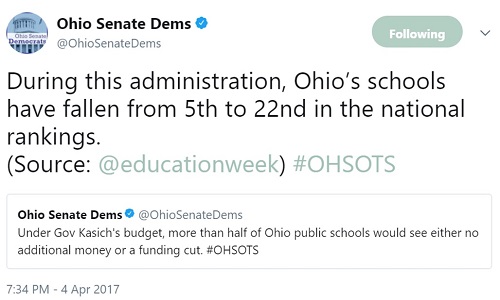
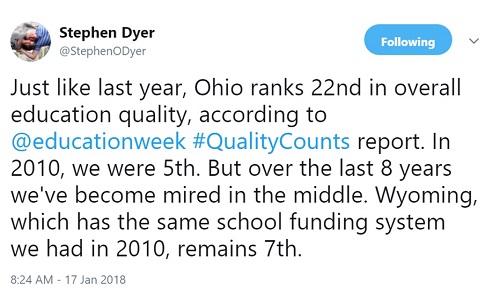
Education Week just released its 22nd annual report and rankings of state education systems. Faster than we can read the report or its accompanying coverage—which this year includes a worthwhile look at “five common traits of top school systems” and “five hurdles” standing in the way of improvement—alarmed observations about Ohio’s rankings “drop” have begun to emerge. They point out that Ohio was ranked 5th in 2010, 23rd in 2016, and 22nd in both 2017 and 2018, largely to score political points suggesting that the current administration has been asleep at the wheel.
We’ve been down this path before, but let’s revisit two significant problems with this interpretation. Last year when the ratings were released, I dove into an analysis exploring some of the likely causes for Ohio’s near twenty-slot fall in the relative rankings since 2010.
The rating system changed
Education Week undertook a significant overhaul of its rating system between 2014 and 2015, prohibiting meaningful comparisons of overall rankings over time. They eliminated three categories and now only include the following components: Chance for Success, an index with thirteen indicators examining the role that education plays from early childhood into college and the workforce; School Finance, a grade based on spending and equity, which takes into account per-pupil expenditures, taxable resources spent on education, and measures of intra-district spending equity; and K-12 Achievement, a grade based on eighteen measures of reading and math performance, AP results, and high school graduation.
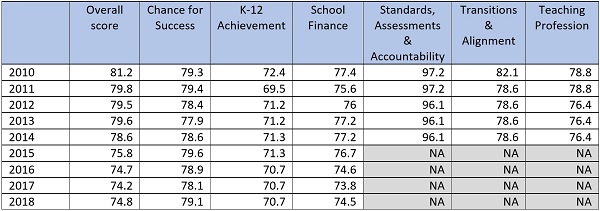
The three categories axed after 2014 included Ohio’s highest-rated areas, Standards, Assessments and Accountability, and two other areas (Transitions and Alignment and Teaching Profession) where Ohio posted solid scores. The table below illustrates how Ohio scored in each category over time and helps explain why Ohio’s absolute score fell given changes to the scoring system.
Table 1: Ohio scores on Education Week’s Quality Counts report card over time

Relativity
Education Week’s rankings are relative, and Ohio’s shift over time has just as much to do with what other states are or aren’t doing. Last year, I hypothesized that Ohio’s fourteen-slot fall between 2013 and 2014 very likely resulted from the changes rapidly occurring in other states that earned them extra points Ohio had already had under its belt. In fact, the year that its relative ranking plummeted, Ohio’s actual score only changed by a single digit.
Table 2: Ohio’s dramatic rankings shift

Ohio’s actual score changes across nearly a decade among the components that have remained consistent have been fairly modest. For instance, in 2010, the state’s score on K-12 Achievement was 72.4, and in 2018, it was 70.7.
Table 3: Changes to Ohio’s Education Week scores, 2010-2018

Despite these minor changes in scores, some would have you believe that Ohio’s education system has suffered cataclysmically. As I warned last year, Ohio’s ranking has become easy fodder for those with an ax to grind with the state’s education policies. Unfortunately, that fact remains true a year later. This is not to say that the state’s education policies have been above reproach or that we’re where we need to be. Rather, seeing data used so out of context and without understanding the causes behind such changes leaves us ill-equipped to make meaningful improvements. Consider these tweets that basically assign blame for changes in the state’s ranking to just about anything the tweeter wants to target:


Given how heavily the Quality Counts ranking is cited throughout the year, understanding the finer details of the rankings would likely generate a more productive discussion on how to improve education in Ohio. That is the goal, right?


