Over the last few weeks, I’ve presented evidence that student outcomes in America improved significantly from the late 1990s until the onset of the Great Recession. The progress was greatest and most widespread in math, but also strong in reading, and pretty good in science, writing, U.S. history, and civics. In all of these cases, gains were greatest for the lowest-achieving students, for students of color, and at the fourth and eighth grade levels. With just a few exceptions, the trends for twelfth grade have generally been flat.
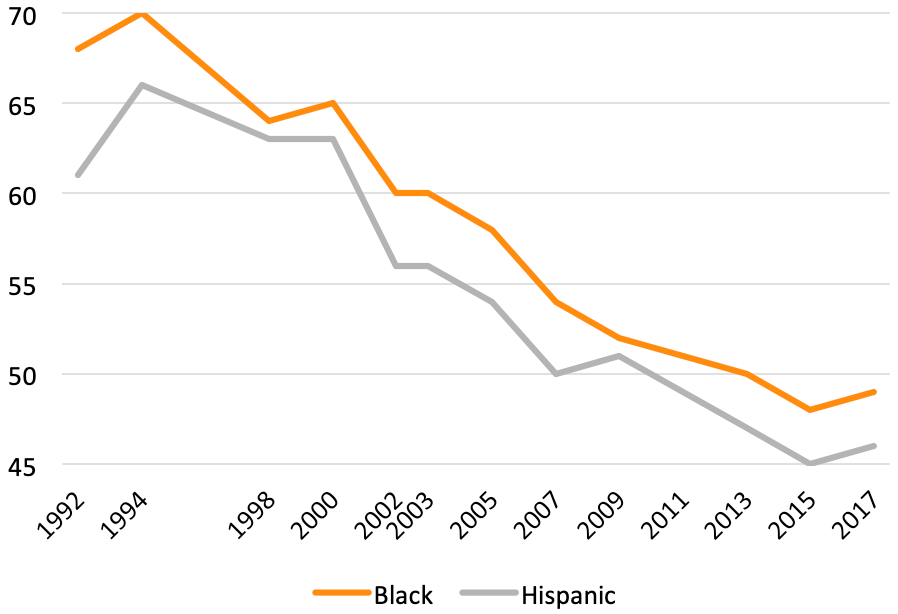
See for example this impressive picture:
Figure 1. Percentage of fourth graders reading Below Basic on NAEP
However, these positive trends don’t necessarily mean that America’s schools got better over this time. Something that changed outside of school could explain at least some of these gains. And there’s a likely candidate for that “something”: vastly improving economic conditions for the nation’s poorest families over this period.
If that statement caused you to do a double-take, you probably aren’t alone because this progress is one of the best-kept secrets in American life. Especially so for those of us in education, since we’re used to equating poverty rates with free-and-reduced-priced-lunch rates, which are increasingly unreliable proxies.
So let’s state it clearly: America’s children are much less likely to be poor today than they were in the 1980s and 90s. In fact, poverty rates for white, black, and Latino children have each been cut by about 50 percent since A Nation at Risk.
This is a great achievement, one made possible by a growing economy and smart, compassionate policies embraced to some degree by leaders on both sides of the aisle. Let’s take a closer look at the numbers.
Child poverty rates over time
As with educational outcomes, it’s important to disaggregate child poverty rates by race and ethnicity, both because averages might not tell the whole story, and because the rising Latino share and shrinking white share of the population might give us a distorted view of what’s happening, given that Latino children are, on average, more likely to be poor than white children.
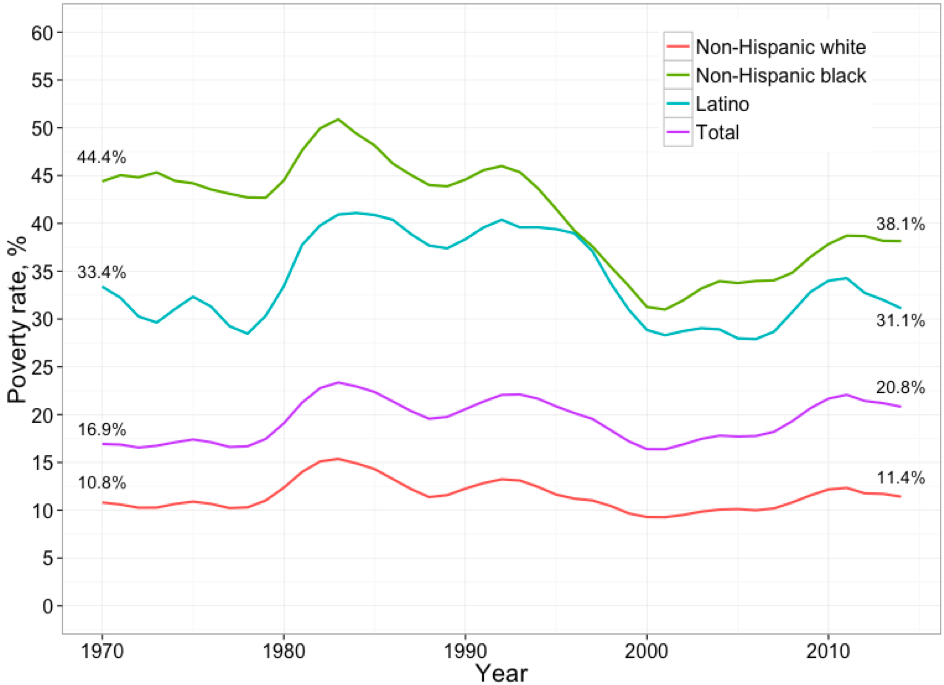
So let’s start by looking at child poverty rates for the three major racial groups according to the standard poverty measure.
Figure 2: Child poverty rates according to the standard poverty measure, by race and year
Source: Nolan, Laura; Garfinkel, Irwin; Kaushal, Neeraj; Nam, JaeHyun; Waldfogel, Jane; and Wimer, Christopher, “Trends in Child Poverty by Race/Ethnicity: New Evidence Using an Anchored Historical Supplemental Poverty Measure," Journal of Applied Research on Children: Informing Policy for Children at Risk: Vol. 7: Iss. 1, Article 3. Available at: http://digitalcommons.library.tmc.edu/childrenatrisk/vol7/iss1/3.
What we see is a spike in child poverty right around the time of A Nation at Risk in 1983, then declines through the 1980s until the 1989 recession, huge progress in the booming 1990s—especially for black and Latino children—and then rising poverty in the 2000s and especially with the onset of the Great Recession. After all of that, i.e., when we look across the whole period from 1970 to the present, black child poverty rates are down sharply, Latino rates are down modestly, and white rates are up modestly.
Yet the standard child poverty rate has many flaws, as virtually everyone who studies the topic will tell you. The poverty line was set back in the 1960s as an estimate of what a family of a given size would need for food, clothing, and shelter. Every year since, the Census Bureau has simply adjusted the line based on inflation.
That leaves a lot to be desired. For one, it doesn’t take into account differences in cost of living, so the line is the same if a family lives in pricey San Francisco or low-cost West Virginia. Second, it’s not clear whether the overall inflation rate is the right one to use, or whether something more targeted to what poor families actually consume might be better. Most importantly, it doesn’t account for money from government programs and policies—like SNAP benefits (food stamps) and the Earned Income Tax Credit. These have grown significantly in recent years, so ignoring them warps the picture dramatically.
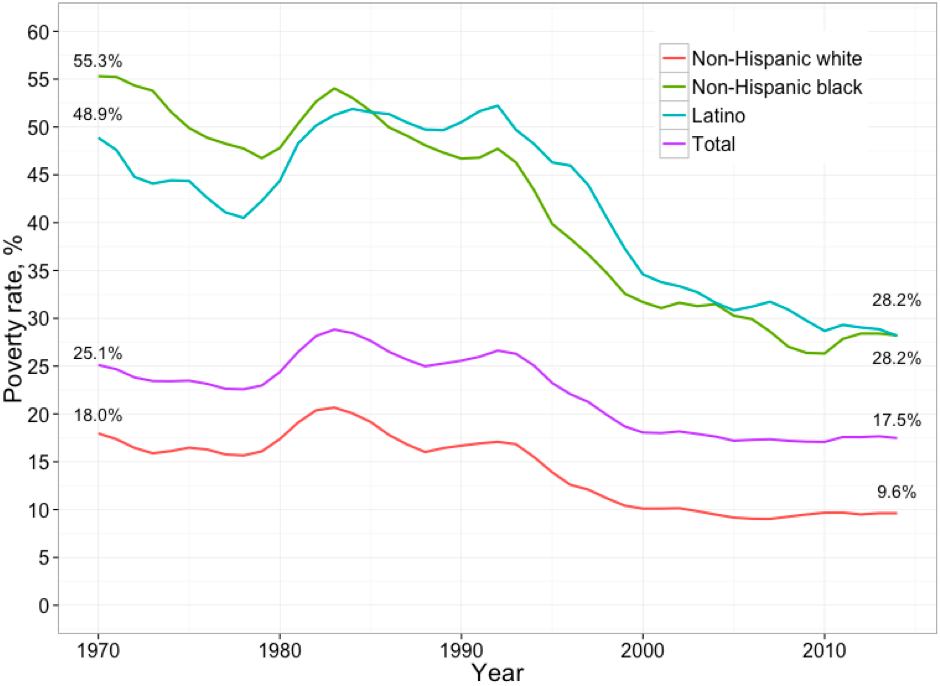
Thankfully, in 2011, the Census Bureau and Bureau of Labor Statistics developed the “supplemental poverty rate,” which corrects these and other flaws. (A comprehensive overview of the measure is available here.) And a group of scholars has estimated the historic child poverty rate, by race, according to this new measure. Here’s what it looks like:
Figure 3: Child poverty rates according to the supplemental poverty measure, by race and year
Source: Nolan, Laura; Garfinkel, Irwin; Kaushal, Neeraj; Nam, JaeHyun; Waldfogel, Jane; and Wimer, Christopher, “Trends in Child Poverty by Race/Ethnicity: New Evidence Using an Anchored Historical Supplemental Poverty Measure," Journal of Applied Research on Children: Informing Policy for Children at Risk: Vol. 7: Iss. 1, Article 3. Available at: http://digitalcommons.library.tmc.edu/childrenatrisk/vol7/iss1/3.
Now we see a more impressive story about change over time. Child poverty was much higher than we thought when the data series began back in 1970, but fell sharply for black and Latino children in the 1980s until the 1989 recession. Starting again around 1993, we see a long and steep decline in poverty rates for black and Latino children—one that continues all the way until the aftermath of the Great Recession, when it flat-lines. White children do better over this time period, as well.
According to the supplemental poverty measure, child poverty rates were at or near their all-time highs around the time A Nation at Risk was released in 1983, and since then have declined 48 percent for black children, 46 percent for Latino children, and 54 percent for white students. That is remarkable progress!
Nor are these the only social trends that look so promising. Teenage pregnancy rates peaked in the early 1990s and then started their spectacular fall; likewise with violent crime. So not only are fewer children today poor, they are also much less likely to be raised by a teenaged mother, and much less likely to be living in a violent neighborhood.
Figure 4. Pregnancy rates for adolescent females, by age and selected years, 1973–2013
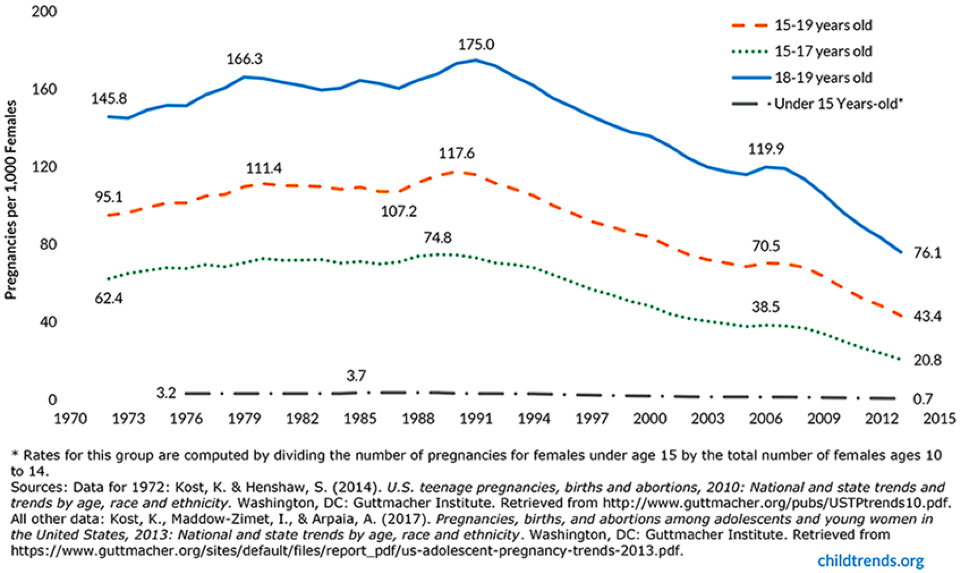
Figure 5. U.S. violent crime rate, 1960–2014
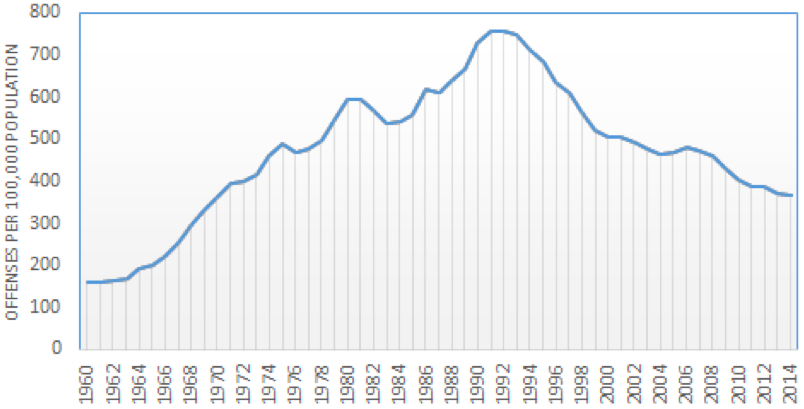
Source: Lori Robertson, “Dueling Claims on Crime Trend,” FactCheck.org (July 13, 2016), based on FBI Uniform Crime Reports.
Things have gotten better.
What all this means for K–12 education will be the subject of future posts, though let’s acknowledge that there’s long been a strong relationship between a child’s “socioeconomic status” and their academic outcomes, in general. And that when poor families become less poor, their kids tend to do better in school. So it stands to reason that improved social conditions for lots of children should be associated with improved results on achievement tests and graduation rates—which is precisely what we’ve been seeing.
In the meantime, let’s celebrate the fact that our country has made real progress in the War on Poverty. When we hear people argue that we should “fix poverty first”—before trying to fix our schools, or expect too much from them—we should acknowledge that, while we haven’t ended poverty, we’ve made a big dent. It’s good to know that, even in the case of vexing social problems, progress is possible.

