If you’re at all interested in school choice, you really should read a trio of recent reports.
They’re unusually informative. The CREDO study on urban chartering found that most city-based charter school sectors are producing substantially more academic growth than comparable district-run schools (others’ take on the report here, here, and here).
The Brookings “Education Choice and Competition Index” rates the school choice environment in 107 cities. An interactive tool helps you see how the cities compare with one another on everything from the accessibility of non-assigned educational options and the availability of school information to policies on enrollment, funding, and transportation.
The NACSA report on state policies associated with charter school accountability attempts to describe how laws, regulations, and authorizer practices interact to influence charter quality. The report translates NACSA’s excellent “principles and standards” for quality authorizing into a tool for describing, assessing, and comparing states (TBFI Ohio on the report here).
I could write at length about the finer points of each. They all have valuable arguments and findings.
But I want to call your attention to something in particular. The Brookings and NACSA reports assess environmental conditions (inputs) that might influence charter school performance (outputs). The CREDO study gauges charters’ academic growth relative to district-run schools (an output measure).
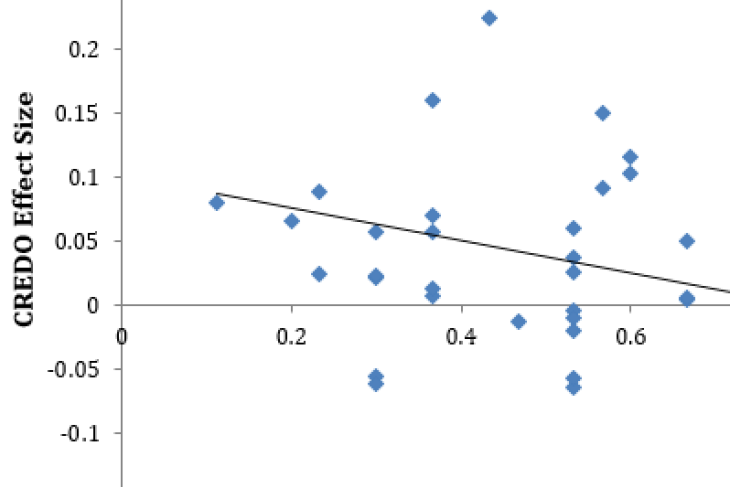
So I created two scatter plots to see how each of the inputs correlates with the output. For CREDO, I use an average of each city’s reading and math effects. For Brookings, I use each city’s score. I apply NACSA’s state score to each city in its borders.
Brookings and CREDO are positively correlated; the more choice and competition a city has, the higher-performing its charter sector.

Interestingly, however, the relationship between CREDO and NACSA is negative. This shows that cities with higher NACSA ratings are currently producing, on average, lower charter gains.

I’m not the first to point out this eye-catching relationship (or lack thereof) between charter policy ratings and performance. About six months ago, Marianne Lombardo from DFER showed the lack of correlation between NAPCS’s and CER’s charter-law scores and CREDO.
These scatters are not meant to suggest any particular causation. For example, we shouldn’t automatically deduce that increasing competition will improve charter performance or that increasing accountability in policy will torpedo it (more on this in moment). Lombardo explains this caveat and others in her post, so I won’t repeat them here.
But these data do raise lots of interesting questions and, I hope, encourage folks to do some further digging. In fact, I asked Macke Raymond (the lead CREDO researcher) and the teams at NACSA and Brookings what they thought of these results. Their responses were insightful.
Raymond suggested looking into the outliers. I’ve labeled a few (Boston, Newark, Ft. Worth, and Las Vegas), and it’s worth asking what’s happening in these places. She also wondered whether authorizer capacity might be playing a significant role (i.e., good policies probably can’t compensate for an authorizing body with a small staff and little expertise).
Greg Richmond and his colleagues at NACSA noted that with authorizer policies, it’s probably wiser to think of the causality arrow pointing in the other direction. That is, it’s not that strong accountability produces worse results; it’s that states with poor results have recently adopted better authorizing policies.
If true, charter performance would be a lagging indicator of authorizer reform; improved policies will take time to influence performance. Indeed, with two colleagues, I recently co-wrote a report about Ohio’s troubled charter policies. The state may legislate improvements this year, and if so, Ohio would score better on NACSA’s 2015 policy assessment. But obviously we shouldn’t expect school results to immediately skyrocket.
Another issue worth investigating is the wide variation in y-values at several spots along the x-axis in each graph. For example, between .5 and .6 on the choice index, Boston has the highest positive charter effect size, while two other cities (St. Petersburg and Ft. Myers) have negative effects.
Similarly, at .9 on the NACSA scale, there’s wide variation among cities on the y-axis. All of those cities are in Texas. So what in-state factors are at play? As Brookings’s Russ Whitehurst said in response to the NACSA scatter, policy provides the context, but cities can take advantage of those opportunities or not.
Needless to say, there’s much more to learn here.
“Correlation does not imply causation” is sound advice when it stops specious interpretations. But it amounts to sophistry when it impedes the further study of pregnant observations.
I hope casual readers of this piece are mindful of the former and that enterprising researchers are mindful of the latter.

