For almost a decade, the National Assessment Governing Board, which oversees the National Assessment of Educational Progress, studied whether and how NAEP could “plausibly estimate” the percentage of U.S. students who “possess the knowledge, skills, and abilities in reading and mathematics that would make them academically prepared for college.”
After much analysis and deliberation, the board settled on cut scores on NAEP’s twelfth-grade assessments that indicated that students were truly prepared—163 for math (on a three-hundred-point scale) and 302 for reading (on a five-hundred-point point scale). The math cut scores fell between NAEP’s basic (141) and proficient (176) achievement levels; for reading, NAGB set the preparedness bar right at proficient (302).
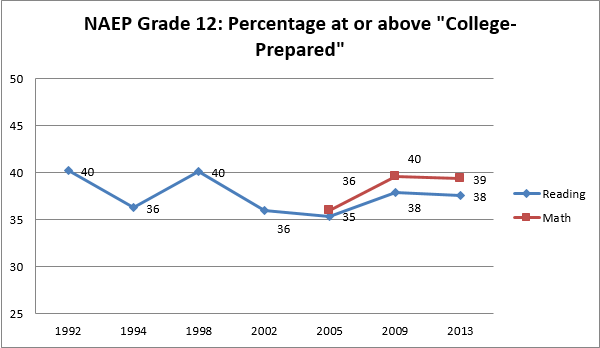
When the 2013 test results came out last year, NAGB reported the results against these benchmarks for the first time, finding that 39 percent of students in the twelfth-grade assessment sample met the preparedness standard for math and 38 percent did so for reading.
These preparedness levels remain controversial. (Among other concerns is the fact that the NAEP is a zero-stakes test for students, so there’s reason to wonder how many high school seniors do their best on it.) But NAEP might in fact be our best measure of college preparedness because, unlike the ACT, SAT ACCUPLACER, or Compass, it is given to a representative sample of high school students (at least those who make it to the twelfth grade). That doesn’t make it perfect, but it’s more revealing than the alternatives with regard to the population as a whole.
That was 2013. But what about over the long haul? We decided to use NAEP to track college preparedness over the past two decades. This was easy for reading, since the “prepared” level is set at the same point as “proficient”—and it’s a breeze to find the percentage of students at or above proficient since 1992. Math was harder both because its cut score fell between “basic” and “proficient” and because a new test and scale were introduced in 2005. We owe special thanks to the National Center for Education Statistics, which calculated the results for math that are displayed below using restricted NAEP data.
Here’s what we found—the trends for “college preparedness” over time—since 1992 for reading and since 2005 for math:

The main storyline is consistency. The rates have bounced between 35 and 40 percent; they are currently up a bit since a low point in 2005. Considering that U.S. high school graduation rates are also up significantly over this period—and thus a greater portion of students are reaching the twelfth grade—these are mildly encouraging trends, despite the overall flatness of the lines.
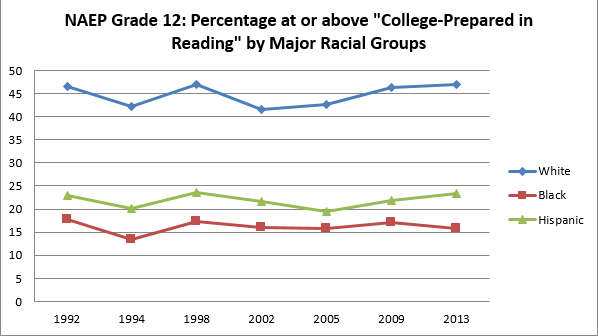
Furthermore, the (mostly) flat lines are not due to “Simpson’s Paradox.” In education, that phenomenon explains why some aggregate trend lines look flat or worse, even though every student subgroup is improving, because of the changing demographic composition of the total student population (e.g., lower-scoring Latino students are gradually replacing higher-scoring white students). In this case, though, each of the three main subgroups shows basically the same flat trends:

Nobody should celebrate the fact that fewer than 40 percent of high school seniors are academically prepared for college-level work. (ACT shows similar “readiness” proportions for those who take its high-stakes test.) But why do we have the sense that this problem has worsened over time?
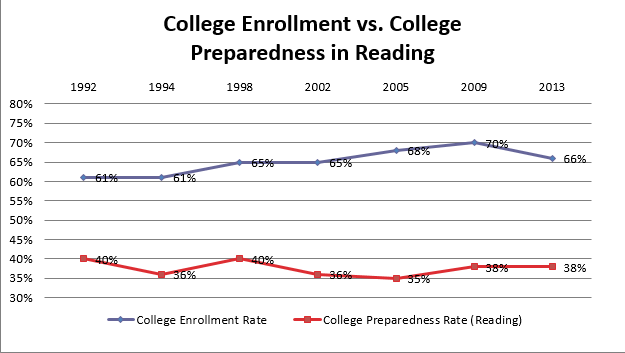
That’s because the proportion of recent high school graduates attending college is far higher than the proportion of twelfth graders who are prepared for college—and that gap has worsened over time. It started at 21 percentage points in 1992, grew to 33 points in 2005, and stood at 28 points as of 2013. (These numbers are for reading.)

(Note: The college enrollment numbers come from Census Bureau table 276 - College Enrollment of Recent High School Completers, defined as: “persons 16 to 24 years old who graduated from high school in the preceding 12 months. Includes persons receiving GEDs.”)
To repeat: The “college preparation gap” is larger now than in 1992 even though the college preparedness rate has remained relatively flat, due to the fact that the proportion of recent high school graduates enrolling in college rose sharply between 1994 and 2009—from 61 percent to 70 percent—before easing back down to 66 percent in 2013.
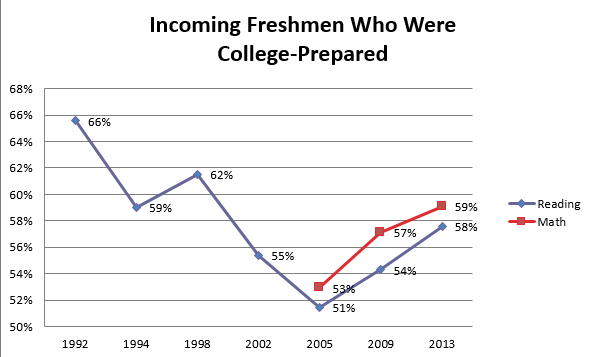
Combine those two trends—college enrollment and college preparedness—and we can make a rough estimate of the number of students who arrived on campus prepared. The next chart takes the proportion of twelfth graders testing at the college-prepared level in reading and divides it by the proportion of that class of students immediately enrolling in college. (To be sure, we have to make a significant assumption that virtually all students who reached the “college-prepared” level on NAEP enrolled in college. That is a stretch, but probably not too much of a stretch to make this exercise useful.)

(Note: For each year, we divided the proportion of students who were college-prepared by the proportion that enrolled in college. For 1992, for example, 40% were college prepared and 61% enrolled in college. 40%/61% = 66%.)
No wonder that, around 2005, the country felt an acute sense of crisis about so many students arriving on campus unready for college-level work. Barely a majority of freshman were “college-prepared,” versus two-thirds of students a dozen years earlier.
But there’s a tiny bit of good news, which is that the preparedness rates of incoming college students are on the rise. That’s partly because of slight improvements in student achievement at the twelfth-grade level, but mostly because of declining college enrollment rates.
***
What to make of all this? To our eyes, these pictures help explain why America’s college matriculation rate is up but its college completion rate is not: We’ve succeeded at motivating more young people to enroll, but we haven’t prepared more of them to succeed at it. All of the higher education reforms in the world—“fixing” remedial education, providing additional supports to students, easing the debt burden, making community colleges “free”—won’t add up to a hill of beans unless our K–12 system gets a lot better at producing young people with the academic skills to succeed once they arrive on campus. (The alternative is to make college easier, which would only diminish the value of completing it.)
Beefing up the effectiveness of the K–12 enterprise is, of course, the aim of ambitious efforts like no-excuses charter schools, the Common Core State Standards, and endeavors to boost teacher effectiveness—all of which deserve support. But it's hard to picture anything on the horizon boosting the college preparedness rate of American twelfth graders above, say, 50 percent any time soon. (Keep in mind that for more than two decades now, it's never been above 40 percent.)
So think about it differently. Another way to make sure that more freshmen are ready for college is to encourage young people who aren’t ready for college to head in different directions. As Charles Murray recently wrote in the Wall Street Journal, “What we need is an educational system that brings children with all combinations of assets and deficits to adulthood having identified things they enjoy doing and having learned how to do them well.” That means taking the “career” half of “college- and career-ready” much more seriously, especially when designing options for high school students.
You may not agree. So what do you make of these data yourself? Let the conversation begin.

