In the reauthorization debate, civil rights groups are pressing to have ESEA force states to "do something" in schools where students as a whole are making good progress but at-risk subgroups are falling behind. Their concerns are not unreasonable, to be sure. Schools should ensure that all students, especially those who are struggling academically, are making learning gains.
Yet it’s not clear how often otherwise good schools fail to contribute gains for their low-achievers. Is it widespread problem or fairly isolated? Just how many schools display strong overall results, but weak performance with at-risk subgroups?
To shine light on this question, we turn to Ohio. The Buckeye State’s accountability system has a unique feature: Not only does it report student growth results—i.e., “value added”—for a school as a whole, but also for certain subgroups. Herein we focus on schools’ results for their low-achieving subgroups—pupils whose achievement is in the bottom 20 percent statewide—since this group likely consists of a number of children from disadvantaged backgrounds, including from minority groups.
(The other subgroups with growth results are gifted and special needs students, who may not be as likely to come from disadvantaged families or communities. The state does not disaggregate value-added results by race or ethnicity.)
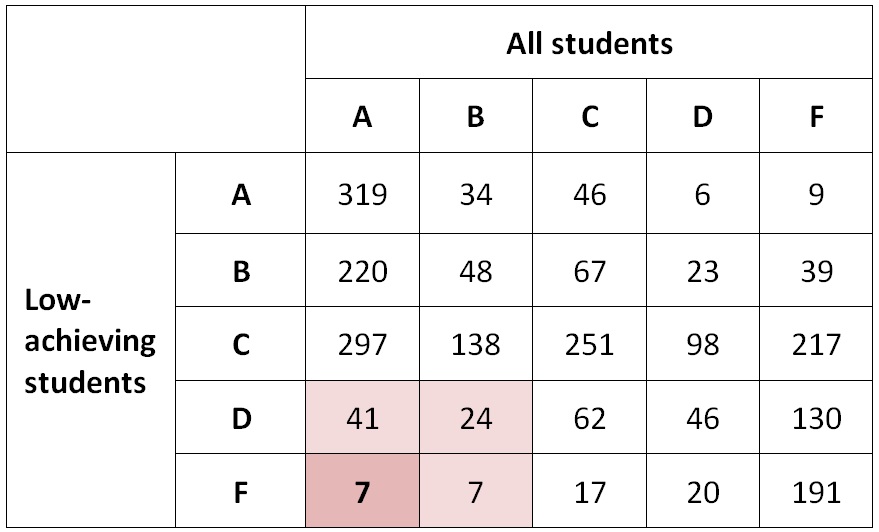
In 2013–14, Ohio awarded A–F letter grades for 2,357 schools along both the overall and low-achieving value-added measures. These schools are primarily elementary and middle schools (high schools with grades 9–12 don’t receive value-added results). The table below shows the number of schools within each A–F rating combination.
Table 1: Number of Ohio schools receiving each A–F rating combination, by value added for all students and value added for low-achieving students, 2013–14

You’ll notice that a fairly small number of schools perform well overall while flunking with their low-achievers. Seventy-nine schools—or 3.3 percent of the total—received an A or B rating for overall value added while also receiving a D or F rating for their low-achieving students. (Such schools are identified by the shaded cells.) Meanwhile, just seven schools—or a miniscule 0.3 percent—earned an A on overall value added but an F on low-achieving value added. These are the clearest cases of otherwise good schools in which low-achievers fail to make adequate progress.
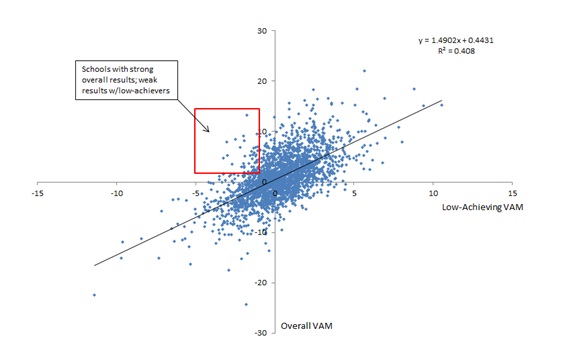
In the chart below, we present each school’s value-added scores, both overall and for their low-achieving subgroup. What becomes apparent in this chart is the fairly close relationship between a school’s overall performance and its performance with low-achievers. In other words, if a school does well along overall value added, it typically does well with low-achievers. Conversely, if a school does poorly overall, it’s also likely to perform poorly with low-achieving students. Worth noting, of course, is that the enrollment of some schools consists of a sizeable number of low-achievers; in these cases, we’d expect a very close correlation.
Chart 1: Value-added scores of Ohio schools, by value added for all students (vertical axis) and value added for low-achieving students (horizontal axis), 2013–14

Data source (for Table 1 and Chart 1): Ohio Department of Education Notes: The overall value-added scores are based on a three-year average (vertical axis), while scores for low-achieving students are based on a two-year average (horizontal axis). Ohio first implemented subgroup value-added results in 2012–13, hence the two-year average. The state has reported overall school value added since 2005–06. The number of schools is 2,357. Results are displayed as “index scores,” which are the average estimated gain/standard error; these scores are used to determine schools’ A–F rating. The correlation coefficient is 0.64.
So do good schools leave low-achievers behind? Generally speaking, the answer is no. A good school is usually good for all its students (and a bad school is typically bad for all its students).
Are there exceptions? Certainly—and thought should be given around what should be done in those cases. Local educators, school board members, parents, and community leaders must be made aware of the problem, and they should work together to find a remedy.
But should state or federal authorities step in to intervene directly? That’s less clear. While the state might do some good for low-achievers by demanding changes, it’s also equally plausible that intervention could aggravate the situation, perhaps even damaging an otherwise effective school.
The Ohio data show it to be a rare occurrence when a school performs well as a whole but does poorly with its low-achieving subgroup. One might consider this a matter of common sense—it’s plausible that high-performing schools contribute to all students’ learning more or less equally. Do these exceptions justify a federal mandate that may or may not work? In my opinion, probably not. Do these isolated cases justify derailing an otherwise promising effort to reauthorize ESEA? Definitely not.

