The Education Trust recently responded to two analyses in which I looked at the relationship between overall and disadvantaged subgroup performance at an individual school level. To summarize their critique, they suggest that even minor differences between overall and subgroup ratings warrant serious concern in an accountability context—possibly including sanctions. For example, a school carrying an overall A rating, but a C rating for disadvantaged students, could be considered to be “growing the achievement gap” and thus in need of an intervention.
Their approach, however, fails to recognize that in school rating systems, a one- or even two-rating deviation may not reflect significant differences in performance. Bear in mind that with growth results, we’re dealing with statistical estimates of learning gains that also include a margin of error. In some cases, schools receive different letter grades, but their underlying growth results aren’t distinguishable from each other.
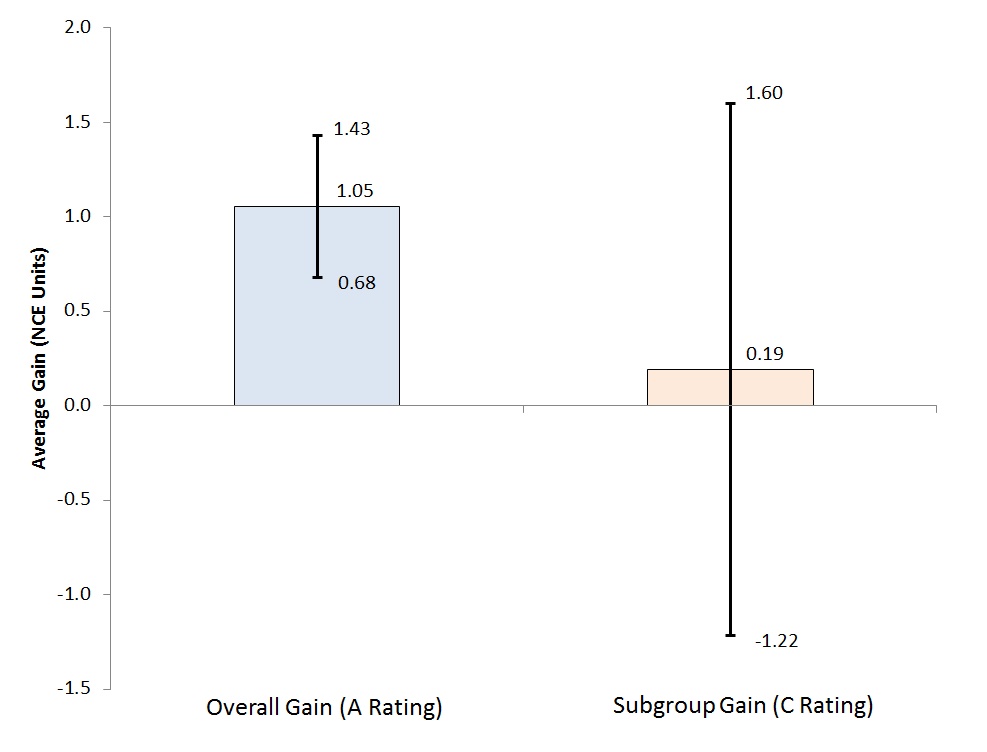
Consider an example using one school’s overall and subgroup results (Chart 1). As you can see, the range of plausible values for the gains made by all overlap with those made by low-achieving students. As such, we cannot rule out the possibility that the two groups’ gains are actually identical. We wouldn’t realize this by simply taking the A–F ratings at face value. (Worth noting is that the low-achieving subgroup is part of the overall group, which may make the comparison less clear.)
Chart 1: Range of plausible values of overall versus subgroup gains, A/C rated school in Ohio, 2013–14

Source: Ohio Department of Education Notes: Chart displays the average estimated gain for students overall and for low-achieving students specifically, as well as the range of plausible values around that estimate [i.e., a 95 percent confidence interval that is the estimated gain +/- (1.96 * standard error)]. The larger standard error for the subgroup value-added gains likely reflects its smaller sample size relative to all students. To yield a value-added score, which is then converted into an A–F rating, Ohio performs the following calculation: average estimated gain / standard error. For an accessible discussion on interpreting value-added results and standard errors, see here.
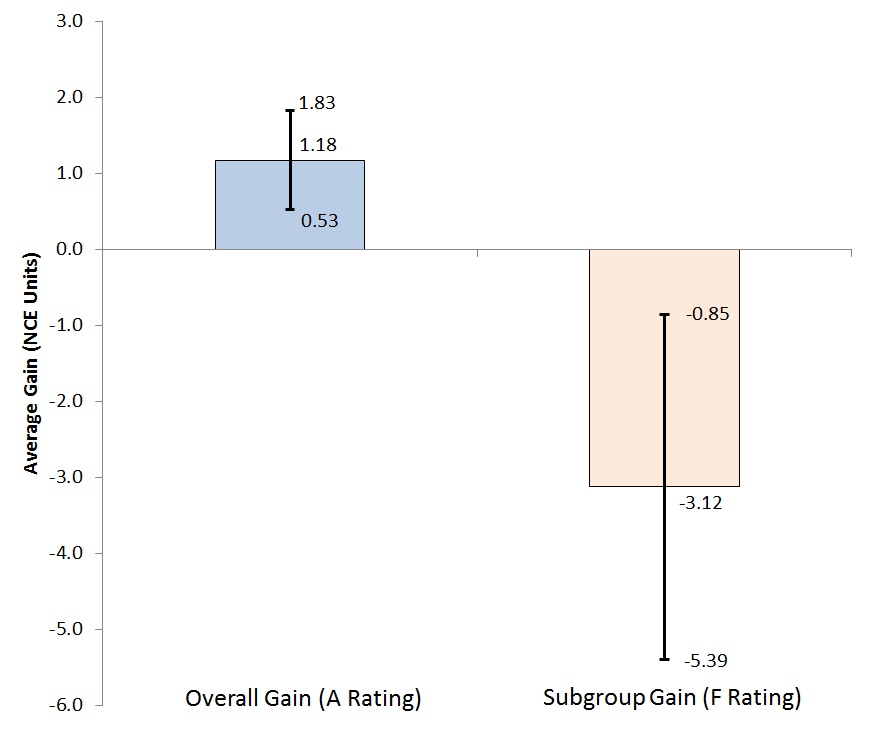
But schools with a large difference in overall versus subgroup ratings are worthy of concern. Here’s why: When schools have big discrepancies in ratings, the differences in the underlying gains are more likely to be significant. For example, Chart 2 shows the average gain and the margins of error for an A (overall)/F (subgroup) school; notice how the range of plausible values doesn’t overlap—a significant difference. However, as my previous analyses showed, schools such as these are virtually nonexistent in both Ohio and Colorado.
Chart 2: Range of plausible values of overall versus subgroup gains, A/F rated school in Ohio, 2013–14

While the thinking behind the Education Trust’s analysis is laudable—raising the achievement of needy students is imperative—they also play a risky game with accountability policy. When it comes to school interventions, there should be clear evidence that a problem exists before corrective action is undertaken. Looking at marginal differences in state ratings doesn’t cut it; rather, it makes a mountain out of a ratings molehill.

