Yesterday, the U.S. Department of Education released data from the 2017 National Assessment of Educational Progress (NAEP). Given every two years to fourth and eighth graders in math and reading (and other grades and subjects though sometimes on a less frequent basis), NAEP is an important check on how Ohio students achieve against rigorous national standards and compare to their peers in other states. The big takeaway is that student achievement is stuck in neutral across much of the nation. But there’s more to unpack, especially here in Ohio.
Note that the NAEP data are simply descriptive—they give us information about achievement at face value. They can’t tell us with any certainty what’s causing these patterns and trends, including how the shift to tablet-based assessments, economic or demographic trends, and other dynamics that may influence achievement are affecting results. Moreover, other excellent analyses of NAEP data are already out, including a demographically adjusted look at the 2017 results by state. In the days ahead, we’ll take closer looks at “cohort gains” in Ohio compared to other states—i.e., examining fourth graders results in 2013 and comparing them to 2017 eighth grade results—as well as dig into performance by subgroup.
With all this in mind, let’s dive into a first look at the Ohio data.
1. Ohio outperforms the national average … but not by much
For years, roughly two in five Ohio students have reached NAEP’s proficiency standard. That story remains unchanged in 2017, as 39 to 41 percent of Ohio students reached proficiency, depending on the grade and subject. (Note: NAEP’s standard is considerably higher than Ohio’s proficiency bar on state exams.) When compared to the national averages, Ohio performs higher in all four subjects, though just two are statistically significant—fourth grade reading and eighth grade math. Ohio should continue to be proud of its national standing; we’re better than most. But given that the state is now outperforming the national averages by rather slim margins, we can’t afford to stand still lest the rest of the nation pass us by.
Figure 1: Proficiency rates on NAEP, Ohio versus national, 2017

2. Reading achievement has been stagnant for a decade
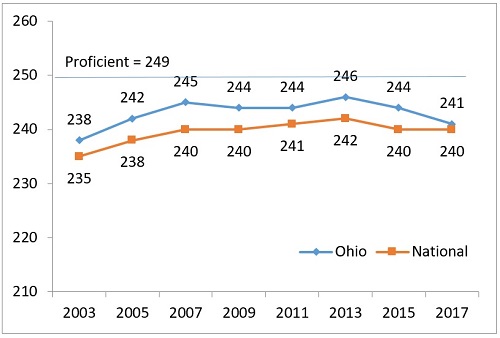
Ohio’s reading performance on NAEP has been flat for almost a decade and a half in both fourth and eighth grade. Consider Figures 2 and 3, which show the average reading scores in Ohio. Compared to 2003, the results today show little progress: In fourth grade, Ohio has improved by three points, and in eighth grade, just a single point—a touch slower than the national rate in both grade levels. Although the national average has not risen dramatically in reading either, Ohio’s lack of improvement should concern policymakers and educators. Appreciably moving the achievement needle may require a major break in the way schools approach literacy, shifting to a more content-rich and knowledge-based curriculum that starts in elementary school, as E.D. Hirsch and others have suggested. But first we need to acknowledge something is amiss in reading instruction.
Figure 2: Average scale scores in fourth grade reading, Ohio versus national, 2003–17

Figure 3: Average scale score in eighth grade reading, Ohio versus national, 2003–17

3. Math achievement has been a mixed bag in more recent years
Unlike reading, math performance has trended more consistently upwards over the past decade. That is, until 2015 when math scores dipped noticeably in Ohio and nationally. The 2017 results in Ohio went in different directions. In fourth grade math, NAEP scores continued to slide—mainly the result of declines among white students, as my colleague Mike Petrilli found. That’s worrisome and puzzling. Might the laser focus on early literacy be crowding out math instruction? Did the Great Recession depress achievement? It’s impossible to know, but policymakers should monitor whether this trend persists. On the other hand, in eighth grade math, Ohio’s average score rebounded. That’s good news, perhaps indicating that the 2015 decline was a one-year bump in the road.
Figure 4: Average scale score in fourth grade math, Ohio versus national, 2003–17

Figure 5: Average scale score in eighth grade math, Ohio versus national, 2003–17

4. Ohio is competitive, but not at the top, in comparison to nearby states
Just as The Ohio State University aspires to win the Big Ten conference championship every year in athletics, the Buckeye State should aspire to be the cream-of-the-crop when it comes to student achievement among other Upper Midwest states. How does Ohio fare among its nearest neighbors? Figure 6 shows comparisons in fourth grade that indicate Ohio stacks up pretty well among its nearby states, but also has room to grow. Figure 7 repeats the results for eighth grade; it shows Ohio toward the middle in reading, but higher in math. Note, of course, that minor differences between states’ proficiency rates are likely to be statistically insignificant. The results from 2017 generally track those from the 2015 NAEP iteration.
Figure 6: Fourth grade proficiency in reading and math, Ohio versus nearby states, 2017

Figure 7: Eighth grade proficiency in reading and math, Ohio versus nearby states, 2017

5. Getting to the top spot in the nation will be a long road
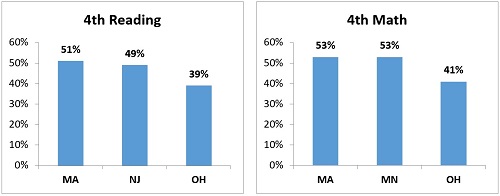
The best careers of the future will likely fall to states and cities with the strongest knowledge and skills base. Hence, our future prosperity hinges in no small part on how well Ohio schools educate today’s students. Although Ohio has performed modestly well against national averages and in relation to nearby states, the Buckeye State should aim for the top of the mountain so that it can continue to compete economically on a national—and global—stage. Figures 8 and 9 indicate that Ohio has its work cut out to make it to the top. In both fourth and eighth grade, the state trails national leaders—Massachusetts, Minnesota, and New Jersey—by about 10 percentage points. These are, of course, “raw” achievement data, but demographically adjusted NAEP data also indicate that Ohio’s in the top half of states but doesn’t quite crack the highest echelons.
Figure 8: Fourth grade proficiency rates of top two states versus Ohio, 2017

Figure 9: Eighth grade proficiency rates of top two states versus Ohio, 2017

* * *
NAEP regularly forces us to pause and reflect on Ohio’s academic progress over time and how it fares in comparison to other jurisdictions. Sometimes the news is worth celebrating; other times it exposes troubling patterns. So is Ohio a state “at risk”? The answer depends, I suppose, on where you sit. If you’re mostly satisfied with above average rankings, then the answer might be no. But if you—like me—want Ohio to lead the nation in academic achievement because we believe that Buckeye students absolutely can be the best, then today’s results should stir us to pursue something better. Ohio has a proud history of committing to education, and it has many of the ingredients for a top-of-the-class school system. Excellence is within reach, but we’ll need to continue taking the long, challenging journey towards reaching our state’s fullest potential in education.

