Editor’s note: This is an edition of “Advance,” a newsletter from the Thomas B. Fordham Institute written by Brandon Wright, our Editorial Director, and published every other week. Its purpose is to monitor the progress of gifted education in America, including legal and legislative developments, policy and leadership changes, emerging research, grassroots efforts, and more. You can subscribe on the Fordham Institute website and the newsletter’s Substack.
The latest civics and U.S. history results for the National Assessment of Education Progress were released this week for eighth graders, and the declines since 2018 were predictably and lamentably bad. This is the third release of NAEP scores in the last year, with the others being math and reading marks for nine-year-olds, as well as for fourth and eighth graders. None of it has been good, and much of it is the fault of the pandemic and its deleterious effects. The losses will take years to recover, with the lowest scorers and most marginalized students suffering the most harm.
This newsletter, however, focuses on advanced education—that is, how we’re doing as a country with kids who reach the high end of the achievement spectrum. In that regard, NAEP yields two kinds of informative results: the percentage of test-takers who reach its “Advanced” level, as set by the test’s governing board, and the composite scale score for those who reach the 90th percentile.
Looking closely at those metrics, the new data look a bit different for high achievers than for American K–12 students in general—just as they did back in October for the math and reading results. They also don’t fit any obvious narrative, which is something that’s best avoided with NAEP anyway, given analysts’ long history of “misNAEPery.”
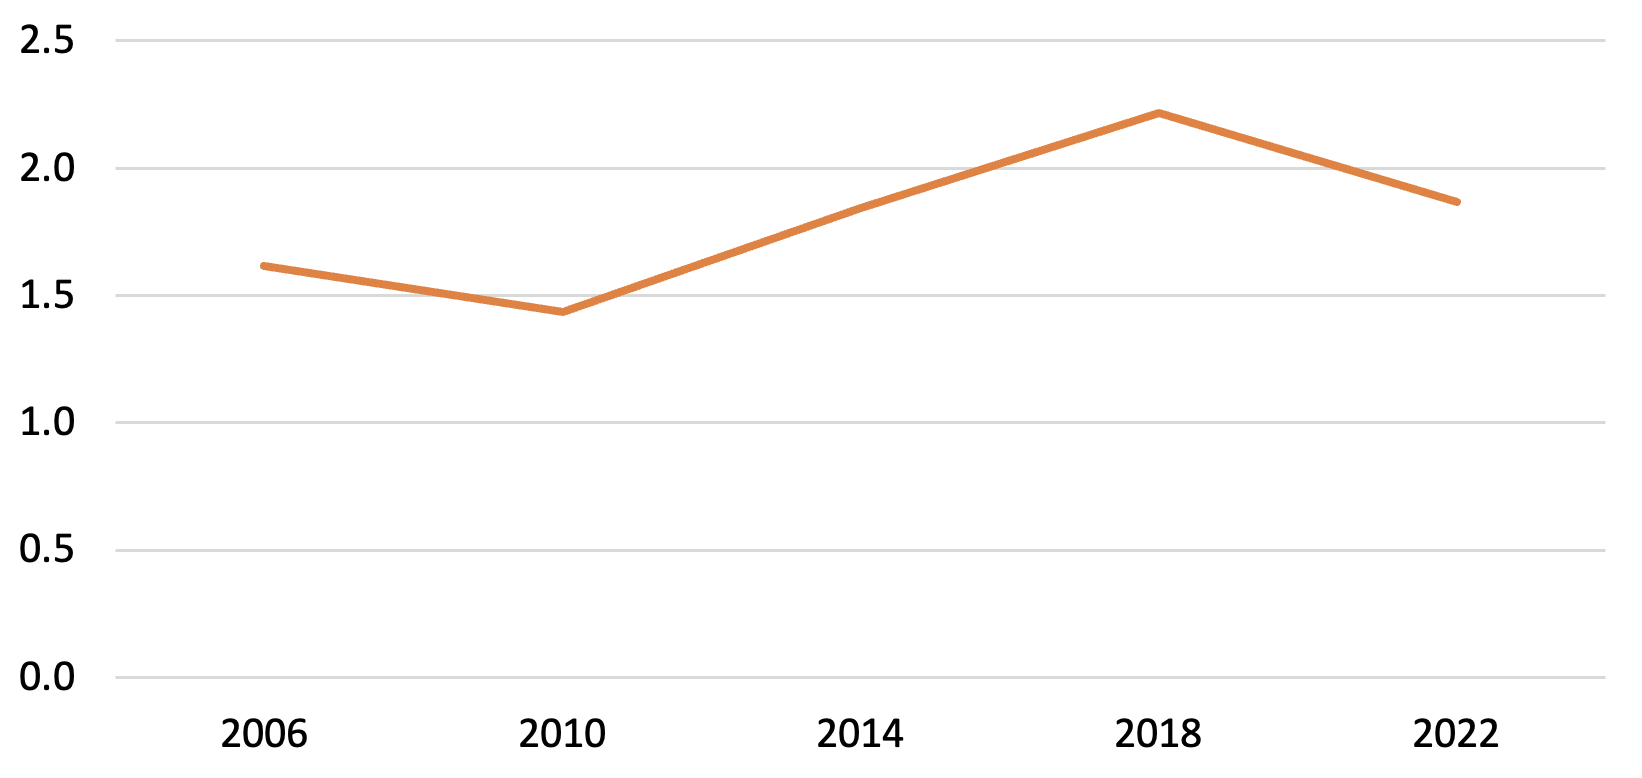
Most notably, in the only bit of maybe good news, more Black students reached the Advanced level in civics than ever before—even if it was a very low 1 percent—and their 90th percentile scores were flat compared to 2018. Meanwhile, Hispanic results on both measures were slightly down since that year, White results were moderately down, and Asian results were down bigtime.
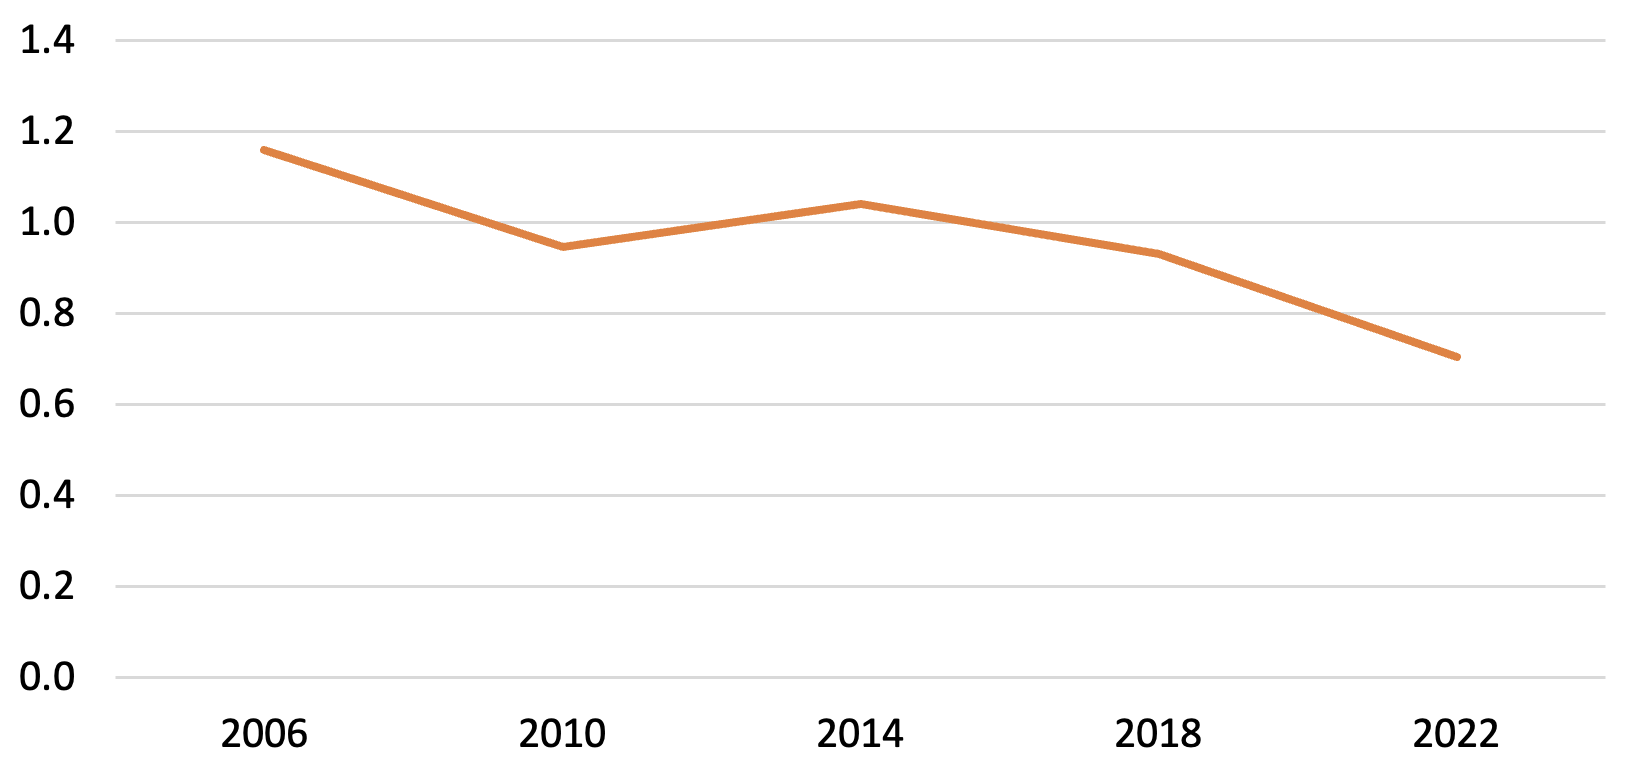
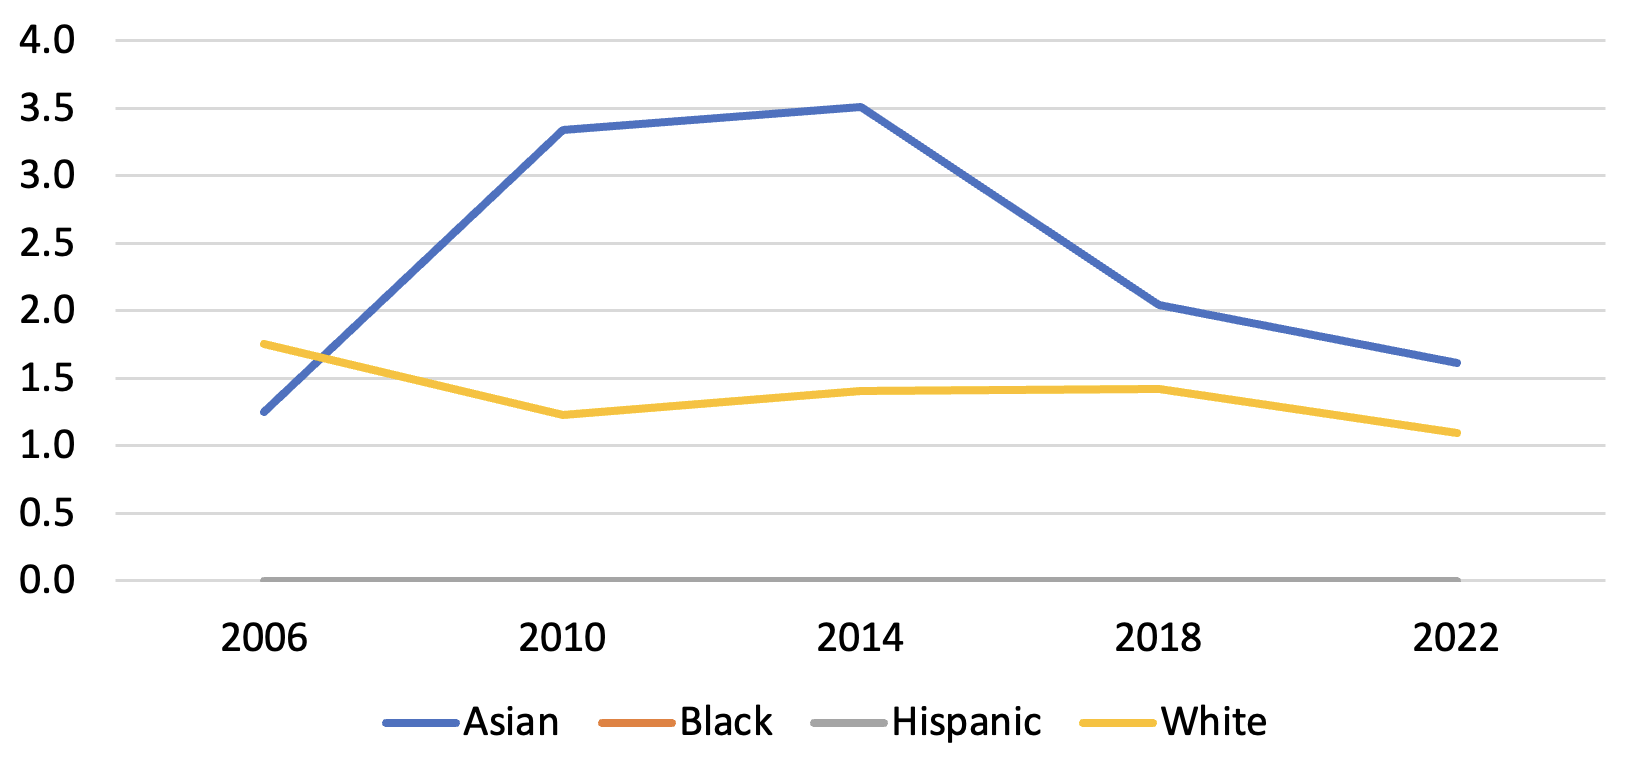
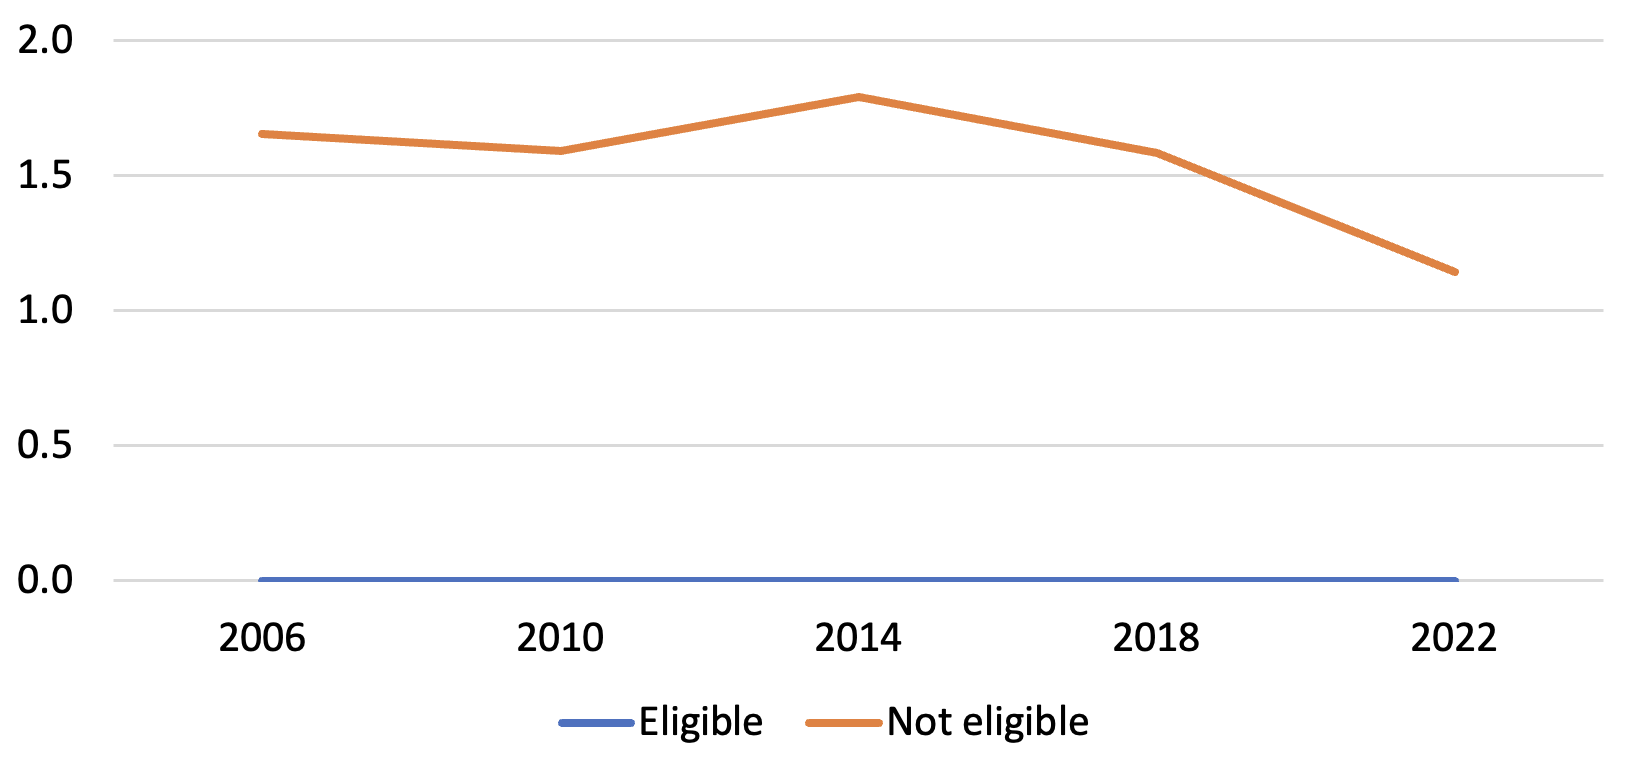
As for U.S. history, scores fell for high-achieving students as a whole, and regardless of race or ethnicity or eligibility for free or reduced-price lunch. But the drops seem to merely continue losses that began in 2018 for 90th percentile scores—and 2014 for the percentage Advanced—long before the pandemic struck. In other words, Covid’s educational harm doesn’t seem have to accelerated declines in the subject, or at least not by much. This runs counter to the other NAEP results over the last year, where the virus’s effects have been glaring.
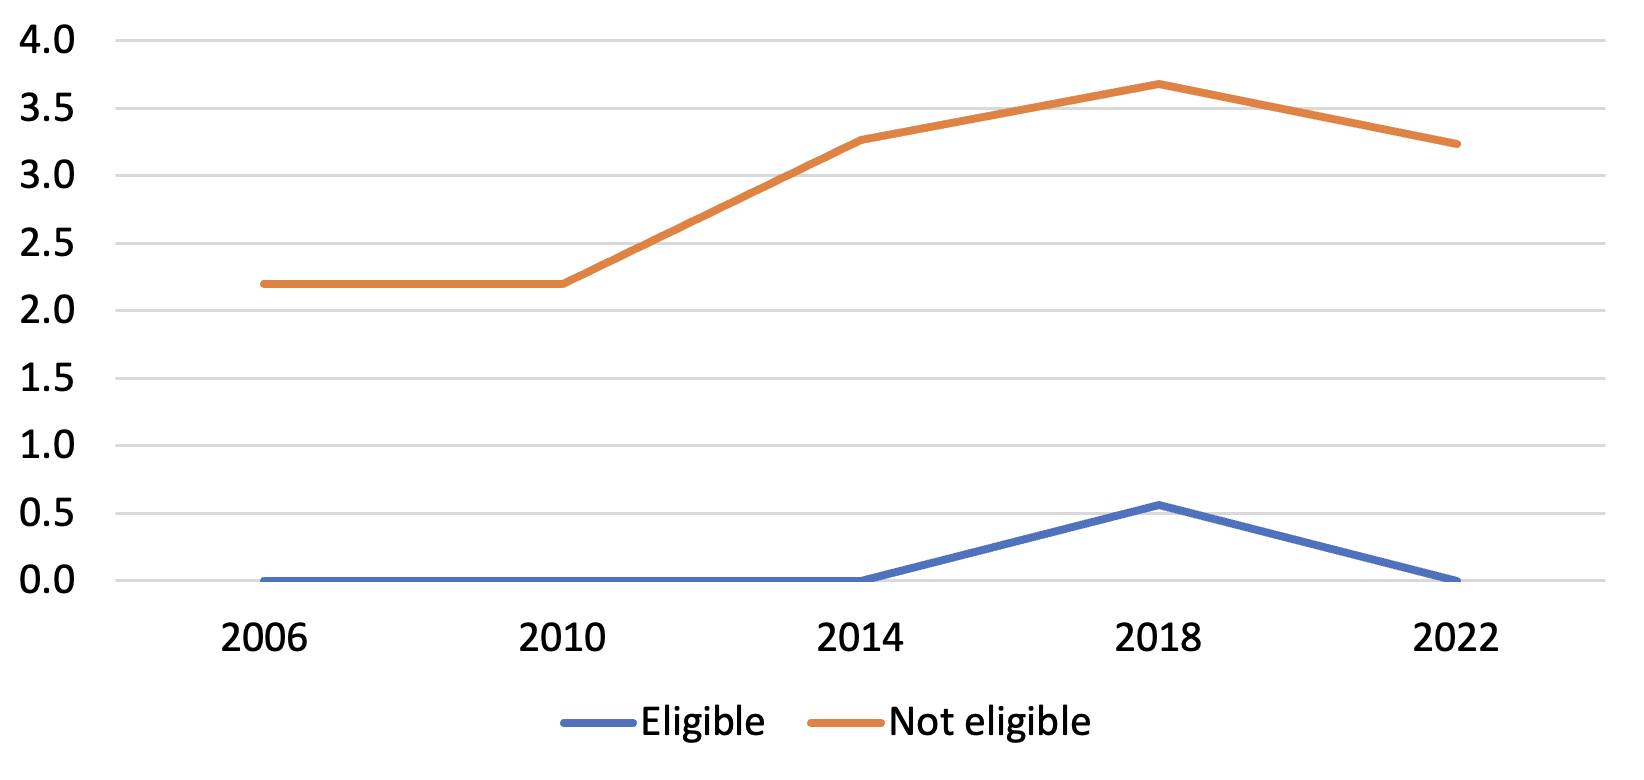
Moreover, in both subjects, results at the high end are, regardless of Covid, simply awful. In U.S. history, the percentage of American eighth graders who reach the Advanced level has never exceeded 1.5 percent. And the percentages of Black, Hispanic, and low-income children reaching that mark has always rounded to zero. In civics, the situation is scarcely better, with the nationwide proportion never reaching 2.5 percent, and for Black, Hispanic, and low-income students, never getting to 1 percent.
The data also do not neatly correlate with reading results for eighth graders, even though the country-wide results in civics and history—not just among top-scorers—“tend to track (only more so) our literacy challenges,” as my colleague Checker Finn wrote earlier this week. Until the pandemic, reading results at the high end of achievement has been trending up for well over a decade, whereas U.S. history results were already declining for these students when the virus hit. And civics marks at the high end didn’t start to rise until 2010, and compared to reading, fell off much more sharply during Covid and have always been much lower.
As such, perhaps the best way to present these data is to include a variety of charts with no further analysis. Readers should be aware of these results, free to analyze them, and considering the subjects tested are civics and history, ponder what they mean for our schools, our communities, and our country.
U.S. history
All students
Figure 1. NAEP U.S. history, 90th percentile scores, all eighth-grade students, 2006–22
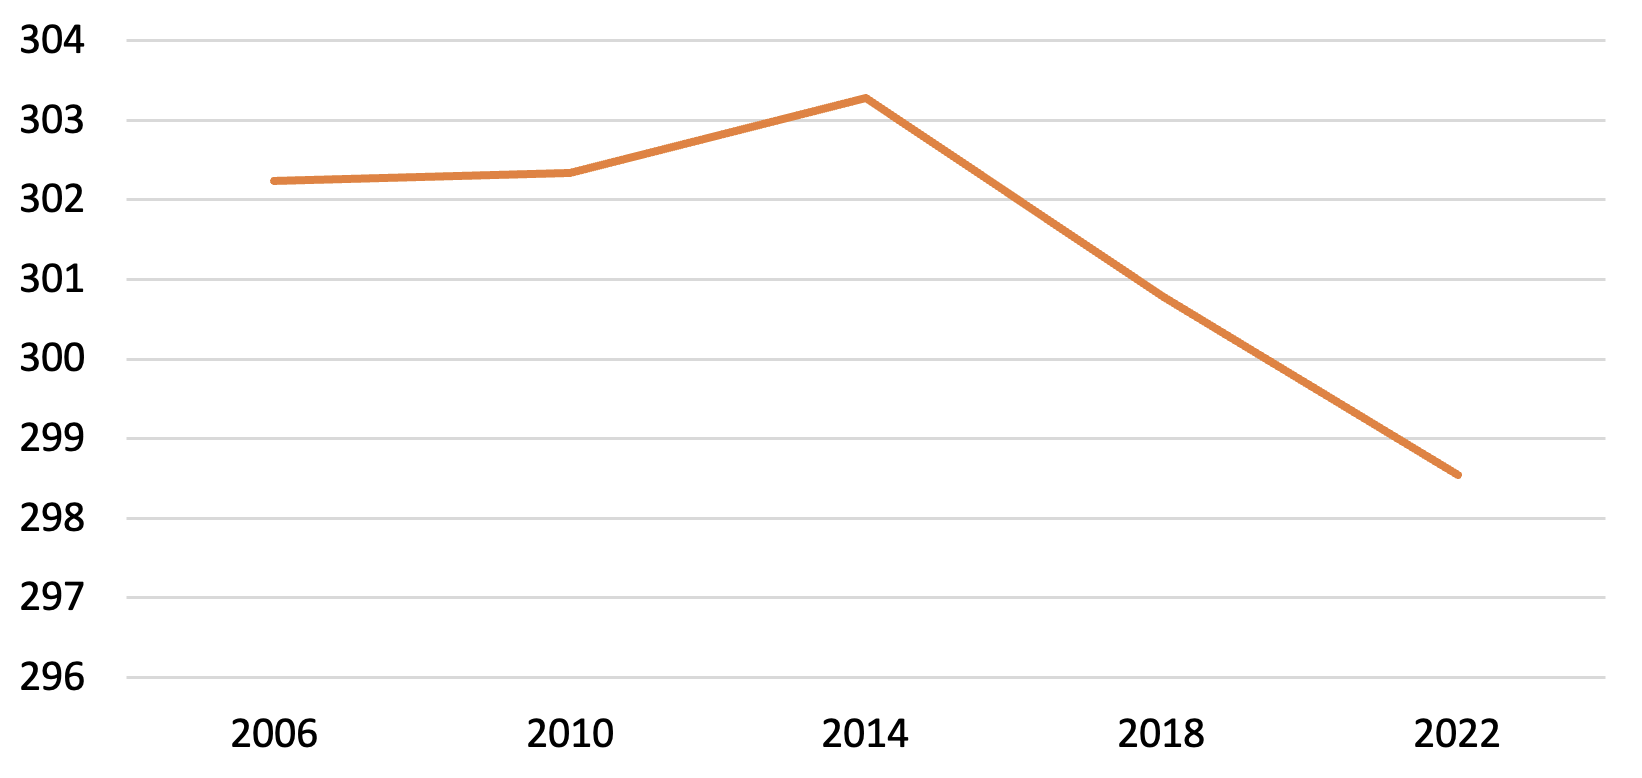
Figure 2. NAEP U.S. history, percentage at Advanced level, all eighth-grade students, 2006–22
By race and ethnicity
Figure 3. NAEP U.S. history, 90th percentile scores, eighth grade, by race and ethnicity, 2006–22
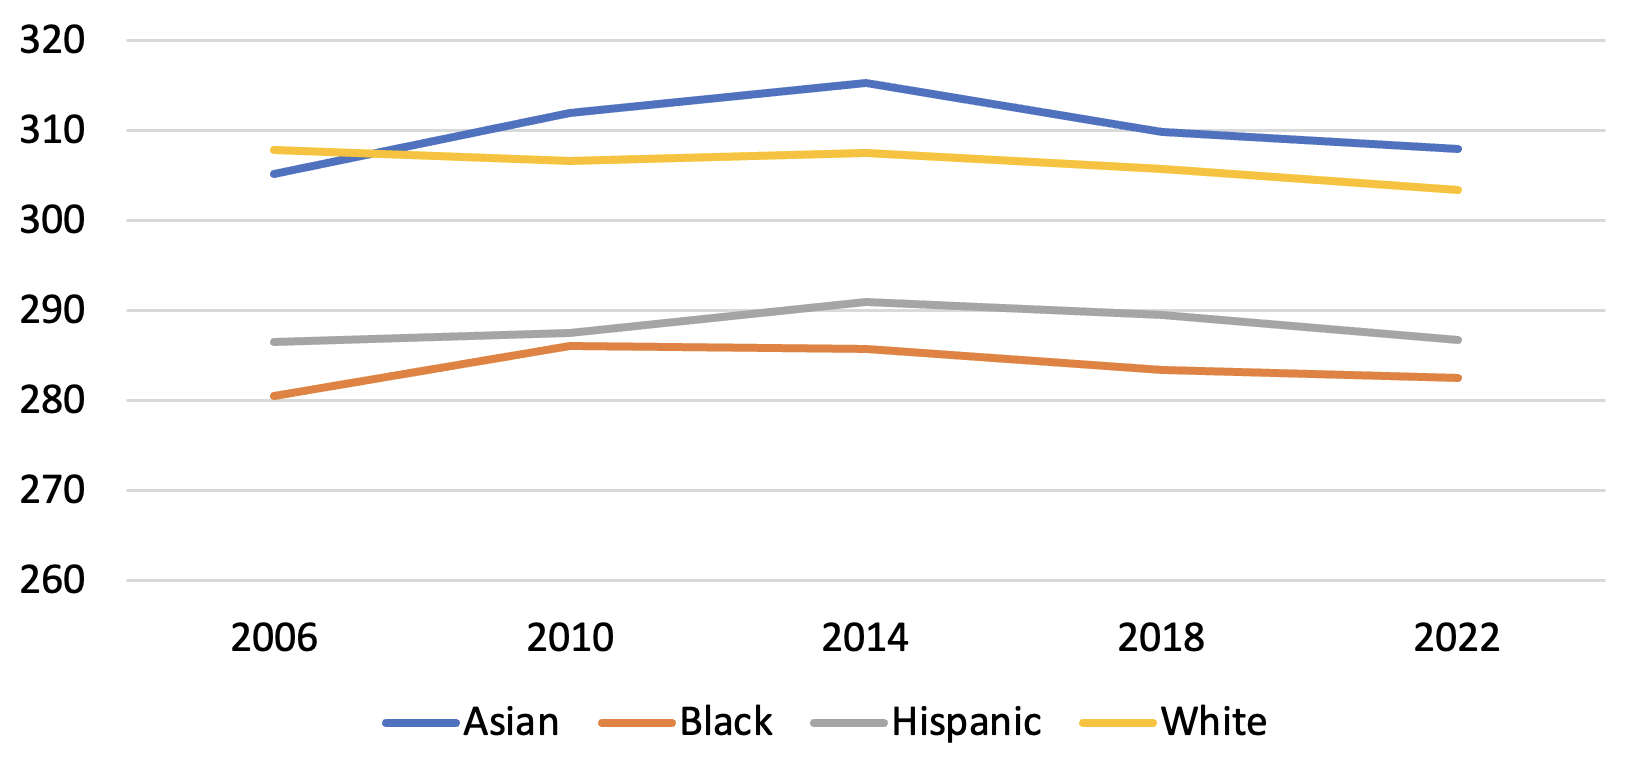
Figure 4. NAEP U.S. history, percentage at Advanced level, eighth grade, by race and ethnicity, 2006–22
By eligibility for free or reduced-price lunch
Figure 5. NAEP U.S. history, 90th percentile scores, eighth grade, by eligibility for free or reduced-price lunch, 2006–22
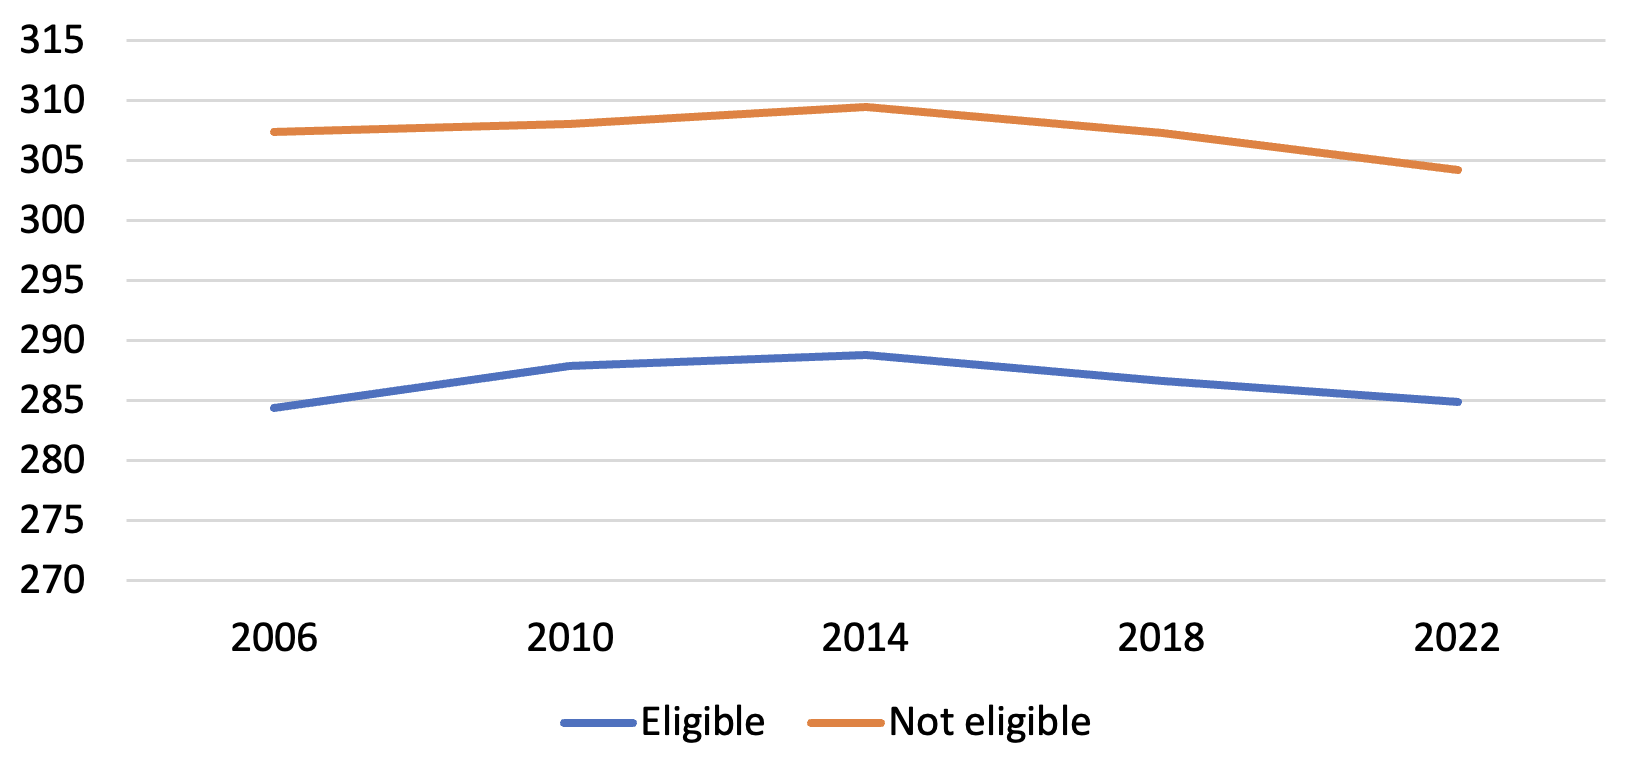
Figure 6. NAEP U.S. history, percentage at Advanced level, eighth grade, by eligibility for free or reduced-price lunch, 2006–22
Civics
All students
Figure 7. NAEP civics, 90th percentile scores, all eighth-grade students, 2006–22
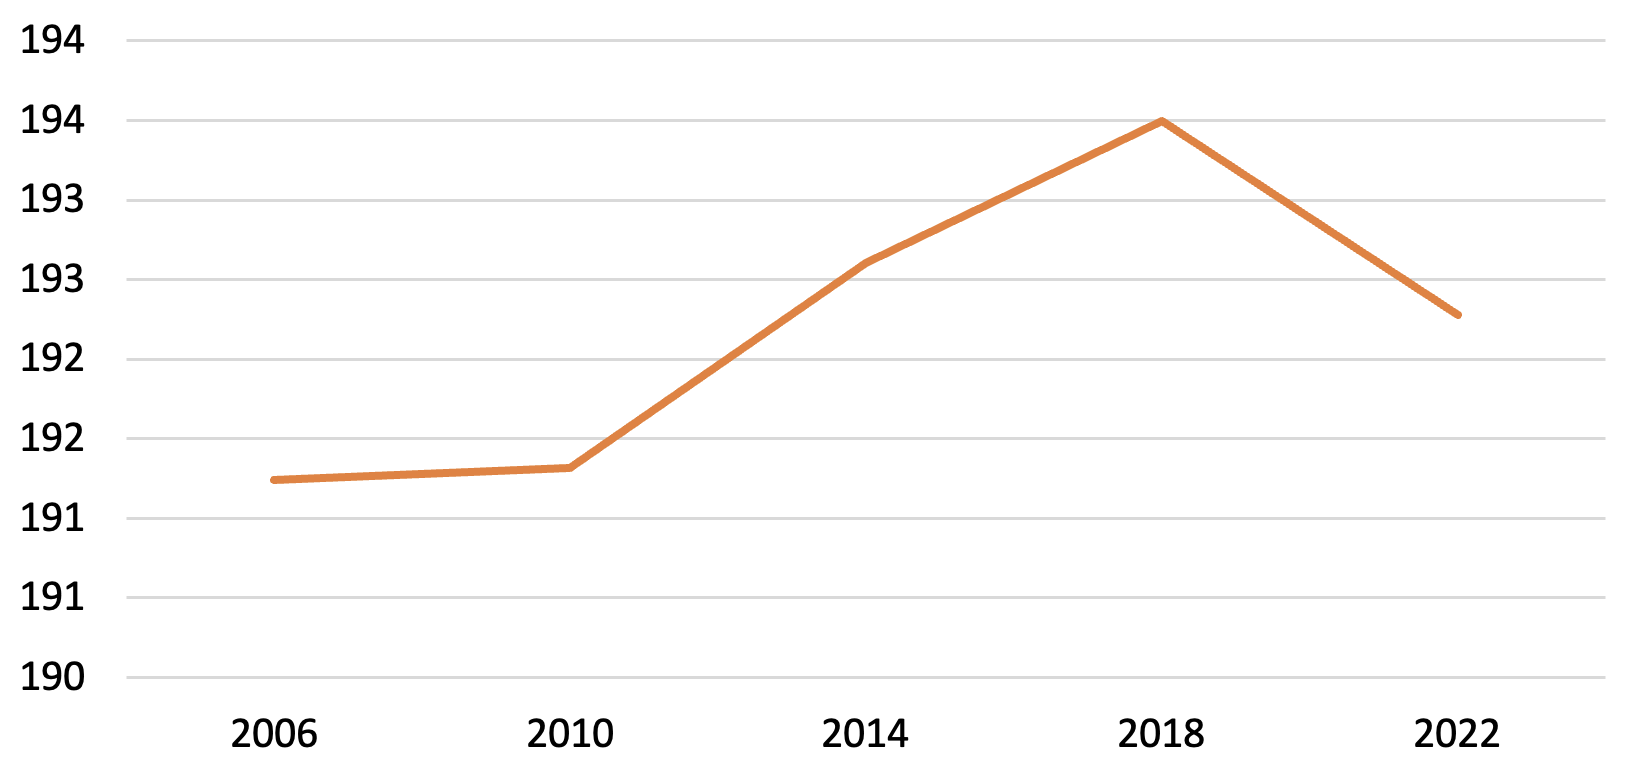
Figure 8. NAEP civics, percentage at Advanced level, all eighth-grade students, 2006–22
By race and ethnicity
Figure 9. NAEP civics, 90th percentile scores, eighth grade, by race and ethnicity, 2006–22
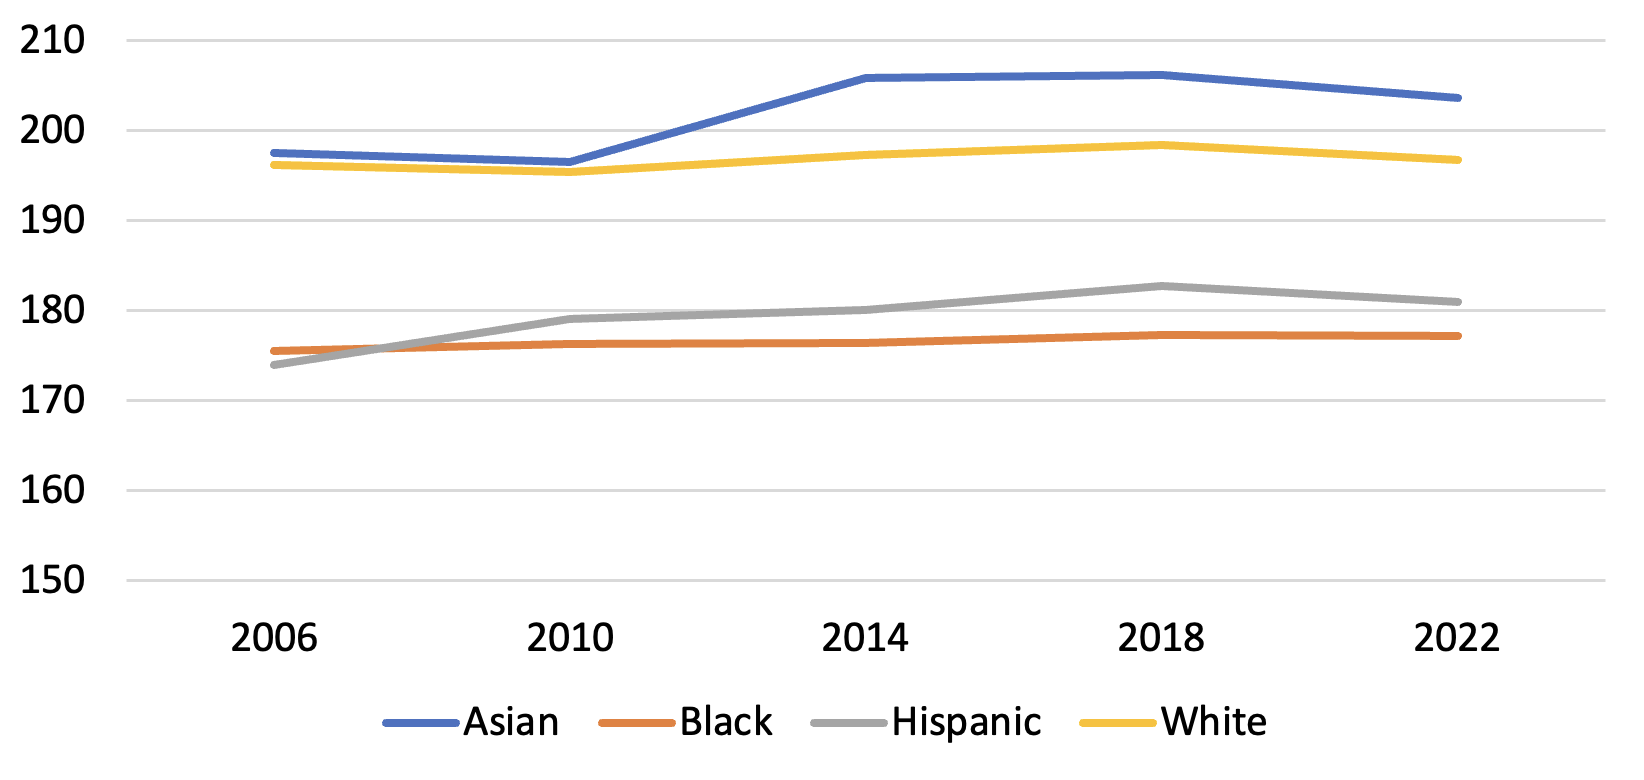
Figure 10. NAEP civics, percentage at Advanced level, eighth grade, by race and ethnicity, 2006–22
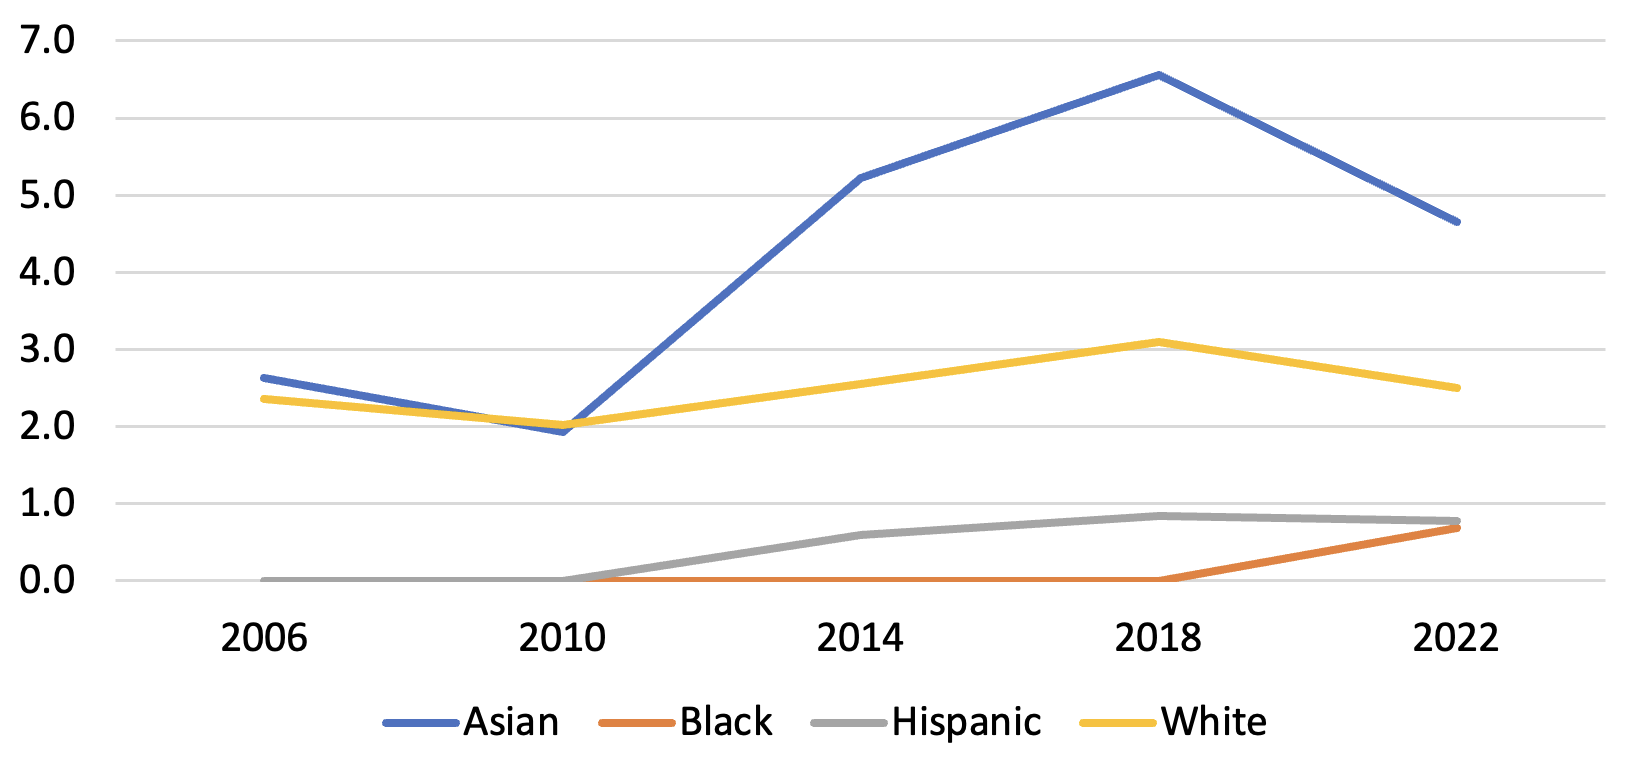
By eligibility for free or reduced-price lunch
Figure 11. NAEP civics, 90th percentile scores, eighth grade, by eligibility for free or reduced-price lunch, 2006–22
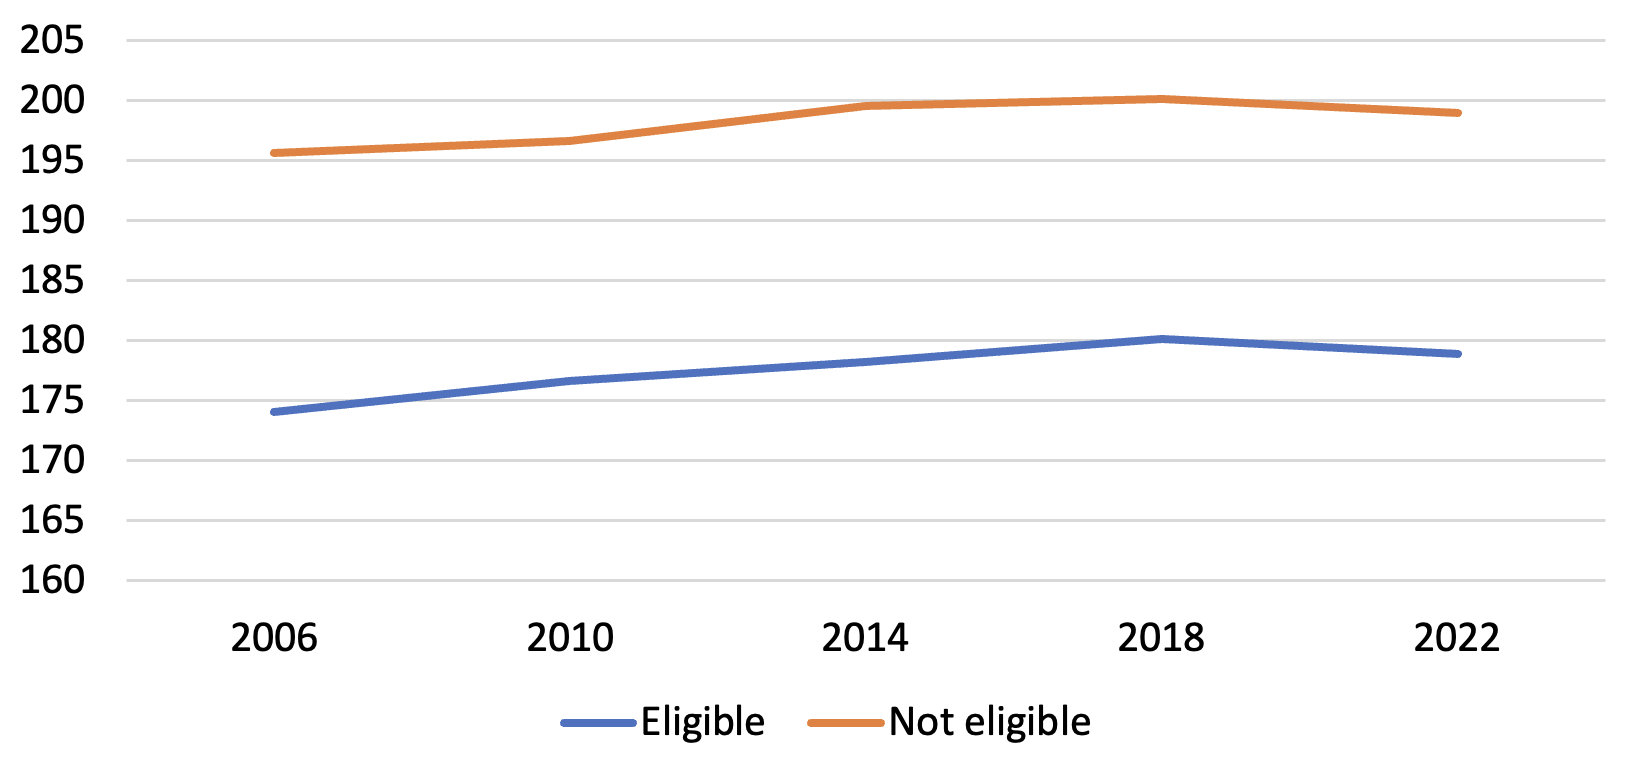
Figure 12. NAEP U.S. history, percentage at Advanced level, eighth grade, by eligibility for free or reduced-price lunch, 2006–22
—
QUOTE OF NOTE
“[N]o students should be denied access to classes they want to take and could benefit from, or prevented from attaining skills they should learn to be successful in the future.”
—Scott Peters, “Inclusion, equality and honors classes in name only,” The 74, May 3, 2023
—
THREE STUDIES TO STUDY
“How to Measure a Teacher: The Influence of Test and Nontest Value-Added on Long-Run Student Outcomes,” by Benjamin Backes, James Cowan, Dan Goldhaber, and Roddy Theobald, CALDER, April 2023
“This paper examines how different measures of teacher quality are related to students’ long-run educational trajectories. We estimate teachers’ test-based and nontest value-added (the latter based on contributions to student absences, suspensions, grade progression, and grades) and assess how these predict various student postsecondary outcomes. We find that both types of value-added have positive effects on student outcomes. Test-based teacher quality measures have more explanatory power for outcomes relevant for students at the top of the achievement distribution, such as attending a more selective college, while nontest measures have more explanatory power for whether students enroll in college at all.”
“High-Ability Influencers?: The Heterogeneous Effects of Gifted Classmates,” by Simone Balestra, Aurélien Sallin, and Stefan C. Wolter, Journal of Human Resources, Volume 58, Number 2, March 2023
“We study the causal impact of intellectually gifted students on their nongifted classmates' school achievement, enrollment in post-compulsory education, and occupational choices. Using student-level administrative and psychological data, we find a positive effect of exposure to gifted students on peers' school achievement in both math and language. This impact is heterogeneous: larger effects are observed among male students and high-achievers, and female students benefit primarily from female gifted students. Effects are driven by gifted students not diagnosed with emotional or behavioral disorders. Exposure to gifted students increases the likelihood of choosing a selective academic track and occupations in STEM fields.”
“Examining the Educational Spillover Effects of Severe Natural Disasters: The Case of Hurricane Maria,” by Umut Özek, Journal of Human Resources, Volume 58, Number 2, March 2023
“This study examines the effects of internal migration driven by severe natural disasters on host communities and the mechanisms behind these effects, using the large influx of migrants into Florida public schools after Hurricane Maria. I find adverse effects of the influx in the first year on existing student test scores, disciplinary problems, and student mobility among high-performing students in middle and high school that also persist in the second year. I also find evidence that compensatory resource allocation within schools is an important factor driving the adverse effects of large, unexpected migrant flows on incumbent students in the short run.”
—
WRITING WORTH READING
“New [Washington State] law starts universal screening for highly capable students next school year” —WA Coalition for Gifted Education, May 4, 2023
“Inclusion, equality and honors classes in name only” —The 74, Scott Peters, May 3, 2023
“Florida OKs AP precalculus course after delay that worried educators” —Orlando Sentinel, Leslie Postal, May 3, 2023
“Fayette County [Kentucky] schools not following law on gifted education, parent’s lawsuit claims” —Lexington Herald Leader, Valarie Honeycutt Spears, May 1, 2023
“7 questions with a superintendent: How to make high achievers more successful” —District Administration, Matt Zalaznick, April 28, 2023
“GPA issue just latest in series of exam school admissions errors parents have noticed this year” —Boston Globe, Christopher Huffaker, April 28, 2023
“Gifted group asks school district to expand services” —The Lens [New Orleans], Marta Jewson, April 27, 2023
“I am the ‘successful’ student—yet I was also suicidal for much of high school” —Boston Globe, Jasmine Wynn, April 27, 2023
“How the Advanced Placement curriculum undermined its original goals” —Washington Post, David Perry, April 27, 2023
“Schools are ditching homework, deadlines in favor of ‘equitable grading’” —Wall Street Journal, Sara Randazzo, April 26, 2023
“New! Advanced public education! Compare with brand 'equity'!” —RealClearInvestigations, Vince Bielski, April 26, 2023
“Washington Magnet Elementary School named top magnet school in the country” —WRAL News, Destinee Patterson, April 26, 2023
“College Board to make more changes in African American Studies course” —K-12 Dive, Naaz Modan, April 25, 2023
