The release of “The Nation’s Report Card” on October 24, 2022, created shock waves though out the country’s education and policy establishments. The dramatic academic achievement losses reported for the National Assessment of Educational Progress (NAEP) achievement testing program, which had been suspended because of Covid, were unprecedented during the fifty-plus years of national achievement testing and monitoring. Indeed, achievement trends have been positive for most of the years that NAEP testing has been in existence, particularly after passage of the No Child Left Behind (NCLB) Act in 2001.
Few would disagree with a “common sense” explanation that, since Covid caused so many school closures, NAEP achievement losses were due to large segments of the K–12 population not being in school. But is this a priori conclusion clearly justified? Most if not all closed school systems offered virtual classroom instruction, and we know that online education has become commonplace and relatively successful in other educational settings, especially community colleges. Moreover, there is substantial evidence that home schooled children can achieve as well if not better than children attending regular schools.
When NAEP scores first declined on a wide scale in 2015—after many years of steady increases—a major study by education economists Jackson et al argued that the drop was caused by a reduction in school expenditures arising from the serious recession of 2008–09, which had some financial impacts lingering until 2010–11[1]. Could school funding also be part of the explanation for the 2022 losses?
Finally, there is an alternative explanation of the 2015 NAEP score decline that has received little attention, which is the termination of the accountability provisions when NCLB was replaced by the Every Student Succeeds Act (ESSA) legislation in 2015. The effects of accountability requirements have received less attention than expenditures with the notable exception of work by Hanushek and Raymond in 2004.[2] If lessened accountability requirements are a major cause of NAEP declines in 2015 and later years, it may be reasonable to interpret the Covid losses to a type of accountability—that which takes place when children are required to be present in a classroom.
This paper examines national and state-level trends in NAEP scores to evaluate whether school expenditures or accountability requirements might be the better explanation for NAEP trends, including the recent Covid-induced losses.
National trends
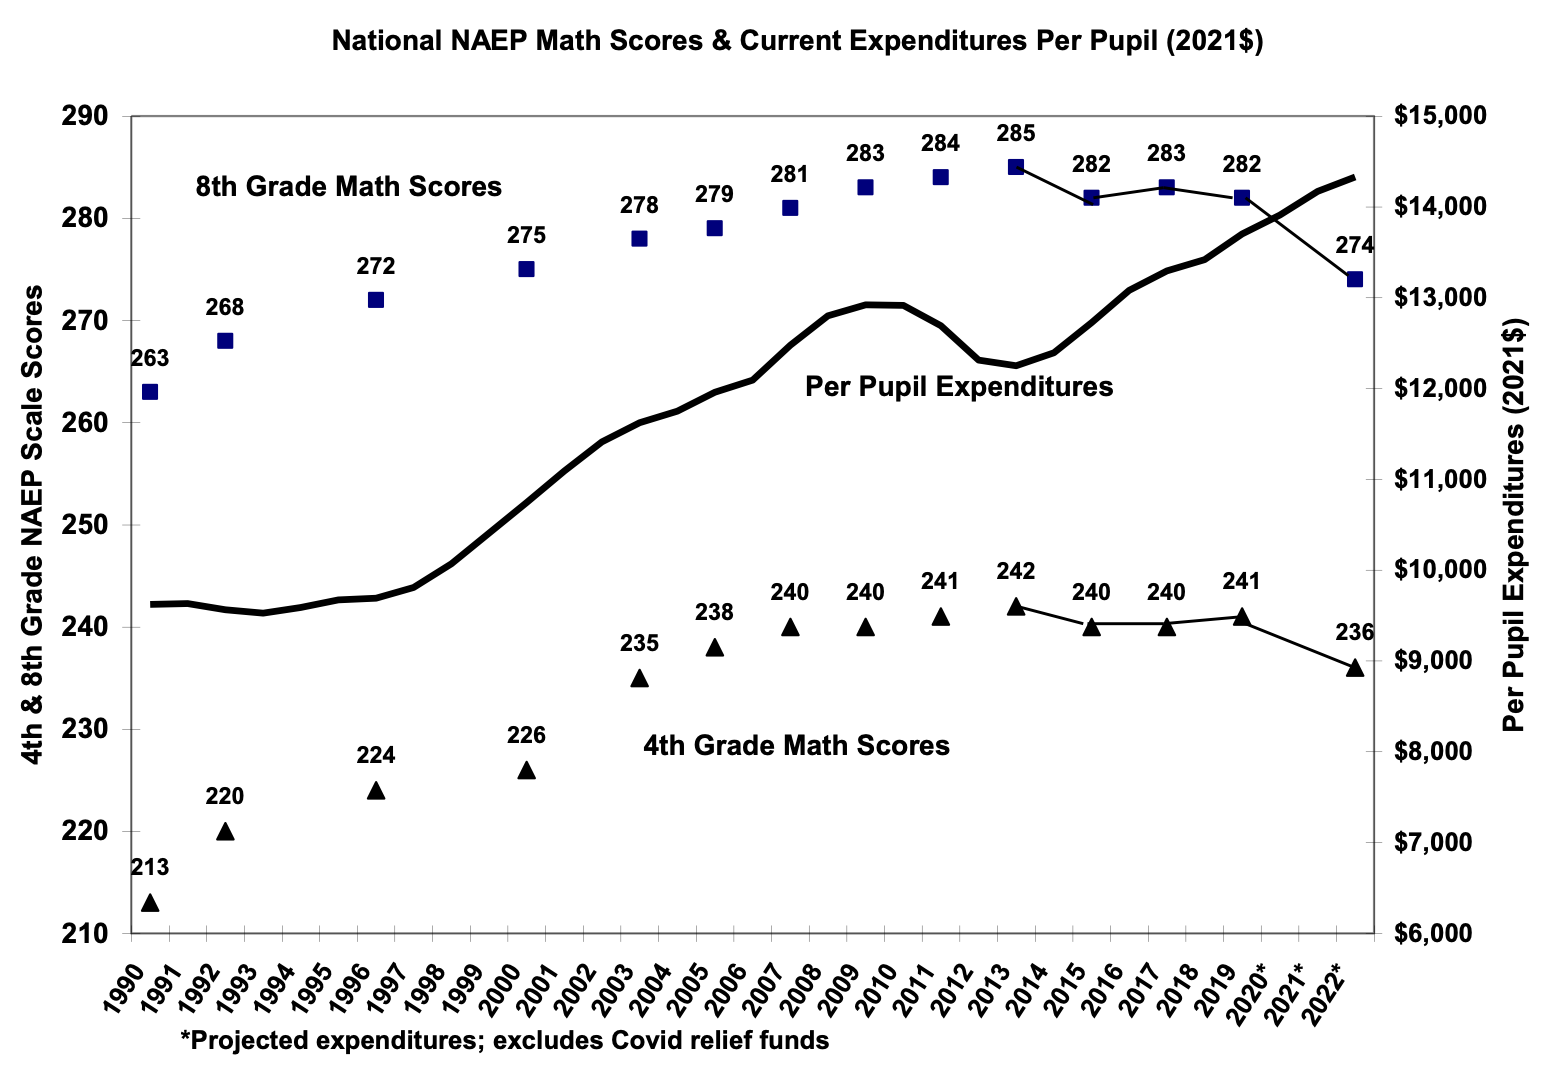
The national trends for fourth and eighth grade math and reading scores are shown in Figures 1 and 2, respectively, juxtaposed with per pupil current expenditures. With regards to math scores, there are two distinct trends, and they are nearly identical at both grade levels. Scores rise steadily and substantially from 1990 to 2013 (by 22 and 29 points, respectively), and then they both drop by several points in 2015 and remain lower until the large drops of 8 and 5 points in 2022.
The expenditure trend shows a distinctly different pattern. Expenditures are flat between 1990 and 1997, and then they rise steadily until about 2010 when the recession causes a decline lasting about three years. Expenditures were back to their pre-recession levels by 2016 and continue their pre-recession trend until 2019 and beyond. If declining expenditures are the cause of the math score decline in 2015, math scores should have started rising again when expenditures started increasing.
Figure 1
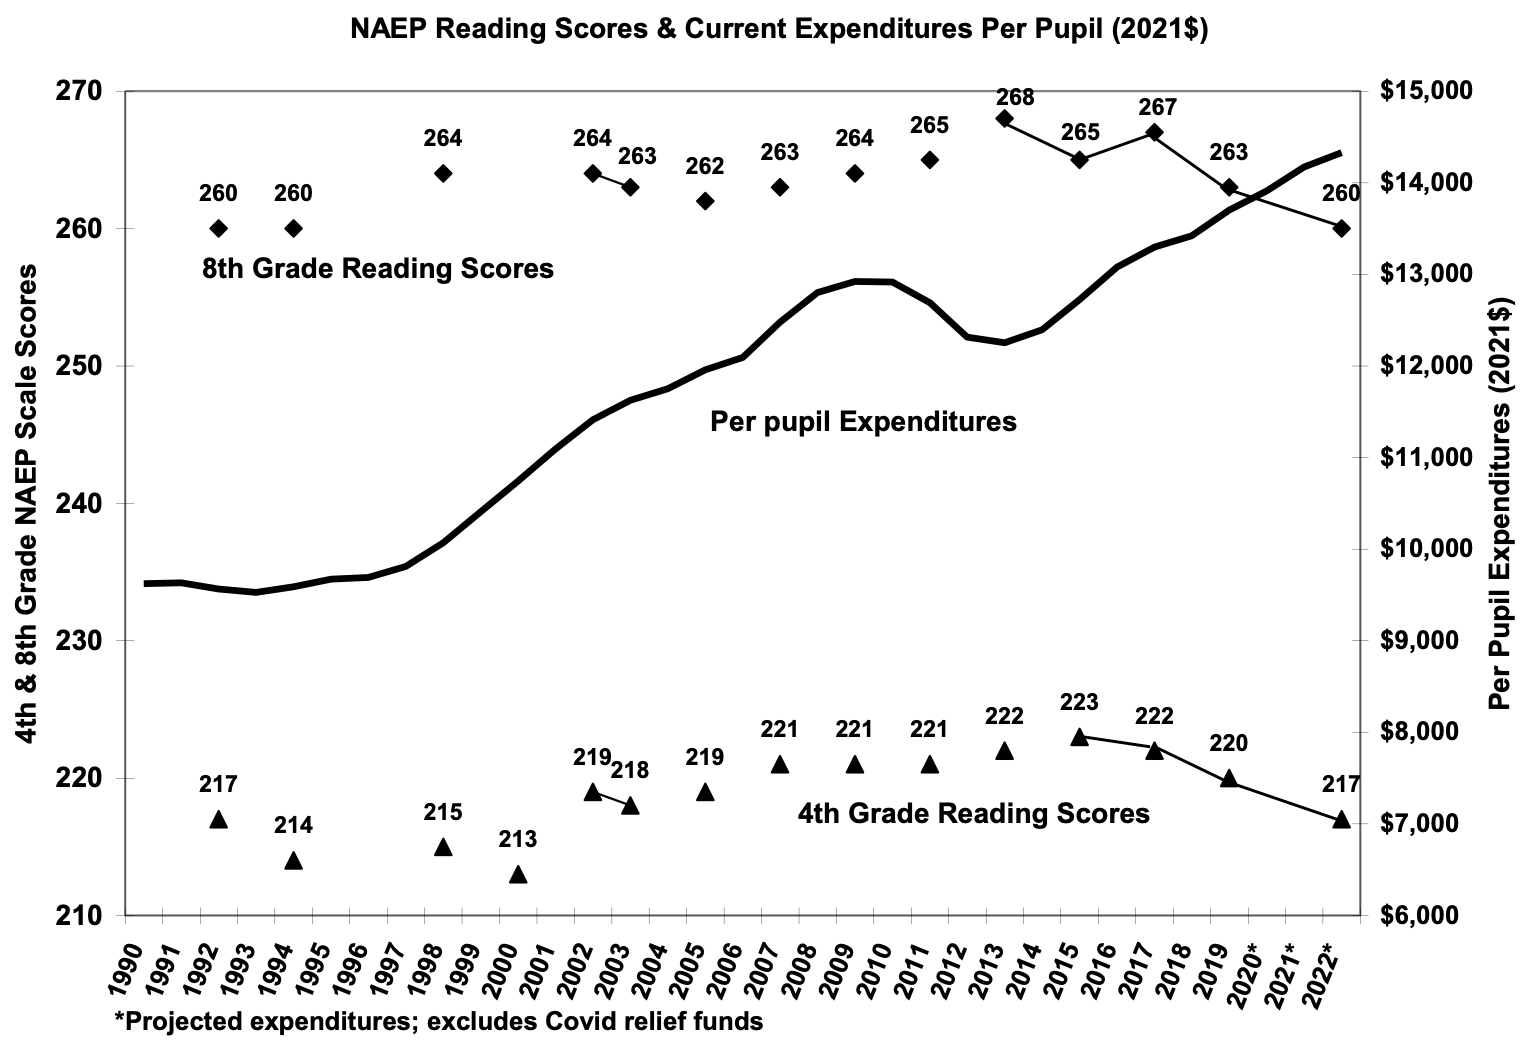
The patterns and trends for reading scores differ somewhat from math scores. Reading scores made more modest gains between 1990 and 2013, but they also started decreasing in 2015 for eighth grade and 2017 for fourth grade. Reading scores continued to fall in 2019, and in fact, the scores following the Covid shutdown appear to be nearly a straight-line continuation of the trends established between 2013 and 2019. Like the math scores, if recession-induced expenditure losses caused these achievement declines, it seems reasonable to expect that the expenditure recovery would reverse those losses.
These consistent patterns of achievement losses, and their failure to match up with expenditure changes, suggests other explanations for declining achievement. The other major event in education policy which matches up with these achievement losses is termination of the No Child Left Behind act in 2015. The most controversial and unpopular provisions of NCLB were its accountability requirements. NCLB required every state that received federal funds to develop education standards for every grade level, administer standardized achievement tests to grades three through eight and one high school grade, and publish results of those tests by race/ethnicity and poverty status (as indicated by the free lunch program) every year. The most controversial requirement of NCLB was its “adequate yearly progress (AYP)” provision, which established a goal of eliminating racial, ethnic, and socioeconomic disparities by the year 2014.
Figure 2
The AYP goals, while admirable, proved very difficult if not impossible to attain. The sanctions were quite severe; a school not meeting specific progress goals—in terms of the percent of students deemed “proficient” within a specified number of years—would be subject to increasing sanctions, including total school restructuring after four or five years.
As the years passed, real progress was made in raising achievement levels, as can be observed in Figures 1 and 2, especially for math. However, it also became clear that the goal of eliminating achievement gaps was not going to be realized by 2014. While Black and Hispanic achievement gains were very substantial, the achievement gaps narrowed less than anticipated because White students also gained at nearly equivalent rates (the same was true for free-lunch versus paid-lunch students).
By 2012, over half of the states had requested and been granted waivers from the AYP requirement. Nationwide, the maximum levels of achievement occurred for NAEP scores in the spring 2013. When it became clear that NCLB was going to be replaced by the Every Student Succeeds Act (ESSA) in 2015, schools dropped their AYP goals and requirements. As a result, the 2015 NAEP results revealed the first declines in math and reading scores in nearly twenty-five and ten years, respectively.
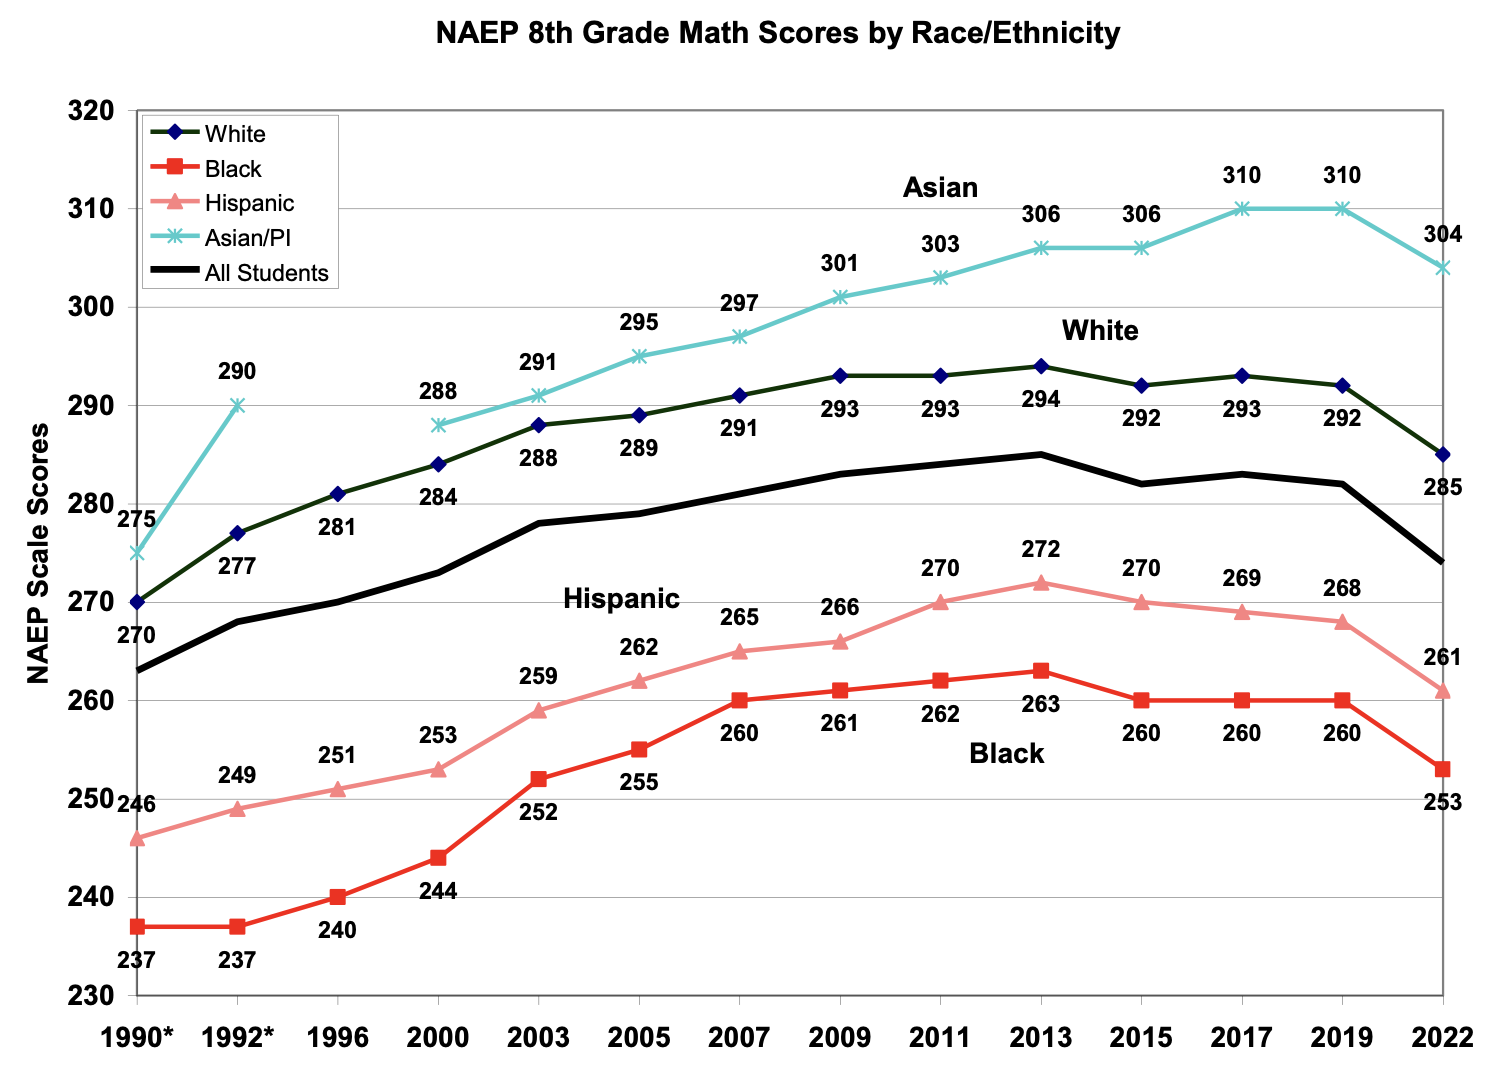
The impact of ending NCLB and AYP goals is seen more clearly in Figure 3, which shows eighth grade math trends by race and ethnicity. Although Black and Hispanic students were improving before NCLB, the adoption of NCLB and AYP requirements in 2000 led to even greater gains for these two disadvantaged groups, and the gaps with White students were actually closing. Between 2000 and 2013, the Black-White gap decreased from 40 to 31 points and the Hispanic-White gap decreased from 31 to 22 points. As impressive as these gains were, they were less than the NCLB objective of eliminating the gaps entirely by 2014.
After the new ESSA program was adopted and AYP requirements were dropped, both White and Hispanic students dropped by 2 points in 2015, while Black students dropped 3 points. After 2015, the Black-White gap remained constant but the Hispanic-White gap—which had been reduced by 11 points between 2000 and 2013—grew from 22 to 24 points between 2013 and 2019. It should be noted that Asian students continued to progress, scoring well ahead of White students throughout this period.
Figure 3
State trends
To this point only national trends have been examined. Since each state determines its own academic standards and designs an assessment protocol to evaluate progress, state-level outcomes should also be examined before deciding whether expenditures or accountability policies offers a better explanation of changes in test scores. In fact, the 2020 paper by Jackson et al. evaluates the recession impact at the state level because of very different degrees of public school dependence on state funding. Like Jackson, we also use NAEP scores in order to have a common metric to investigate the causes of achievement trends. In the state analysis we focus on eighth grade math scores which showed the largest losses following the Covid shutdown.
Jackson et al. classifies states according to their level of dependence on state revenues (as opposed to local property taxes) because the impact of the 2008 recession on spending levels differed according to this metric. For this analysis, we have selected two states from those with the highest levels of state funding, California and Minnesota, and two states from those with the lowest levels of state funding, Illinois and Pennsylvania. In addition, NAEP achievement trends in New York is also added as a special case due to an adequacy lawsuit that required increase state funding for school districts with higher poverty rates in order to overcome the achievement gaps. These five states account for about one-third of the United States K–12 population.
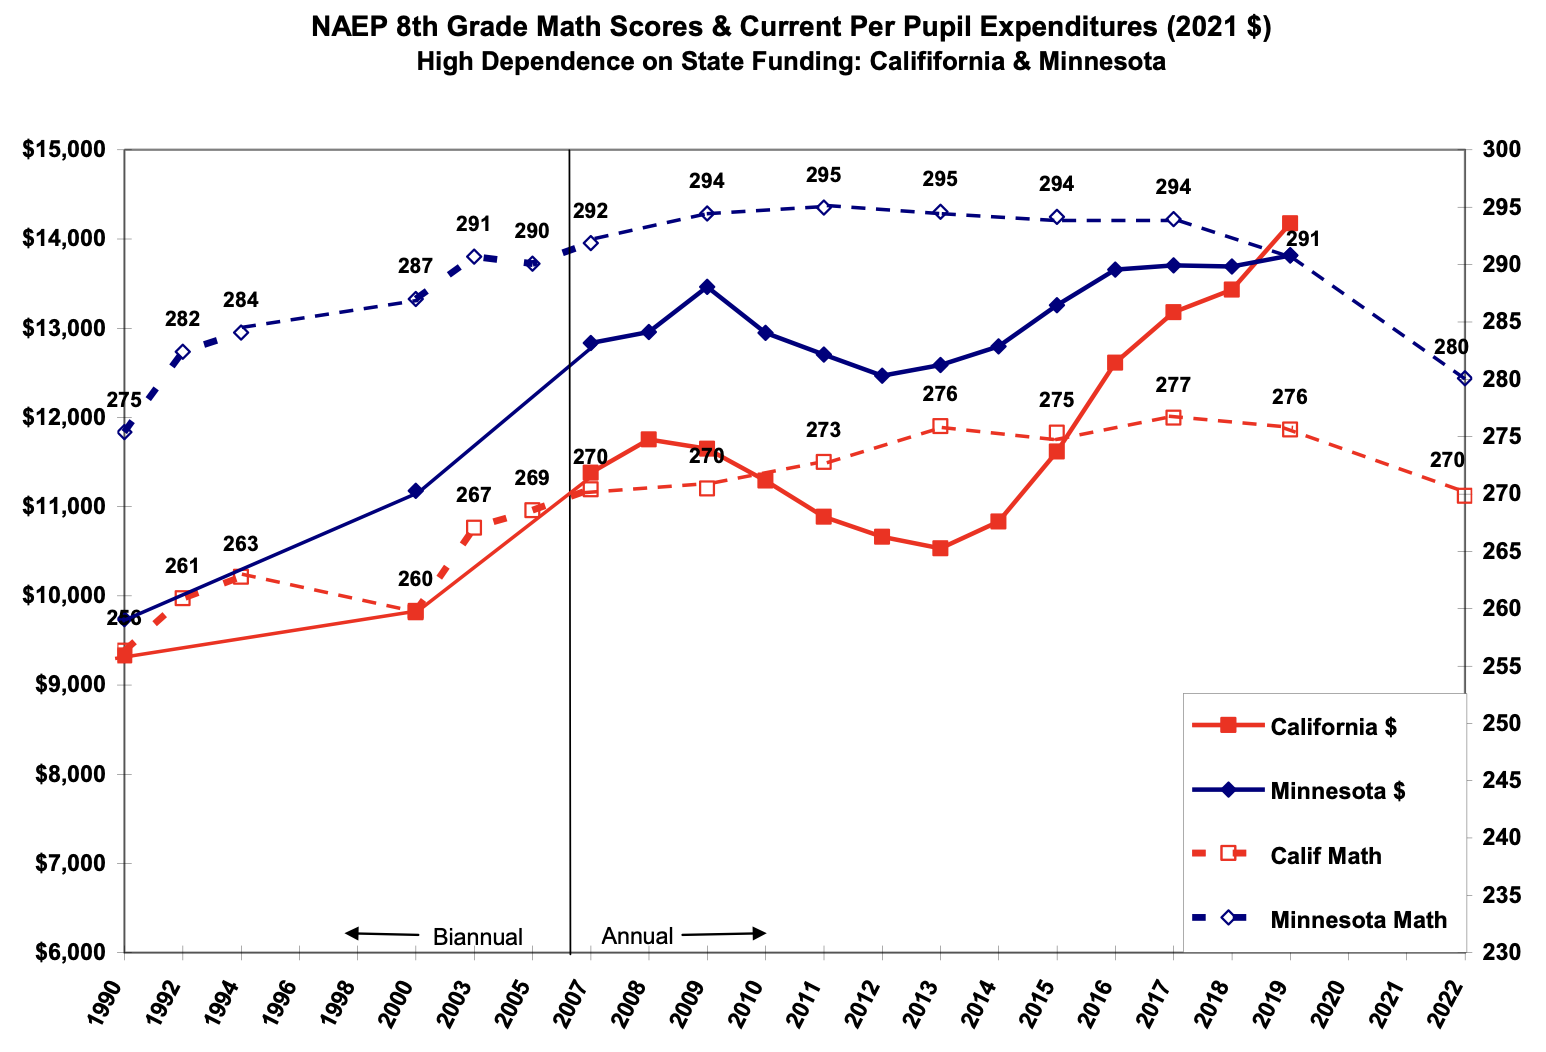
NAEP scores and expenditures for the two states with high dependence on state funding dependence are shown in Figure 4. It is clear that both California and Minnesota experienced very large funding declines between 2007 and 2014, although durations differ: Minnesota declines occurred from 2009 to 2012, while California reductions took place from 2008 to 2013. Both states’ expenditure cuts were largely restored by 2015.
In contrast, neither state experienced significant reductions in eighth grade math scores associated with these large spending reductions. Neither state experienced declines in eighth grade math scores between 2009 and 2017, and in fact California increased from 270 to 275 between 2009 and 2017. In 2019, Minnesota dropped 3 points and California dropped one point, but by this time, expenditures had returned to their pre-recession levels. For these two states, there is little evidence for recession-induced eighth grade math achievement losses. Moreover, there is no evidence that California experienced a loss associated with the end of NCLB.
Figure 4
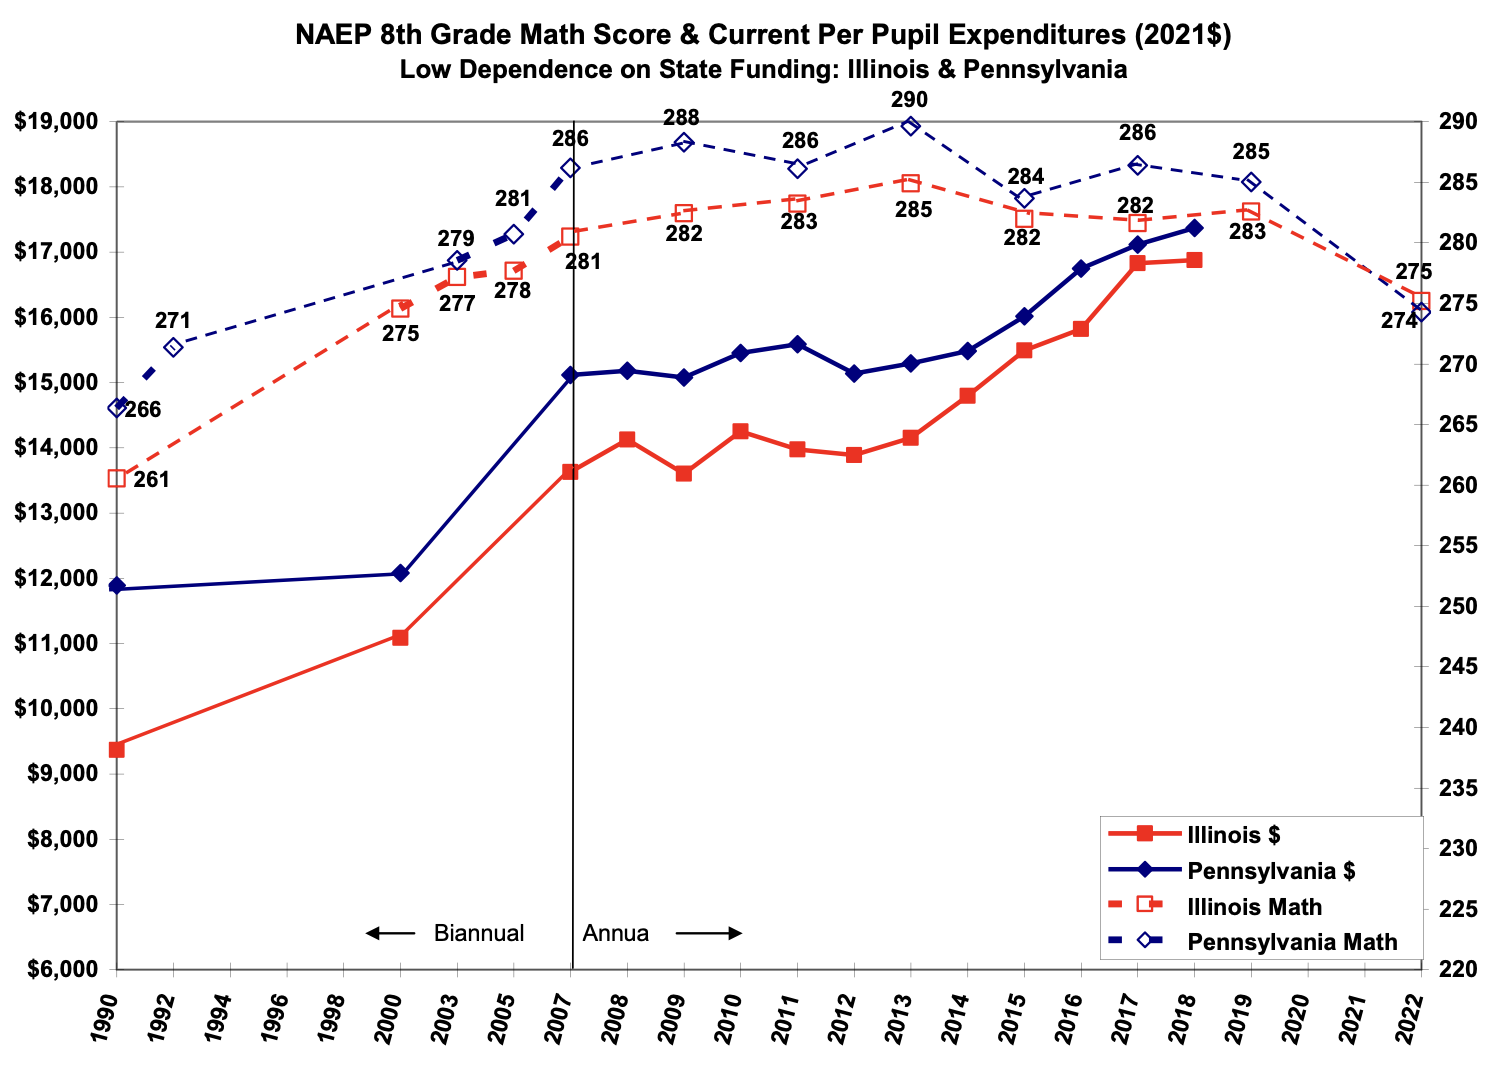
Trends for the two states with lowest dependence on state funding are shown in Figure 5. Neither Illinois nor Pennsylvania experienced significant school spending reductions between 2007 and 2013, although their inflation-adjusted expenditures do remain fairly constant during this time before starting to rise again in 2013. Pennsylvania test scores remain generally high through out the period, reaching a maximum of 290 in 2013, but dropping to 284 in 2015 before rising to 286 in 2017. Likewise, Illinois scores reach a peak of 285 in 2013 before falling to 282 in 2015 and to 280 in 2019. During this same period, Illinois per-pupil expenditures rose from about $14,000 to $17,000. For these two states, spending is not a likely explanation for the test score declines in 2015; the end of NCLB is a more credible reason.
Figure 5
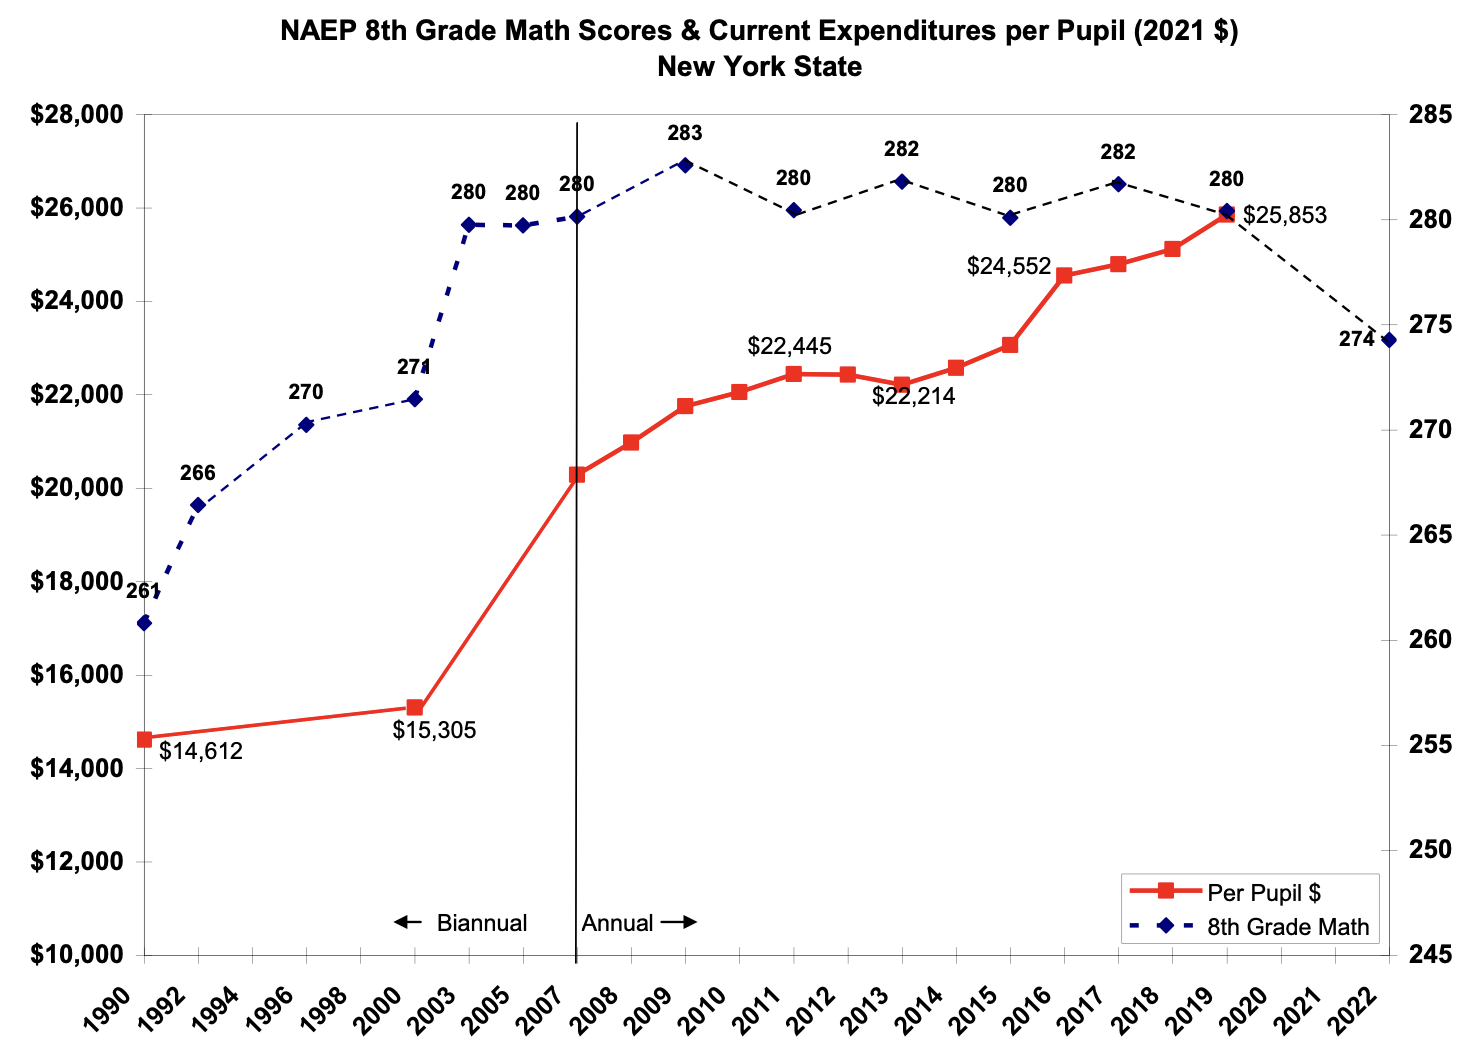
NAEP and spending trends are shown for New York state in Figure 6. Not only is New York the fourth largest state in K–12 public school enrollment, but it has experienced two major “adequacy” litigations, both of which resulted in state court decisions favoring additional funding for its K–12 public schools, primarily on the grounds that disadvantaged minority students were not receiving an “adequate” education.[3]
Similar to the national pattern, achievement grows rapidly during the 1990s despite a very small growth in spending. After NCLB was adopted in 2001, math achievement grew rapidly to 280 in 2003, where it remained for the next several years. In subsequent years, math scores fluctuated between 282 and 280 until 2019, despite very substantial spending increases from $20,000 in 2007 to nearly $26,000 in 2019. At least some of those increases were due to court orders from its two adequacy cases. Recession-induced spending cuts were very small, on the order of $200 per capita.
Figure 6
What about achievement trends for disadvantaged minority groups compared to non-disadvantaged groups? Figure 7 shows eighth grade math scores by race/ethnicity for California, and Figure 8 does the same for New York. In California, White and Asian students show no adverse impact from reduced expenditures or the end of NCLB. White eighth grade math scores increased steadily throughout the entire period between 2000 and 2019, rising from 277 to 294 during this period—a 16-point improvement. Asians show even greater gains.
Hispanic students, comprising more than half of all California students, also show significant gains between 2000 and 2013, but starting in 2015 scores were flat until 2019. Scores for Black students (who comprise only about 5 percent of the K–12 school population) fell quite sharply by 8 points between 2015 and 2019—and then another 4 points by 2022. It seems very unlikely that this drop is due to school spending, which had returned to pre-recession highs by 2015.
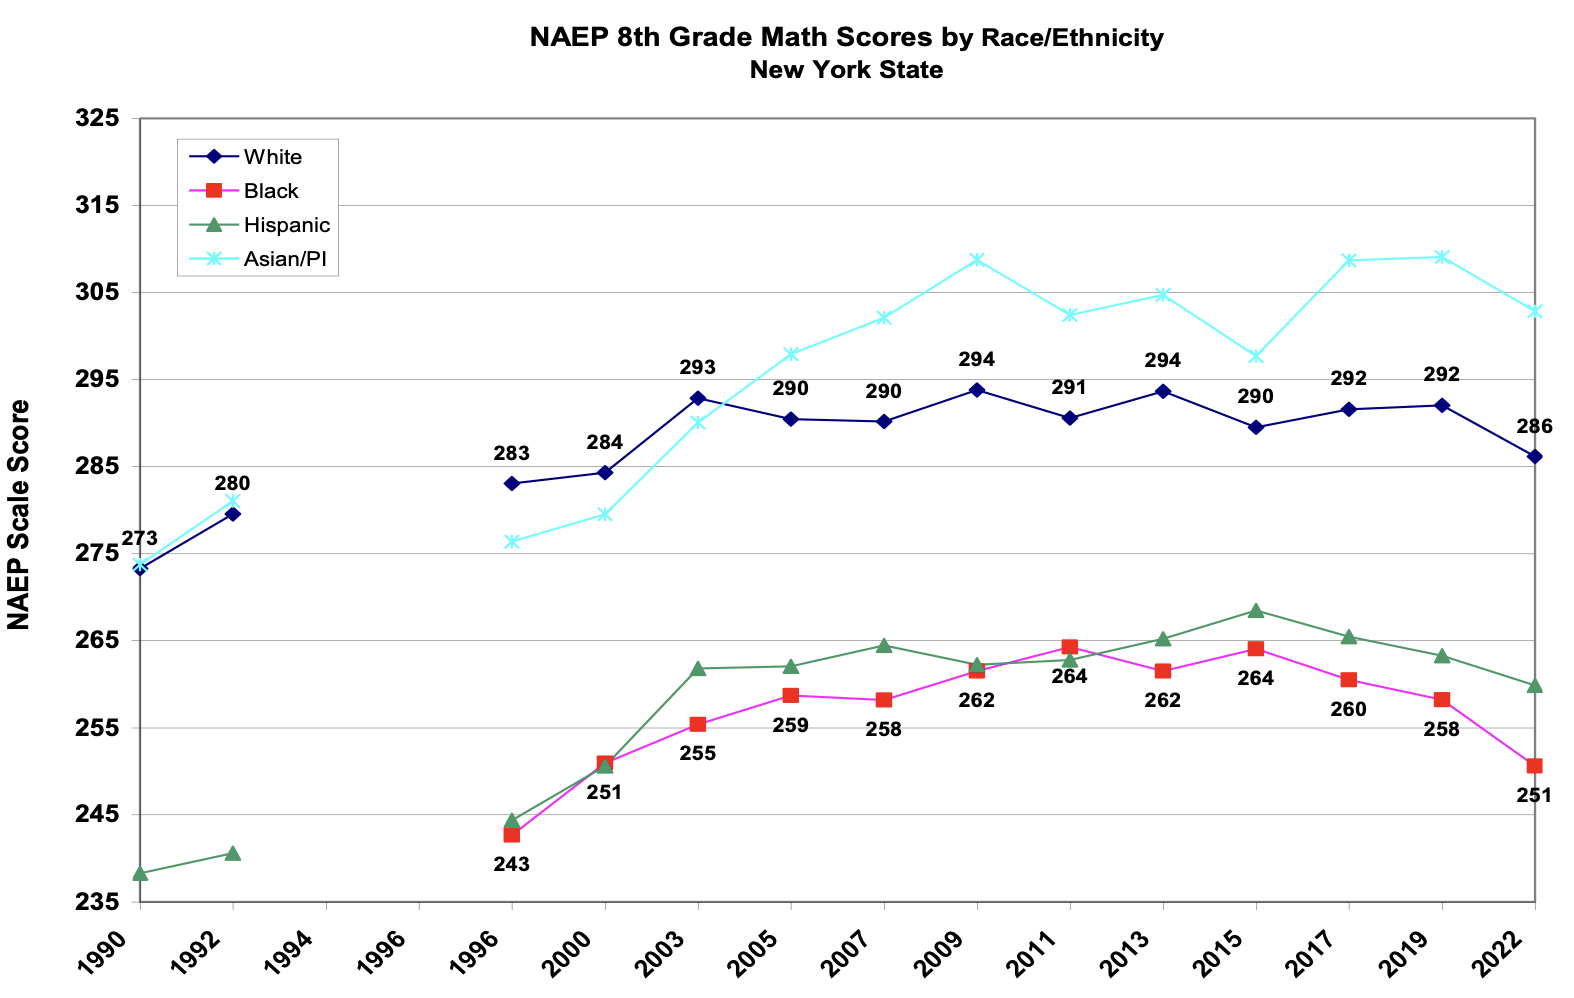
The lack of relationship between spending and achievement is also seen in the race/ethnicity breakout for New York in Figure 8. Despite court orders from the adequacy cases leading to substantially higher expenditures, both Black and Hispanic achievement dropped sharply between 2015 and 2019. Since expenditures grew substantially during this time, the end of NCLB accountability provisions seems a more likely explanation for the declines in eighth grade math scores for New York Black and Hispanic students.
Figure 7
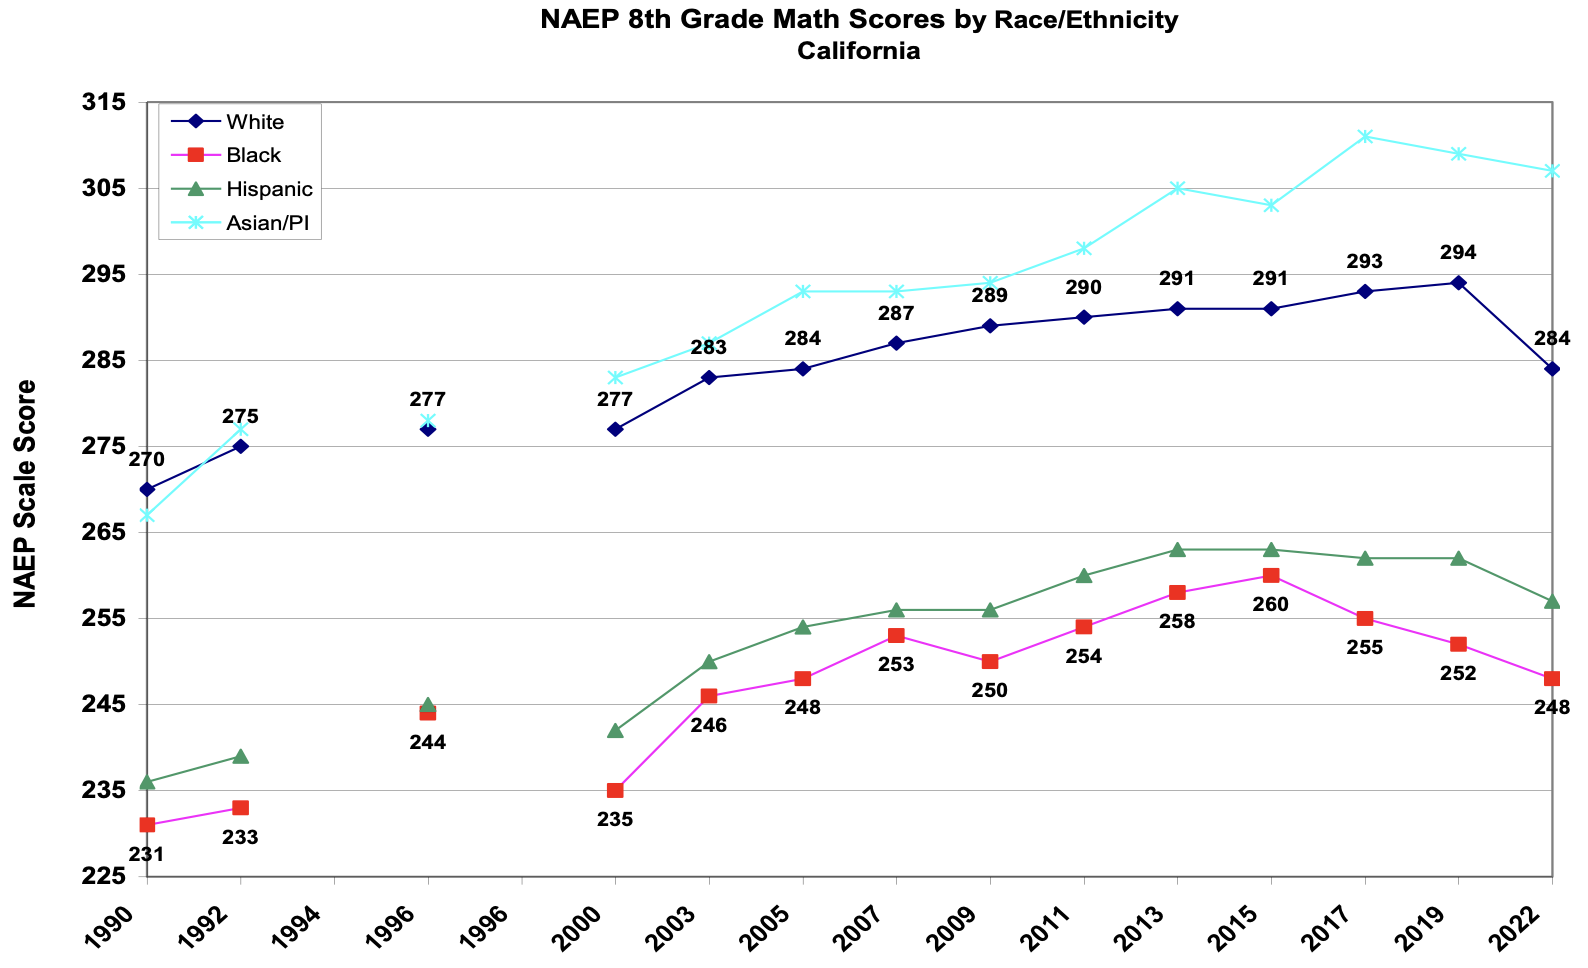
Figure 8
Discussion
At the outset, I understand that the school expenditure and NAEP testing data presented here do not constitute a definitive study of the causes of achievement changes, at least not on the order of studies like those carried out by Jackson et al. The limitation of that study, however, was that it covered only the very beginning of achievement test declines that occurred a few years after the recession. As such, it would be a stretch to argue that expenditures—which have reached all time highs in recent years—are responsible for the dramatic achievement losses that have taken place following the Covid shutdown. That loss, plus my experience studying the relationship between spending and achievement in state adequacy cases, prompted me to revisit the issue by reviewing the national and state data used in Figures 1 to 8.
The Covid losses are clearly related to the fact that many students—perhaps most in some states—were not in school classrooms for one to one and a half years. They were offered online instruction, and theoretically, students (and parents) who tracked carefully with virtual classes and assignments could make the same progress as students in regular classrooms. But in-person classrooms run by teachers are more likely to hold students “accountable” for lessons, practice, and homework. While parents could theoretically do the same, they are not expected to put in the same level of attention as regular teachers in regular classrooms. Thus in-person classrooms are more likely to assure learning than virtual classrooms which reduce accountability.
The fact that almost all of the achievement losses observed in Figures 1 to 8 start in 2015, when No Child Left Behind accountability rules ended, suggests that losses between 2015 and 2019 are most likely due to the end of NCLB and its associated accountability provision. In that sense, then, all of the losses from 2015 to 2022 might be ascribed to losses of accountability, albeit of differing types. This explanation fits the test score trends much better than recession-induced spending cuts which were largely over by 2016.
[1] Jackson, C.K , C. Wigger, and H. Xiong. 2020. “The Costs of Cutting Spending.” Education Next (Fall 2020): 64-71; Jackson, C.K., C. Wigger, and H. Xiong. 2021. "Do School Spending Cuts Matter? Evidence from the Great Recession." American Economic Journal: Economic Policy 13, no. 2 (May): 304-335).
[2] Hanushek, E.A. & M.E. Raymond. 2004. “Does School Accountability Lead to Improved Student Performance?” NBER Working Paper 10591.
[3] Campaign for Fiscal Equity vs. New York State; Maisto et al vs. New York State.


