In previous posts and in comments to the media, I’ve been making the case that the lingering effects of the Great Recession might partially explain the disappointing student achievement trends we’ve seen as of late, both on the Nation’s Report Card and on state assessments.
There are at least two ways the recession might have dampened scores: First, via its devastating impact on fragile families and their young children; and second, through its negative impact on school spending, as state coffers ran dry.
As to the first mechanism, I argued this summer that big shifts in the economy—both booms and busts—appear to be related to the later achievement of babies and toddlers who live through those changes, especially poor children and particularly at the low end of the performance spectrum. Most notably, the roaring 90s led to a huge decrease in “supplemental child poverty rates,” especially for kids of color. And that could explain much of the gains we saw on the National Assessment of Educational Progress (NAEP) in the 2000s, gains that were most dramatic for low-performing kids and kids of color.
So it would make sense that the Great Recession and its awful, long-lasting effects (with unemployment rates above 8 percent from 2009 to 2012) would have an equal and opposite impact on vulnerable children and their families. With parents jobless, stressed out, and struggling to make ends meet, it’s not hard to imagine that the little ones would get less care and attention in all the ways that we know matter to their cognitive and social development.
Another way the recession could negatively impact children is via its effect on school spending. Two years ago, economist Kirabo Jackson laid out the case that the big spending cuts of 2011–2013—the first significant year-over-year declines in K–12 expenditures in American history—were related to depressed achievement, at least in math. Perhaps this need not have been the case, had districts used the tough times to stretch the school dollar in smart ways and, for example, removed ineffective teachers from classrooms when forced to make cuts. But instead, they generally laid off the most junior teachers, froze salaries, raised class sizes, and stopped purchasing new curricular materials. Not a formula for improved achievement. Furthermore, if young students didn’t get what they needed in the critical early years (say, Kindergarten through third grade), they might lag for their entire educational careers.
So those are the hypotheses. Unfortunately, NAEP data are not ideal for testing them. As is oft noted, NAEP is great at illustrating trends, but not explaining them. Still, what we can do is determine whether the timing looks right. In other words, when we follow the various cohorts of children making their way through school over the past decade or so, do we see a pattern that could plausibly be at least partly explained by the double-whammy of the Great Recession on families and on schools?
Let’s dig in—first for reading, which is arguably more likely to be influenced by social and economic conditions, given how much literacy depends on families doing their part at home before children ever enter Kindergarten.
We will look in particular at scores at the tenth percentile—the lowest performing students who, regrettably, also tend to be the lowest-income children. These are the kids we would expect to be particularly vulnerable to economic shocks; they are also the students whose NAEP scores have declined most dramatically in recent years.
The fourth and eighth grade scores are from NAEP; the Kindergarten readiness scores come from a recent study by analysts at the Northwest Evaluation Association, using their Measures of Academic Progress assessment. (Those data are only available from 2010 to 2017.)
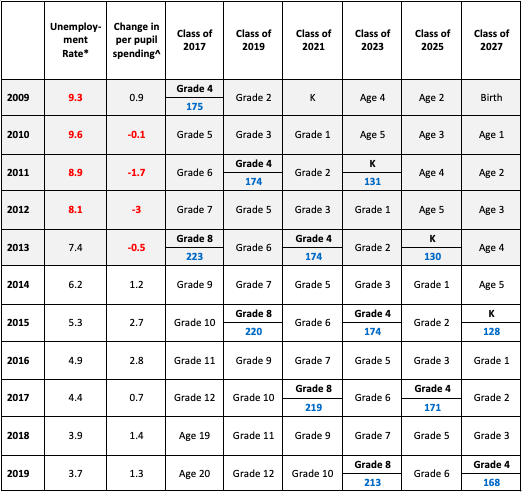
Figure 1: National Reading Scale Scores at the Tenth Percentile since the Great Recession

Note: Kindergarten scores are the tenth percentile on MAP reading. Grade 4 and Grade 8 are tenth percentile on NAEP reading. Spending data are inflation-adjusted numbers based on fall enrollment. * For more about these unemployment figures, see here. ^ For more about these per-pupil-spending figures, see here.
So what do we see?
- Fourth grade reading scores for the tenth percentile were flat from 2009 to 2015—the age cohorts born before the Great Recession. The spending decreases from 2010 to 2013 had no apparent impact on their fourth grade reading achievement.
- The first big drop in fourth grade reading scores came in 2017, with the cohort born in 2007. They were toddlers during the worst of the Great Recession, and their kindergarten reading readiness skills were one point lower than their older peers born before the recession. When they started school, spending declines were bottoming out; by first grade spending was starting to grow again.
- The next big drop in fourth grade reading scores came in 2019, with the cohort born in 2009. They were babies during the worst of the Great Recession, and their kindergarten reading readiness skills were three points lower than their older peers born before the recession. By the time they started school, spending was growing at a healthy clip again.
- On the other hand, declines in eighth grade reading achievement for the lowest-performing students started sooner, in 2015. This cohort of students (the high school class of 2019) scored one point lower than their older peers on the fourth grade reading NAEP (in 2011), but three points lower by the time they reached eighth grade. The intervening years saw the worst spending cuts in American history.
- Another huge drop (six points!) came in 2019, even though this cohort of students had performed just as well as their older peers on the fourth grade reading NAEP. This cohort—the high school class of 2023—was in pre-school at the apex of the Great Recession, and lived through major spending cuts in Kindergarten, first, and second grade. They faced a double whammy—both of being young during the Great Recession, and relatively young during the age of austerity.
Now let’s look at math.
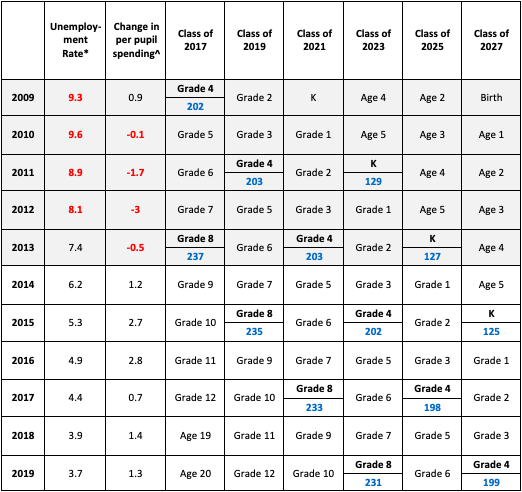
Figure 2: National Math Scale Scores at the Tenth Percentile since the Great Recession

Kindergarten scores are the tenth percentile on MAP reading. Grade 4 and Grade 8 are tenth percentile on NAEP reading. Spending data are inflation-adjusted numbers based on fall enrollment. * For more about these unemployment figures, see here. ^ For more about these per-pupil-spending figures, see here.
What do we see?
- As in reading, fourth grade math scores for the tenth percentile were flat from 2009 to 2015—the age cohorts born before the Great Recession. The spending decreases from 2010 to 2013 had no apparent impact on their fourth grade math achievement.
- The first and only big drop (four points) in fourth grade math scores came in 2017, with the cohort born in 2007. They were toddlers during the worst of the Great Recession, and their kindergarten math readiness skills were two points lower than their older peers born before the recession. When they started school, spending declines were bottoming out; by first grade spending was starting to grow again.
- Thankfully, this decline was partially reversed in 2019, as the cohort born in 2009 improved by a point. They were babies during the worst of the Great Recession, and their kindergarten math readiness skills were two points lower than their older peers born before the recession. By the time they started school, spending was growing at a healthy clip again.
- On the other hand, as in reading, declines started sooner—2015—in eighth grade math achievement for the lowest-performing students. This cohort (the high school class of 2019) scored one point lower than their older peers on the fourth grade math NAEP (in 2011), but two points lower by the time they reached eighth grade. The intervening years saw the worst spending cuts in American history.
- The eighth grade math scores continued to drop in 2017. These students were born well before the Great Recession, but were in second and third grade during the era of big spending cuts. They scored the same as their older peers on the fourth grade math NAEP (in 2013), but two points lower by the time they reached eighth grade.
- Another drop came in 2019. This cohort—the high school class of 2023—were in pre-school at the apex of the Great Recession, and lived through the major spending cuts in Kindergarten, first and second grade. They faced a double whammy—both being young during the Great Recession and relatively young during the spending cuts. They scored one point lower than their older peers on the fourth grade math NAEP (in 2015), but two points lower by the time they reached eighth grade.
So what to make of this? Do the trends fit the Great Recession hypothesis?
Partially. There certainly seems to be suggestive evidence that the Great Recession’s direct impact on children and families may be related to depressed achievement, especially in reading, with the kids who were the youngest during the worst years seeing the greatest declines in both fourth and eighth grades.
Spending cuts, on the other hand, might have impacted eighth grade scores negatively, but not fourth grade scores. That’s a bit of a mystery.
What’s most curious is why the high school class of 2023 did relatively well on the fourth grade reading NAEP but so terribly on the eighth grade exam last spring. Was this because of the spending cuts? If so, why didn’t they do much worse on math, too? Or is there another explanation?
***
My read is that the Great Recession hypothesis checks out in part. I find it especially compelling that fourth grade scores only started to decline with the cohorts born during the high unemployment years of 2009 to 2012, and that eighth grade scores only started to decline with the cohorts that were in grades K to 3 during the big spending declines of 2010 to 2013.
Still, we need much stronger analyses to nail this phenomenon down, such as studies that can look at district-by-district variation in poverty or unemployment rates, tied to changes in student achievement. (We do have those sorts of studies when it comes to the spending cuts.)
None of this is meant to imply that our schools couldn’t and shouldn’t be doing more to raise achievement. In a future analysis, I’ll look into states that continue to beat the odds, demonstrating that demography need not be destiny. But we also shouldn’t ignore the reality that the Great Recession had terribly painful impacts on children, families, and schools—and we’d be naïve to think that those impacts wouldn’t show up in achievement results.


