Yesterday, the Ohio Department of Education released the second round of charter sponsor (a.k.a. authorizer) ratings. The Plain Dealer’s Patrick O’Donnell was quick out of the gate in noticing overall improvements from last year’s ratings (“Cleveland and other charter school sponsors doing a better job, new ratings show”) highlighting the Cleveland district’s own improvement as well as a high-level look at the grades. The Dispatch took a more negative spin, “Sponsors of 10 Ohio charter schools receive ‘poor’ ratings from state,” emphasizing that nearly half of sponsors earned a rating of Poor or Ineffective.
Indeed, 21 of 45 sponsors were deemed ineffective or poor for 2016-17. Yet the Dispatch omits the fact that all but six of these low-rated sponsors (one career technical center, one non-profit, and four educational service centers) were traditional public school districts. The story also took pains to note that those earning effectives did so “despite poor achievement ratings for some or many of their schools.” This is true, but it overlooks the reality that high-poverty schools across the board (charter or district) have struggled and will continue to struggle on achievement metrics until the state makes student growth over time a bigger part of its calculations.
It might be helpful to back up for a moment and take a deeper looking at the sub-ratings and how scores have changed from 2016 to 2017. Bear in mind that sponsors are evaluated along three components: the academic performance of their schools; compliance with state laws and regulations; and adherence to best practices. These equally weighted components generate an overall sponsor rating of Poor, Ineffective, Effective, or Exemplary.
For starters, the number of Ohio sponsors shrunk dramatically in just one year—from sixty-five to forty-five. This is a result of last year’s ratings handing out Poor ratings to many sponsors, mostly traditional public school districts overseeing just one school. Sponsors receiving this rating were required to close, pending an appeal (two districts’ appeals are still being decided).
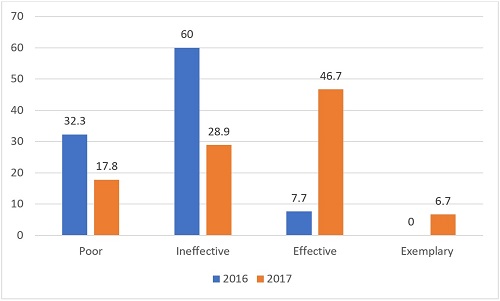
The ratings for the remaining sponsors also improved dramatically (see Graph 1). Over half (53 percent) of today’s sponsors earned an Effective or Exemplary score, compared to just 8 percent last year. The number of sponsors receiving the lowest rating (Poor) also fell by almost half.
Graph 1: Ohio overall sponsor ratings (as a percent of sponsors): 2016 v. 2017

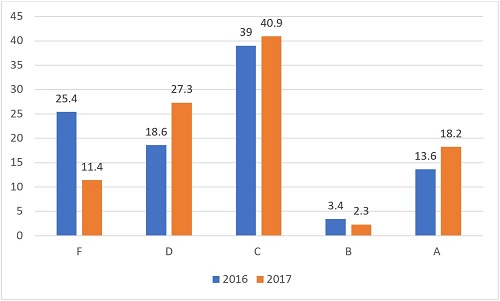
What’s behind this dramatic shift in sponsor ratings in just one year? The below graphs provide context and tell a more nuanced story. The percent of sponsors whose schools’ academic performance earned “F” grades fell by 14 percentage points (See Graph 2). Those earning A grades also increased slightly. This is likely due to the fact that many of last year’s lowest-scoring sponsors have since gone out of business (as, in some cases, did their schools).
At the same time, the numbers as a whole haven’t shifted dramatically. This makes sense given the fact that the academic portion of the sponsor evaluation system relies heavily on achievement metrics (rather than growth), which are highly correlated with student demographics. Statewide performance scores didn’t shift much this year, and neither did the demographics at the charter schools for whom sponsors are graded—so it’s not surprising that these scores didn’t jump all over the board. Also bear in mind that sponsors are tasked primarily with oversight; they don’t operate schools or make day-to-day decisions on their behalf. Yes, they are responsible for quality, but this shows up primarily in decisions around who to open to begin with, and how/whether to intervene or close poor performers. These are longer-term decisions that won’t have a huge impact on year-to-year academic scores.
Graph 2: Percent of Ohio sponsors earning A-F ratings on academics: 2016 v. 2017

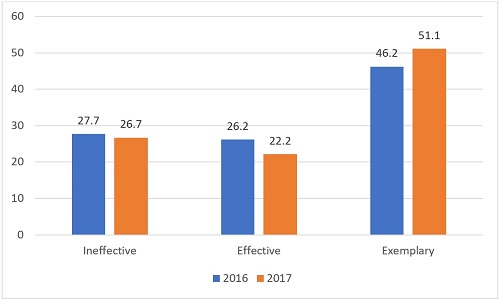
Scores on the compliance section of the review also improved modestly, with slightly more sponsors earning an exemplary on this section and slightly fewer deemed ineffective (Graph 3).
Graph 3: Ohio sponsor compliance scores (as a %): 2016 v. 2017

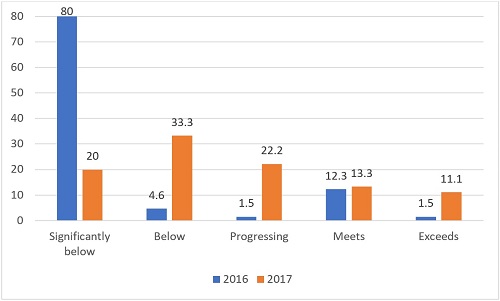
The huge jump occurs in the “quality practices” section of the review (Graph 4). Last year, four of five sponsors were significantly below standards on how well they adhered to best practices of quality oversight; this year, just one in five earned the bottom-most rating. Many more sponsors are meeting standards or exceeding them.
Graph 4: Ohio sponsor quality scores (as a %): 2016 v. 2017

The dramatic changes from last year to this year suggest that a few things are happening.
- Across the board, the sponsorship sector is improving—in terms of overall scores, quality practices, and the exit of twenty sponsors (almost all of which were traditional school districts).
- Recent shifts point to more districts no longer wanting to sponsor charters. Ohio has always had a relatively large number of sponsors, yet many are/were school districts that got into the business in order to oversee one school (often a dropout recovery school). It would make sense that these groups might score poorly on compliance and quality practices—the primary role of authorizers—because as districts they are not designed nor are they typically staffed in order to support this work. (Cleveland Metropolitan School District is an exception, along with perhaps a few others.)
- There is more than meets the eye on academic scores. Many otherwise high-rated sponsors had schools that earned relatively low academic performance scores. This is especially true for sponsors with general education charters; dropout recovery charters have an easier time “meeting standards” on an alternative accountability system, and thus delivering the equivalent of a “C” back to their sponsor. This does not suggest, as some would imply, that those general education charter schools necessarily have a “poor record in educating students.” It instead suggests that any high-poverty school—district or charter—earns and will continue to earn lower performance ratings than low-poverty schools until the state changes its calculation for its overall grades.
Governor Kasich, the legislature, and the sponsor community itself deserve credit for improvements in the last two years. Still, there is work to be done to improve the way sponsors are held accountable for the performance of their schools—placing more emphasis on growth measures (as the legislature attempted to do in the state budget before Governor Kasich vetoed it)—as well as reducing the endless paperwork that sponsors must collect and report to demonstrate their own compliance with laws and regulations (we suggest a randomized audit-like process). And lest we forget, while strong oversight is necessary, it’s also insufficient to ensure that more excellent, innovative schools can expand to meet the needs of the many Ohio students and families who need better options.

