Earlier this year, the California Charter Schools Association (CCSA) published its annual report on charter quality. Their analysis makes an interesting observation: The school-quality distribution across California charters forms a “u-shaped curve.” In contrast, however, when I look at Ohio charters, a different quality distribution emerges. Instead of u-shaped curve, Ohio has a rectangular-looking distribution. So while California charters are more likely to be very high or low quality, Ohio charters seem to be more evenly distributed across the quality spectrum. The shape of the quality “curves” suggests different policy strategies might be needed to lift overall sector quality in Ohio compared to California.
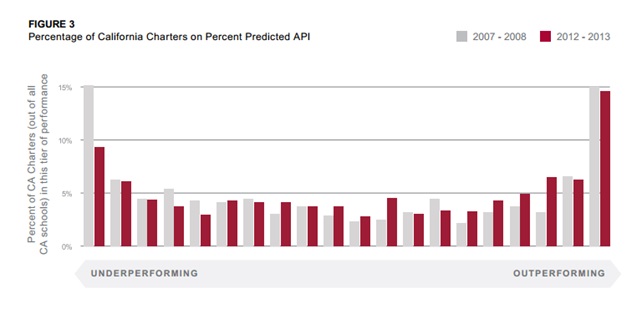
Let us first look at the school-quality data. Chart 1 displays the distribution of charter quality in California, as reported by CCSA. Its analysis uses school-level test and demographic data, along with statistical methods, to calculate a school-quality measure (“predicted API”). The analysis is somewhat akin to the “value-added” analysis used in Ohio, though also cruder since it employs school not student-level data.[1] The analysis divides the quality spectrum into twenty equal intervals and reports the percentage of charters falling into each interval.
When CCSA mapped the quality of California charters, it found a disproportionate number of schools at tails of the distribution. For example, 15 percent of charters fell within the top-five percent of all public schools statewide along its quality measure. At the other end, 9 percent of charters were rated in the bottom-five percent of all schools. (If charter quality were evenly distributed across the quality spectrum, 5 percent of charters would be in each interval.) The upshot: California has a somewhat disproportionate number of either very high or low quality charters, as chart 1 shows.
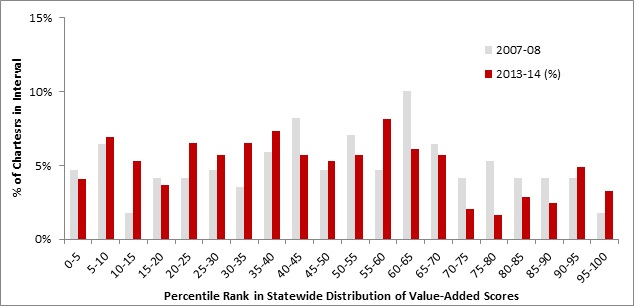
Curiously, when Ohio’s value-added-index scores are used to gauge school quality, one does not observe a “u-shaped” curve. Consider chart 2, which displays the distribution of Ohio charters in 2007-08 and 2013-14, as measured by value-added. Like chart 1, I divide the quality spectrum into twenty equal intervals (i.e., five percentiles), and report the percentage of charters that fall within each interval. Notice that in 2013-14, just 3 percent of charters fell in the top quality category (95th percentile or above in value-added), while 4 percent were ranked in the bottom category (5th percentile or lower). Compare that to California, where 15 and 9 percent were in the top and bottom ranks respectively. All told, charter quality in Ohio looks more evenly distributed across the quality spectrum, though somewhat skewed toward the lower-quality end.
Chart 1: The Charter-Quality Spectrum in California

Chart 2: The Charter-Quality Spectrum in Ohio

To be sure, the difference in the shape of the distribution could be the result of the different statistical approaches taken in California compared to Ohio. But if we take the results at face value, the policy implication for overall sector improvement seems to be different for Ohio compared to California. In the Golden State, the policy prescription is fairly evident: Close the obviously low-performing school and accelerate the growth of its excellent schools, a strategy promoted by the National Association for Charter School Authorizer’s (NACSA).
However, Ohio has a somewhat different—and arguably more difficult—challenge than California. While there are definitely charters scraping the bottom of the statewide quality distribution, a good many Buckeye charters are stuck somewhere in the (lower) middle. How do policymakers, including authorizers, treat a charter in, say, the 35th percentile in statewide quality? Close it? Force it to restructure? Give the school more money and supports? None of these actions seem quite right.
Meanwhile, Ohio has too few high-quality charters that it can help replicate or expand. Granted, a few exemplary charter schools exist in Ohio, as chart 2 shows. But given the time and cost of school growth, it could take decades—at the present pace—to create the number of high-quality seats that disadvantaged communities desperately need.
While the closure and replication strategy remains a viable charter strategy in Ohio, it may be less effective here than in California. Yes, Ohio policymakers have to shutter the persistently low-performers, while accelerating the growth of high-quality ones. But Ohio also has a large group of mediocre schools that bog down the overall quality of charters. What can be done to lift charter schools of below-average quality—treading water but not outright drowning? (The same question, by the way, could be asked about mediocre district schools too.) I don’t think a consensus view has emerged regarding the best strategy, though I have a couple ideas in mind—stay tuned for a follow-up post. In the meantime, what do you think?
[1] California does not have a measure of student growth over time (e.g., value-added or student-growth percentiles) necessitating CCSA’s use an analytical model based on school-level data.

