Two weeks ago, the U.S. Department of Education released the results of the National Assessment of Educational Progress (NAEP). Although, as Professor Marty West put it wryly on the Fordham Podcast, at this point it perhaps should be renamed the National Assessment of Educational Stagnation and/or Decline.
The grim story is mostly familiar at this point to education wonks: Students in thirty-one states performed worse in eighth grade reading in 2019 than in 2017. The first round of wonk hot-takes is in, and several folks here on Fordham’s Flypaper blog have tried to shine a light on the handful of bright spots in the data (e.g., Mississippi is doing well!).
For my part, I’m less of a glass-one-fiftieth-full kind of guy. I’m more inclined to try to find the worst news buried amid the bad and ring an alarm bell about it.
At the topline, we have seen a story of decline ever since 2013. My fear is that this is not a coincidence. From 2013 onward, the Common Core took firm root in most states and we saw a sea change in school discipline and an apparent explosion of tablets and laptops in the classroom. I’ve grown increasingly concerned that the education reform movement has hurt the students it is trying to help, especially students of color.
Of course, NAEP can’t confirm this hypothesis. It can tell us what is happening but not why.
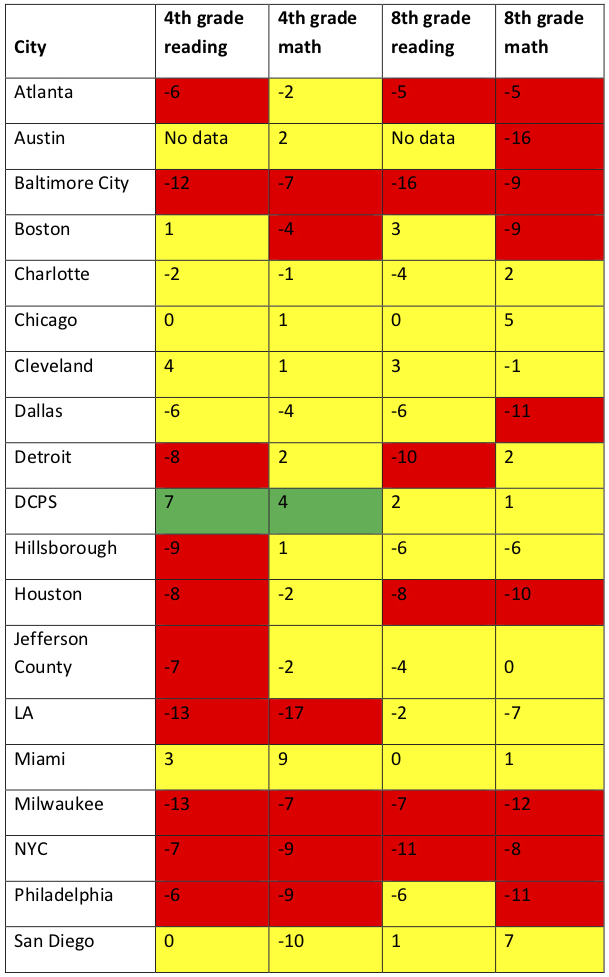
But I wanted to know more about what was happening, focusing on African American achievement in districts and states from 2013–2019, and what I found, as displayed in table 1, seems well worth ringing an alarm about.
Table 1. Change in districts’ NAEP average scale scores from 2013 to 2019 for African American students attending traditional public schools, by grade and subjectScores highlighted in red and green are statistically significant; scores in yellow are not.

The only bright spot here is fourth graders in District of Columbia Public Schools—a brightness tempered by the fact that eighth grade African American students (who spent their entire academic careers under policy and leaders roundly celebrated by the education reform movement) have seen no statistically significant gains.
New York City, Baltimore, Milwaukee, and Philadelphia may aptly be described as train wrecks. Given that ten points is approximately the equivalent of a year of academic growth, eighth graders in these districts do math about as well as those districts’ seventh graders did six years ago. And whatever is happening in Los Angeles elementary schools is clearly awful.
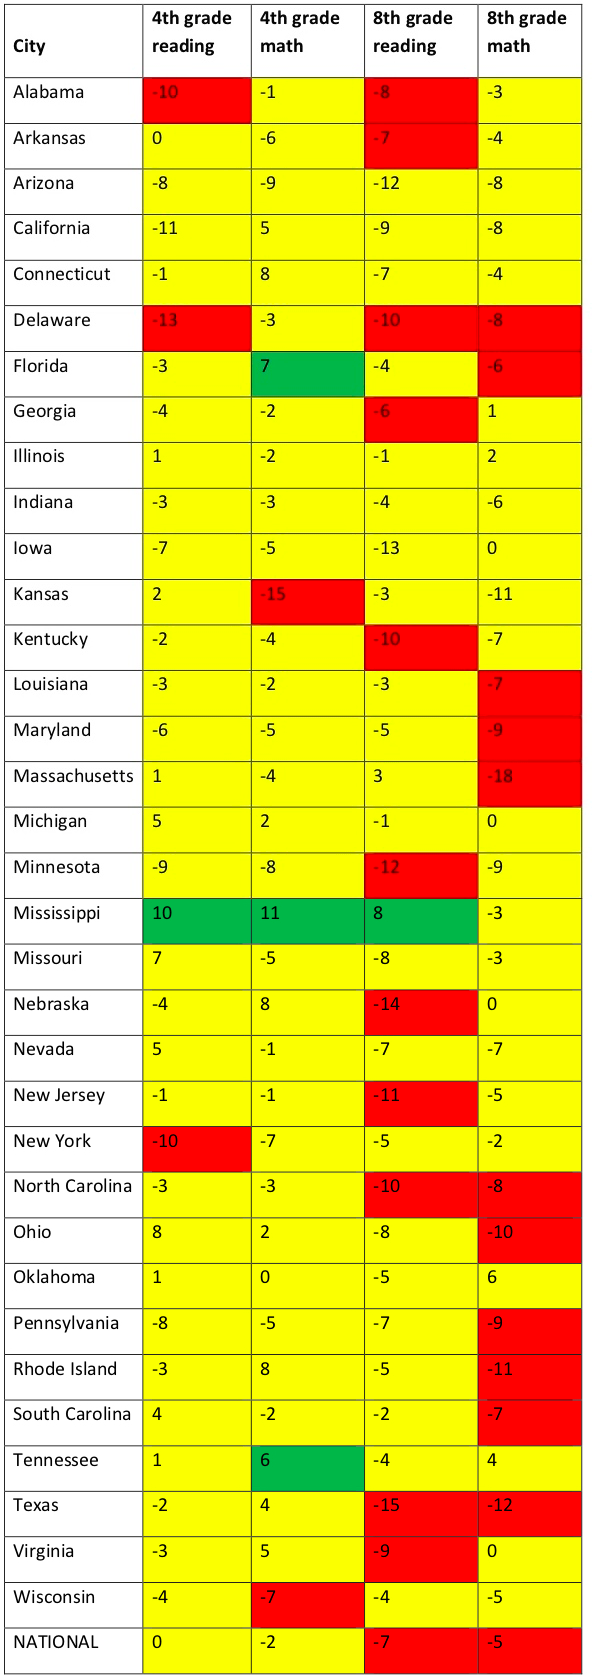
At the state level, the larger sample sizes allowed me to look into African American achievement by gender. I found that, at the national level and in many states, African American males saw greater losses than African American females. Given this alarming pattern—and that, as Fordham’s Erika Sanzi has lamented, boys are often left out of public policy conversations—I decided to display the data in table 2 for African American males from 2013 to 2019.
Table 2. Change in states’ NAEP average scale scores from 2013 to 2019 for African American students attending traditional public schools, by grade and subjectScores highlighted in red and green are statistically significant; scores in yellow are not.

Very bad.
Why is this happening? Fordham’s Michael Petrilli has tried to make the case that this is partly a legacy of the Great Recession, arguing that the dip in achievement might reflect economic stresses acting on kids who were infants and toddlers from 2008 to 2012, and that the impacts of spending cuts might have a time-lagged effect (i.e., eighth grade achievement might be more adversely effected by cuts when students were first-graders than seventh-graders).
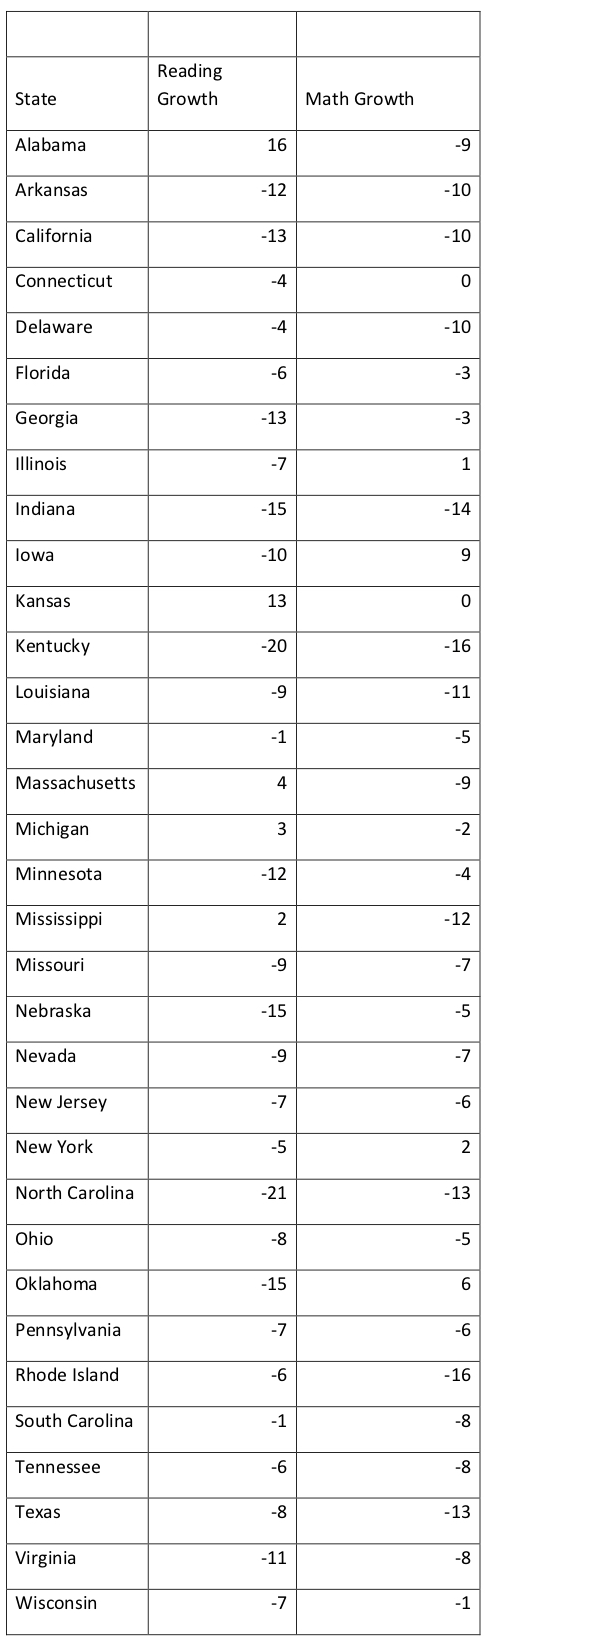
It is all, of course, a conjecture game, but I’m not persuaded. For my part, if budget cuts played a major role in the decline, I would have expected kids who went from fourth to eighth grade during the heart of the Great Recession’s steep school budget cuts (2009 to 2013) to have learned less during those years than kids who went from fourth to eighth grade during the more recent period of an expanding economy and budget increases (2013 to 2019).
But the numbers in table 3 show the opposite.
Table 3. Change in states’ growth, as determined by NAEP average scale scores, among African American males in the period from 2009 to 2013 versus the period from 2015 to 1019.

For black males, there just appears to be less learning taking place in school between fourth and eighth grade now than there was not that long ago.
As academics and wonks are quick to admonish, NAEP doesn’t have much power to confirm hypotheses. But it does have some power to falsify—or fail to falsify—them.
Folks who claimed that the Common Core, discipline reform, and more tablets and laptops would lead to significant gains for African American students have, at this point, seen their hypotheses fairly well falsified.
Whereas my hypothesis that these reforms have done harm remains unfalsified.
My hypothesis is, to reiterate, not confirmed either. We saw notable losses in a couple non–Common Core states (Texas and Virginia), and so many school districts have implemented discipline reform that it’s impossible to gesture at a pattern.
Whatever the cause might be, it would be heartening to see further inquiry and introspection from education reformers into what went wrong before jumping into the next fad. The ghastly data on African American achievement should have raised major alarm bells. But in a movement ostensibly dedicated to racial equity, it seems to have gone mostly unnoticed.

