At last month’s Supreme Court hearing about affirmative action policies at Harvard and the University of North Carolina, several justices inquired about whether these schools would ever be able to meet their diversity goals without relying on race as a factor in admissions. After all, former justice Sandra Day O’Connor famously wrote in her 2003 Grutter v. Bollinger opinion that “we expect that twenty-five years from now, the use of racial preferences will no longer be necessary” to further universities’ interest in diversity—the rationale that the policies’ constitutionality rests upon. As Joshua Dunn wrote in his analysis for Education Next, attorneys for the schools refused to give a straight answer.
Sad but true: Higher education seems to assume that racial disparities in achievement among the nation’s top high school graduates—those gunning for admission at America’s highly-selective universities—are both large and permanent. Were students accepted in colorblind fashion, incoming classes wouldn’t “look like America.” And that would have negative consequences for our leadership class in business, politics, the military, and much else.
Set aside for now the many policy debates over affirmative action, including whether a race-based system should be replaced by one focused instead on socioeconomic status. Let’s examine: Was Justice O’Connor’s optimism misplaced, or has the composition of America’s highest-achieving students become more racially diverse in the two decades since her 2003 opinion? The answer to both questions is both yes and no.
Yes, America’s high-achieving students in our elementary and secondary schools are more racially diverse than they were two decades ago. (So, of course, is the overall pupil population.) But Black high achievers in particular have made only incremental gains. Given that affirmative action was originally conceived as a way to level the playing field for the descendants of enslaved people and those mistreated by Jim Crow, such trends are more than a little disappointing.
The top 10 percent over time
For this analysis, I’m looking at the composition of the subset of eighth grade students who score at the 90th percentile or above on the National Assessment of Educational Progress (NAEP), a.k.a. The Nation’s Report Card, in math and reading. These top-10-percent students are the ones with the best shot at getting into America’s most selective colleges. Of course, that hugely oversimplifies things, given that we’re talking just about test scores and not grades, extracurricular activities, musical or athletic talent, etc. But if we want to find a nationally representative metric of pure academic achievement, this is the best we’ve got.
I’m using eighth grade scores simply because we don’t have post-pandemic scores for twelfth graders. (The last time NAEP assessed that grade level was in 2019.) So keep in mind that we’re comparing eighth graders in 2003 to eighth graders in 2022—so the high school graduating classes of 2007 and 2026 (this year’s high school freshmen).
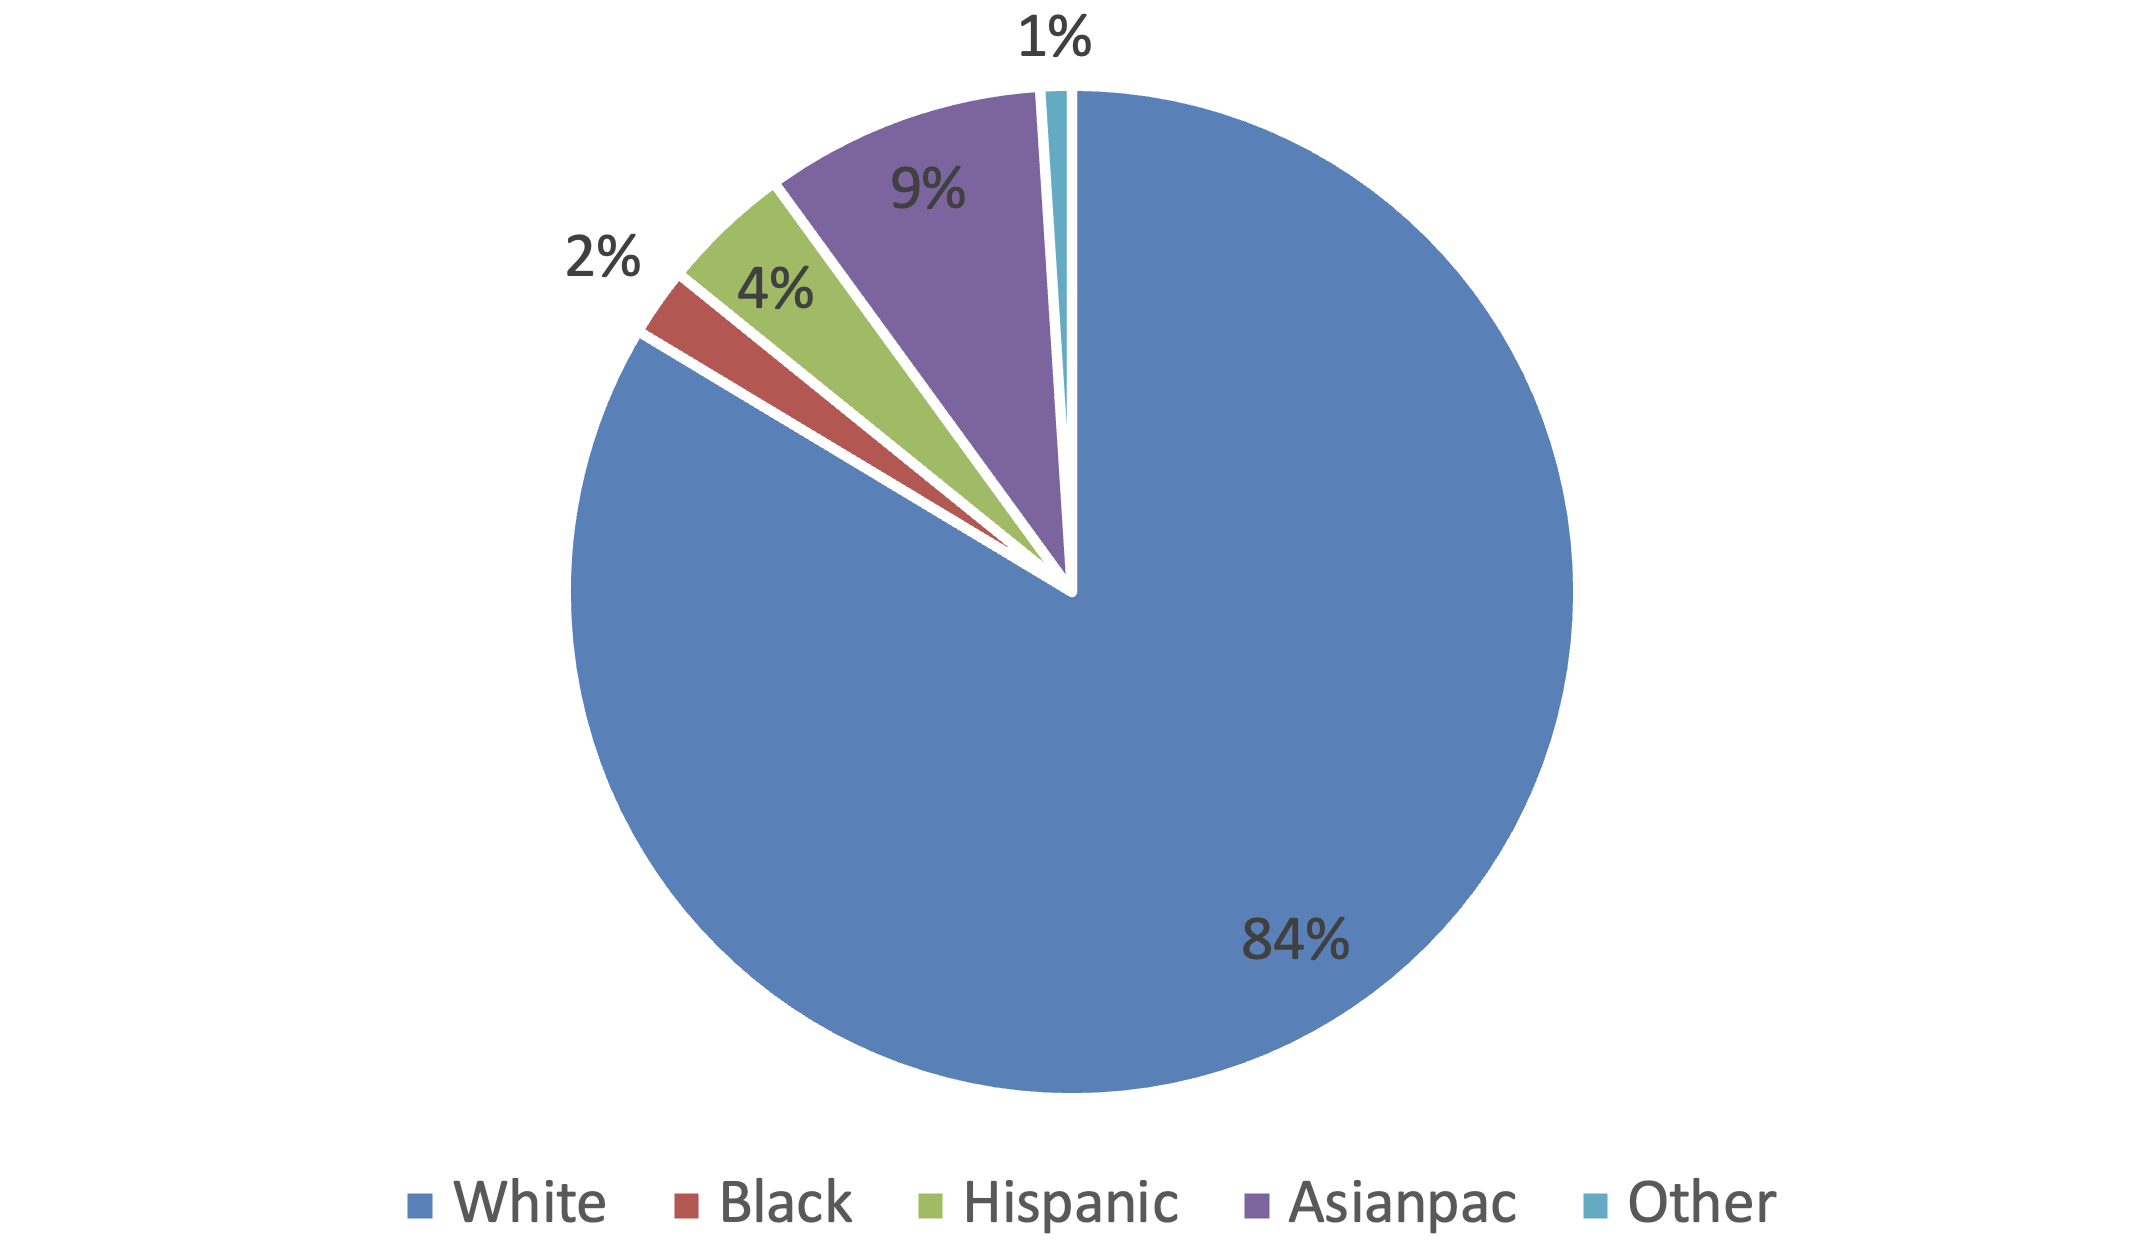
On to the numbers. Here’s what our top math students looked like in 2003:
Figure 1. Racial composition of eighth grade students at the 90th percentile or above in math, 2003
And here’s how that had changed by the spring of 2022:
Figure 2. Racial composition of eighth grade students at the 90th percentile or above in math, 2022
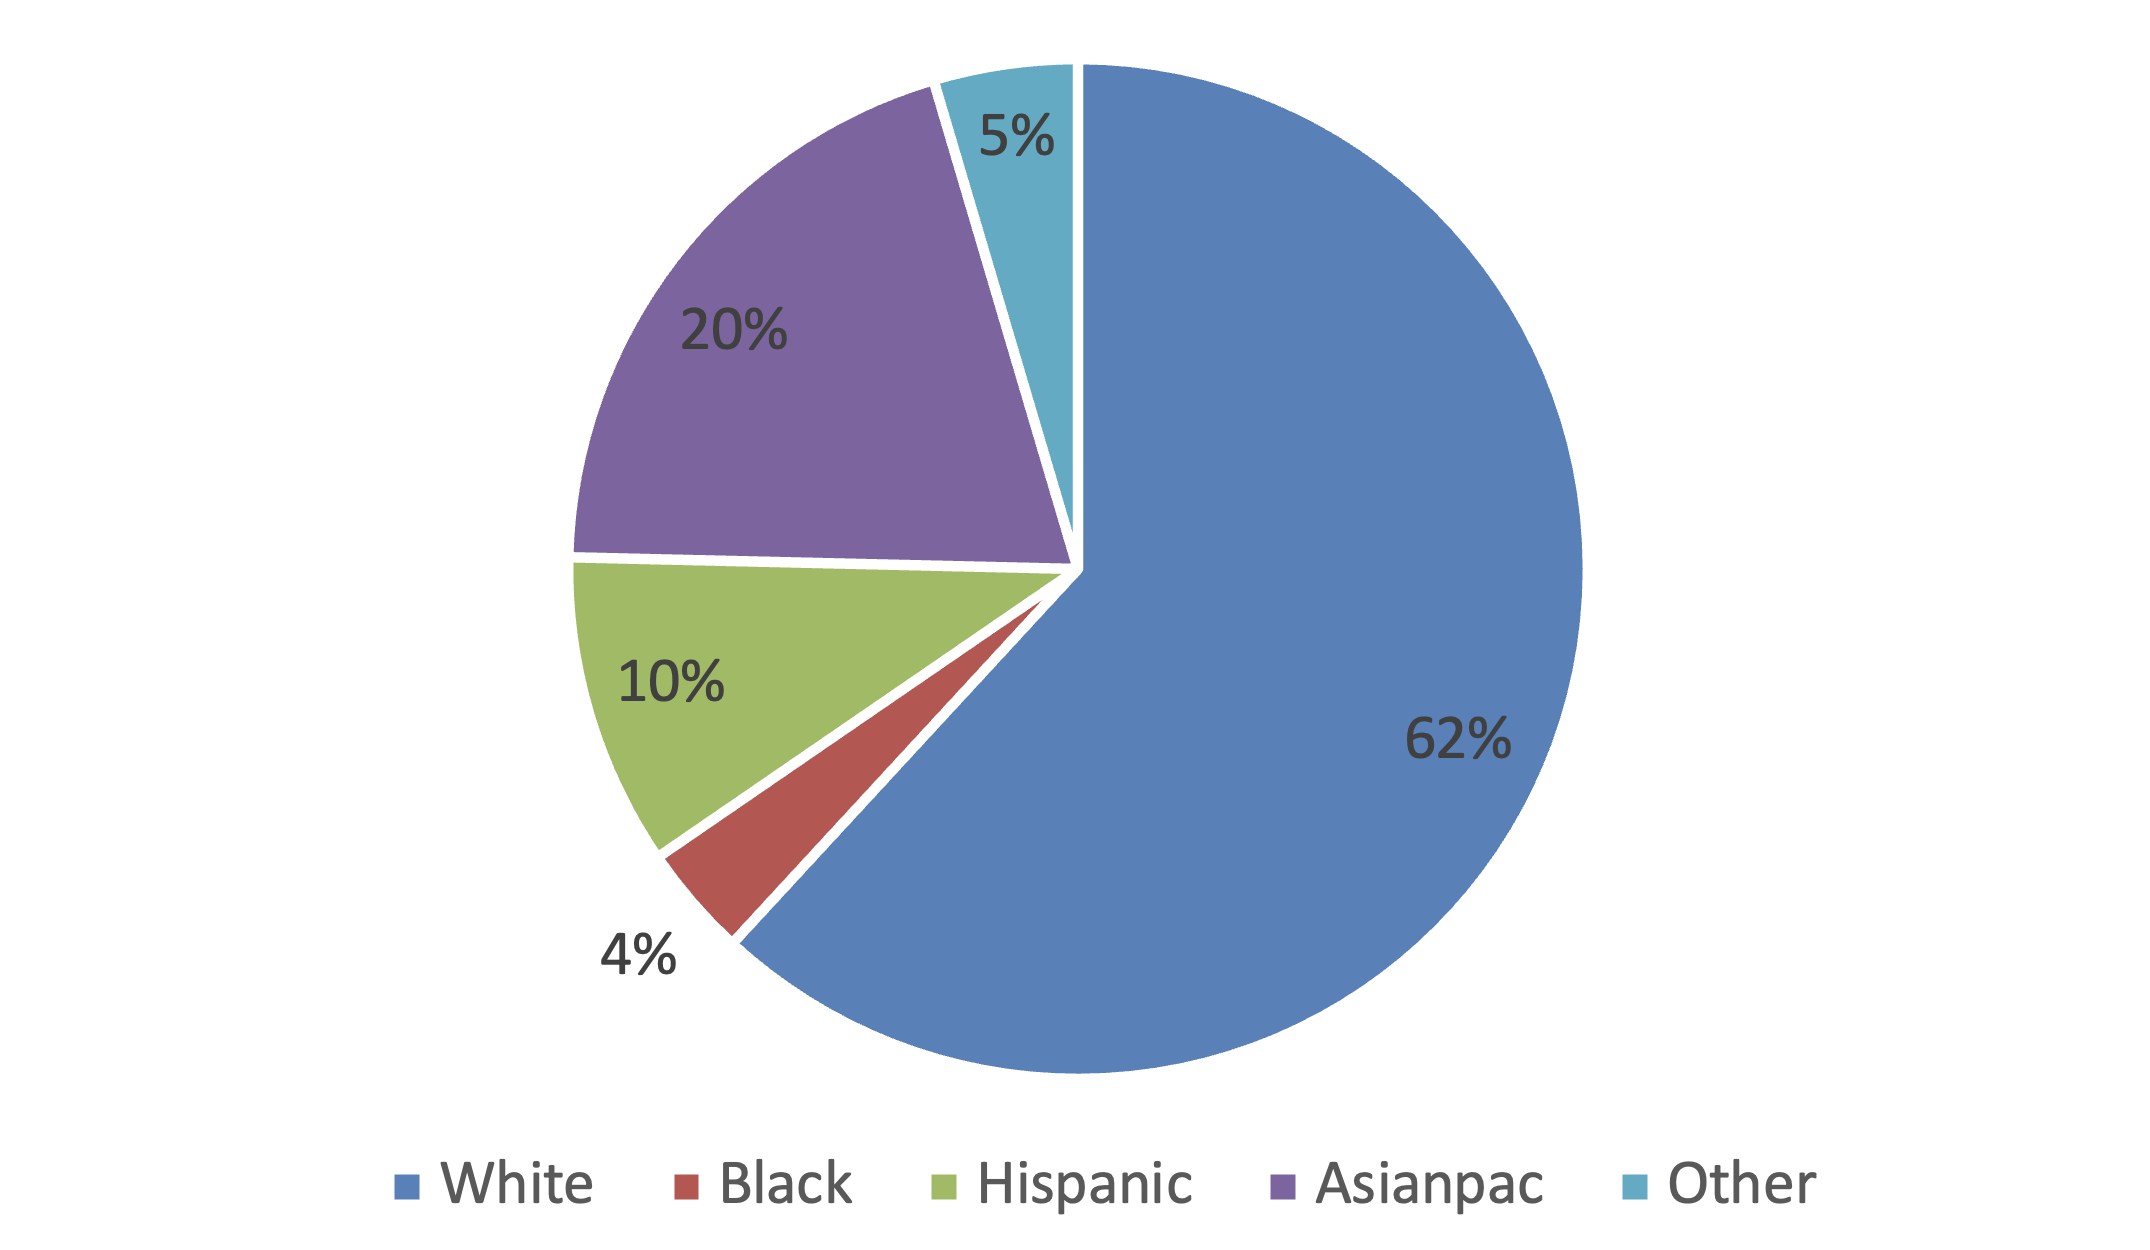
As anyone can plainly see, the proportion of high achievers who are White dropped significantly, from 84 to 62 percent. And yes, the proportion of high achievers who are Black doubled over that time—from a very low 2 percent to the still tragically low 4 percent. Most of the diversity gains came from Hispanic students (who went from 4 to 10 percent) and Asian students (from 9 to 20 percent).
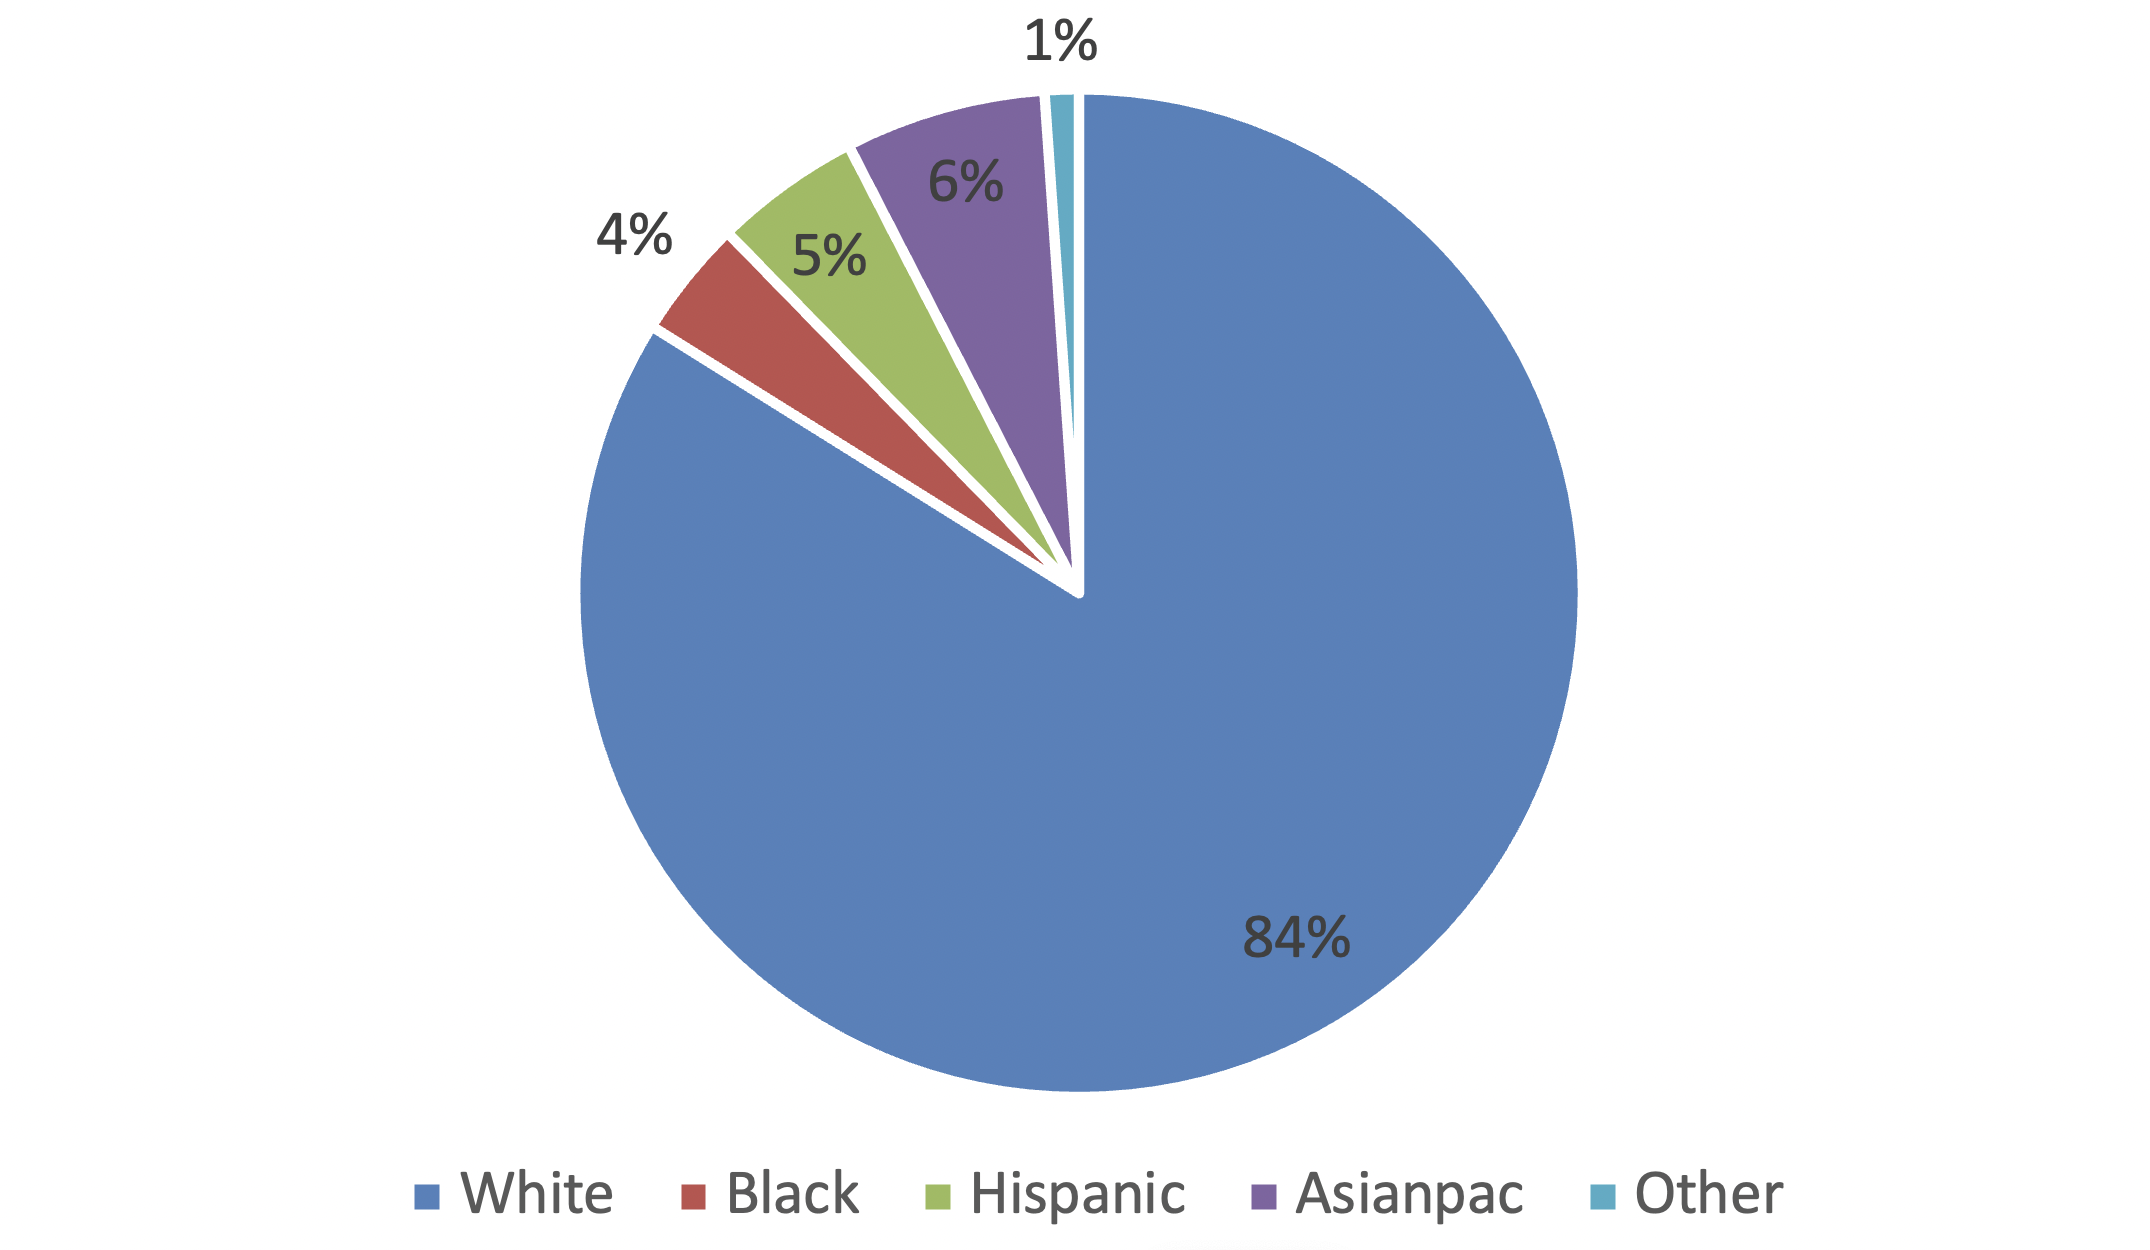
Now let’s see how it looks for reading, first in 2003:
Figure 3. Racial composition of eighth grade students at the 90th percentile or above in reading, 2003
And now in 2022:
Figure 4. Racial composition of eighth grade students at the 90th percentile or above in reading, 2022
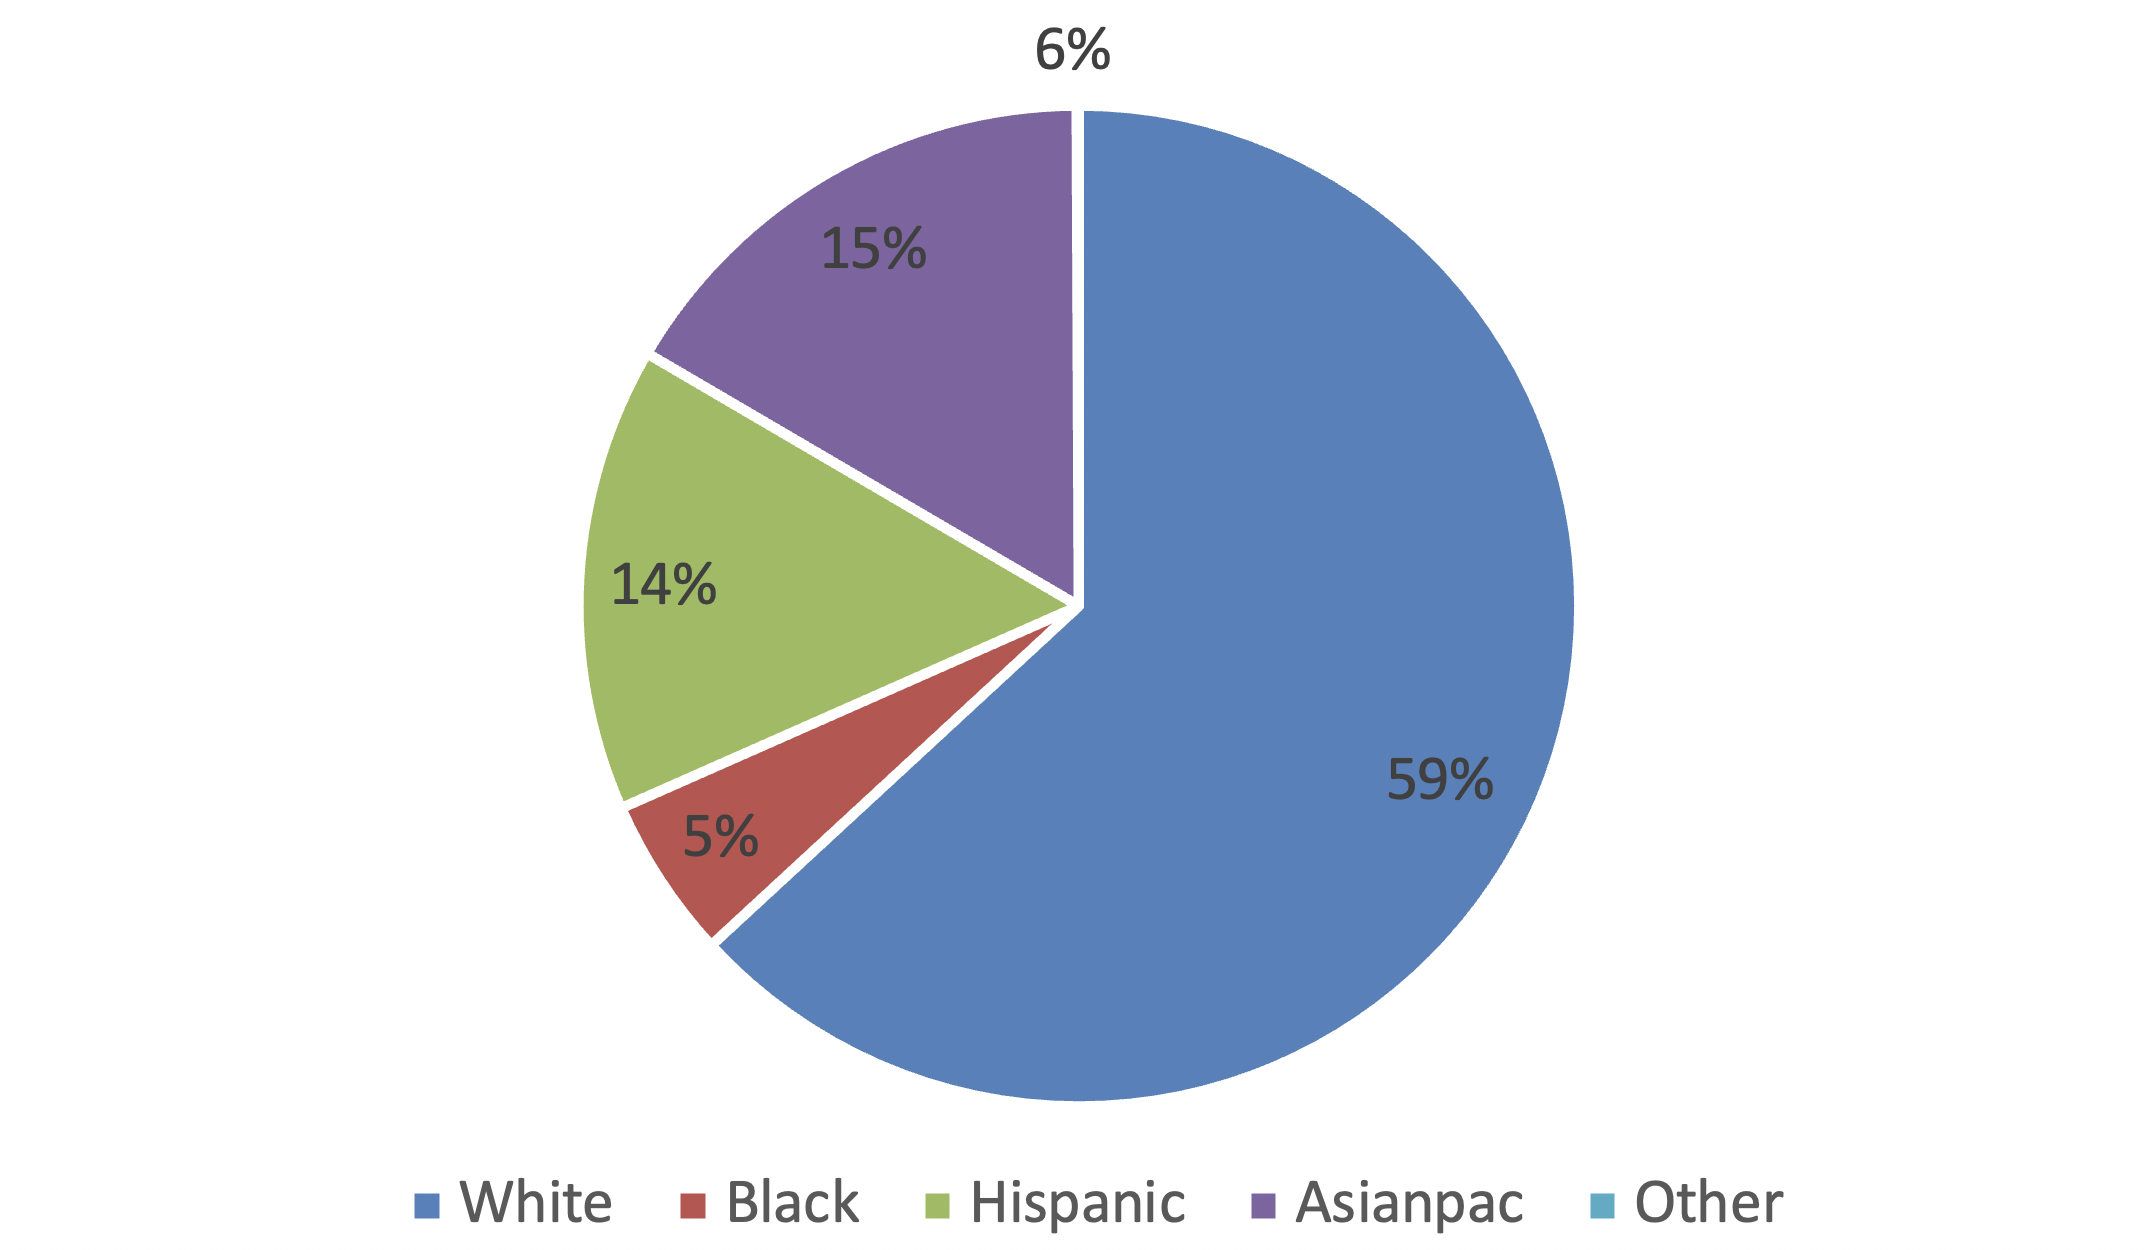
The pattern is largely the same: big declines in the proportion of White students, with large gains for Asian and Hispanic students—more the latter than the former when it comes to reading. The Black proportion is up slightly, to a very low 5 percent.
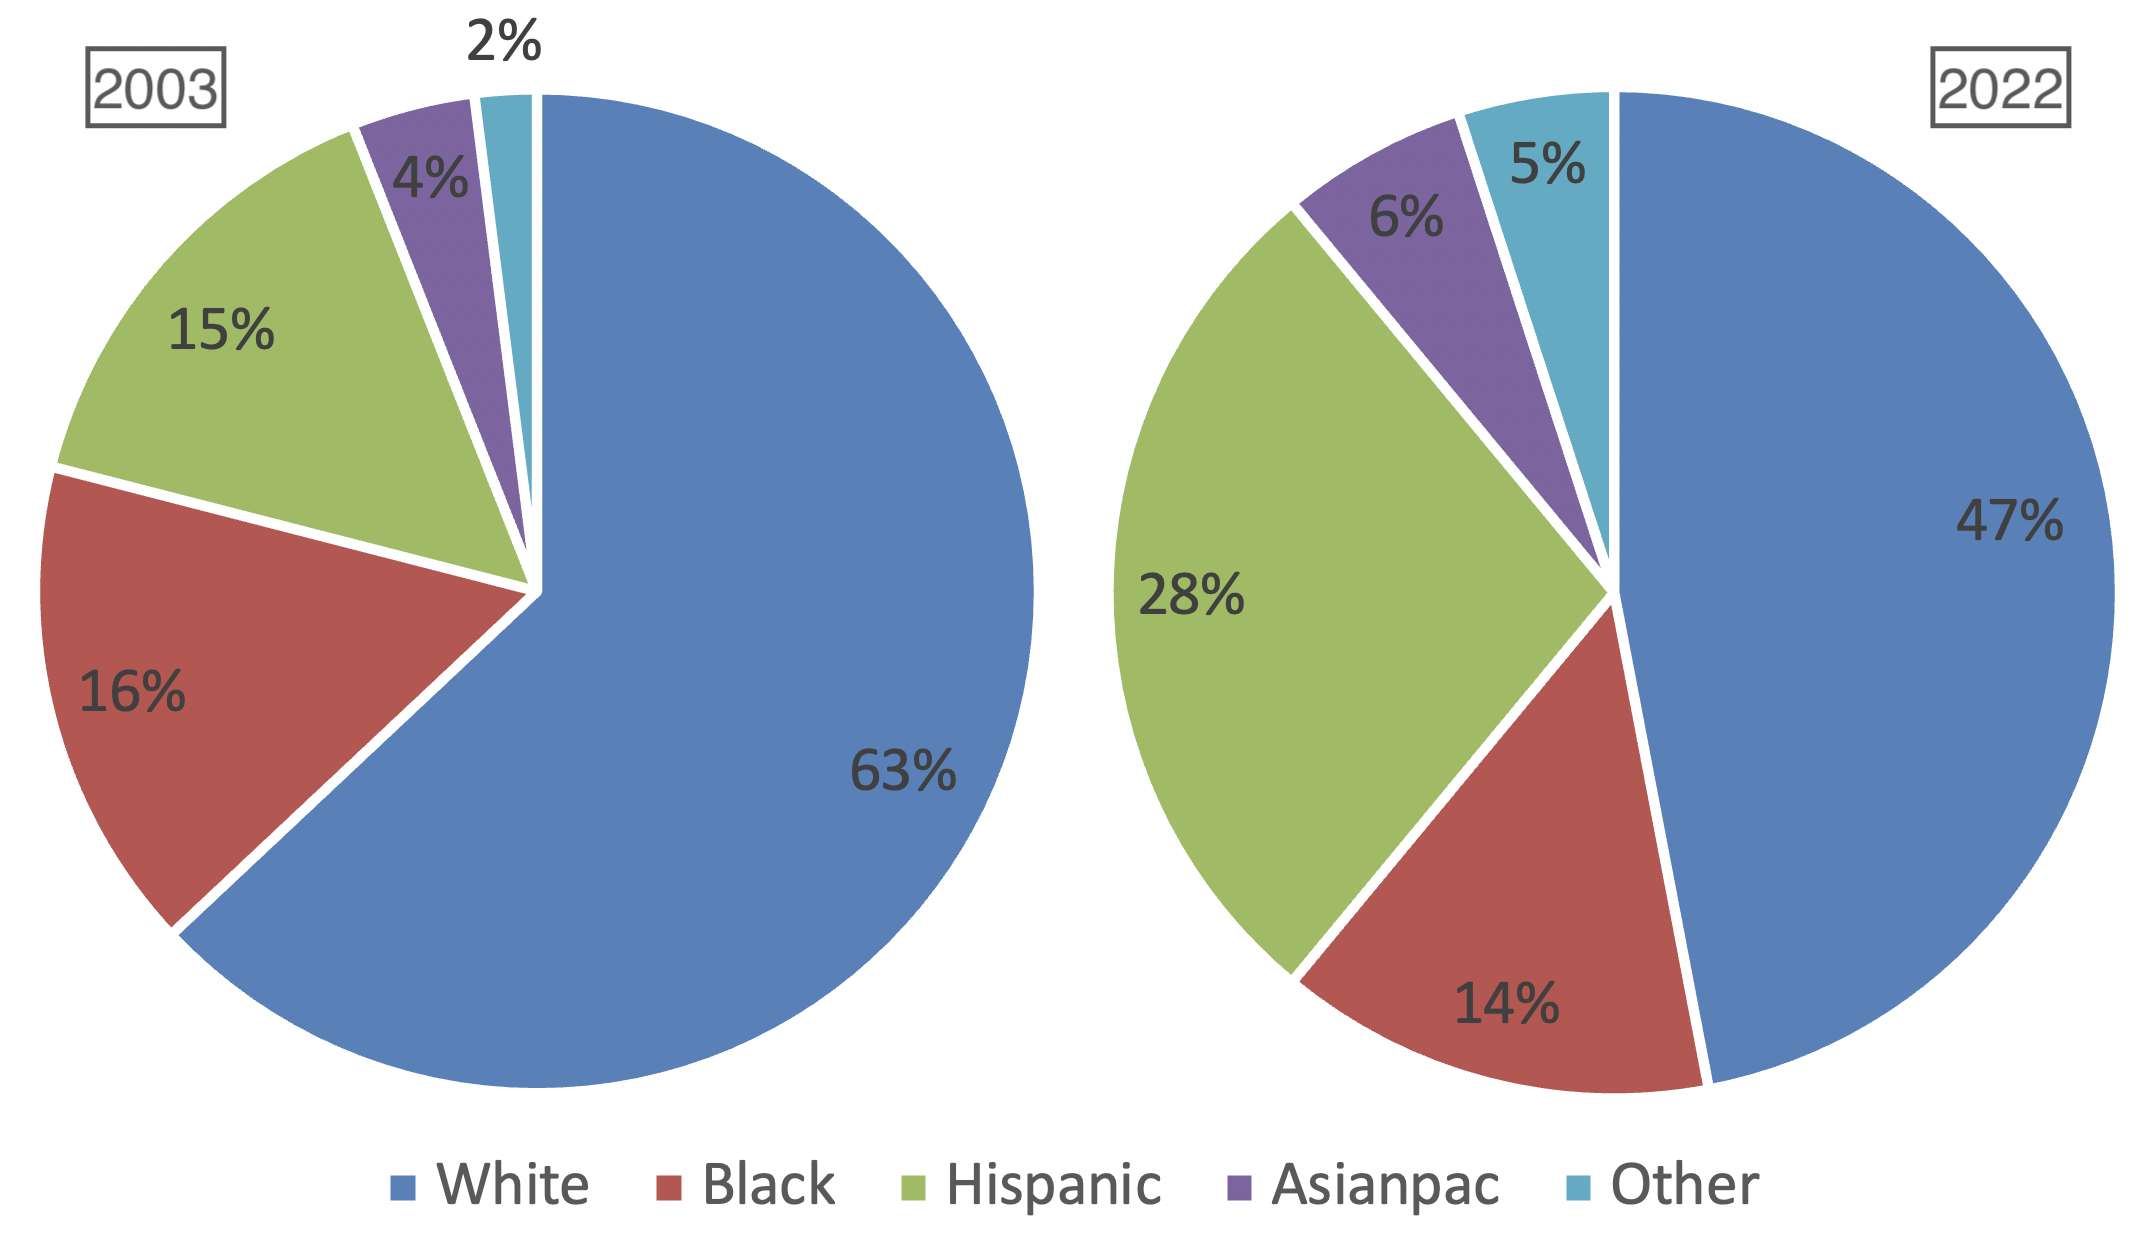
Those are significant changes over twenty years, but these pie charts don’t tell the full story. That’s because the demographics of the American student population writ large have also changed: White students now make up 47 percent of all eighth graders, down from 63 percent in 2003. Meanwhile, the Hispanic student population has grown from 15 percent of the total to 28 percent, and the Asian share has gone from 4 to 6 percent. The Black population share is down slightly, from 16 to 14 percent.
Figure 5. Racial composition of 8th grade student population, 2003 and 2022
So the composition of high-achieving students is more diverse now than in 2003. But is it more representative of the student population, considering our changing demographics? Take a look at these data:
Table 1. Racial composition of students at the 90th percentile on NAEP math versus all students, 2003 and 2022
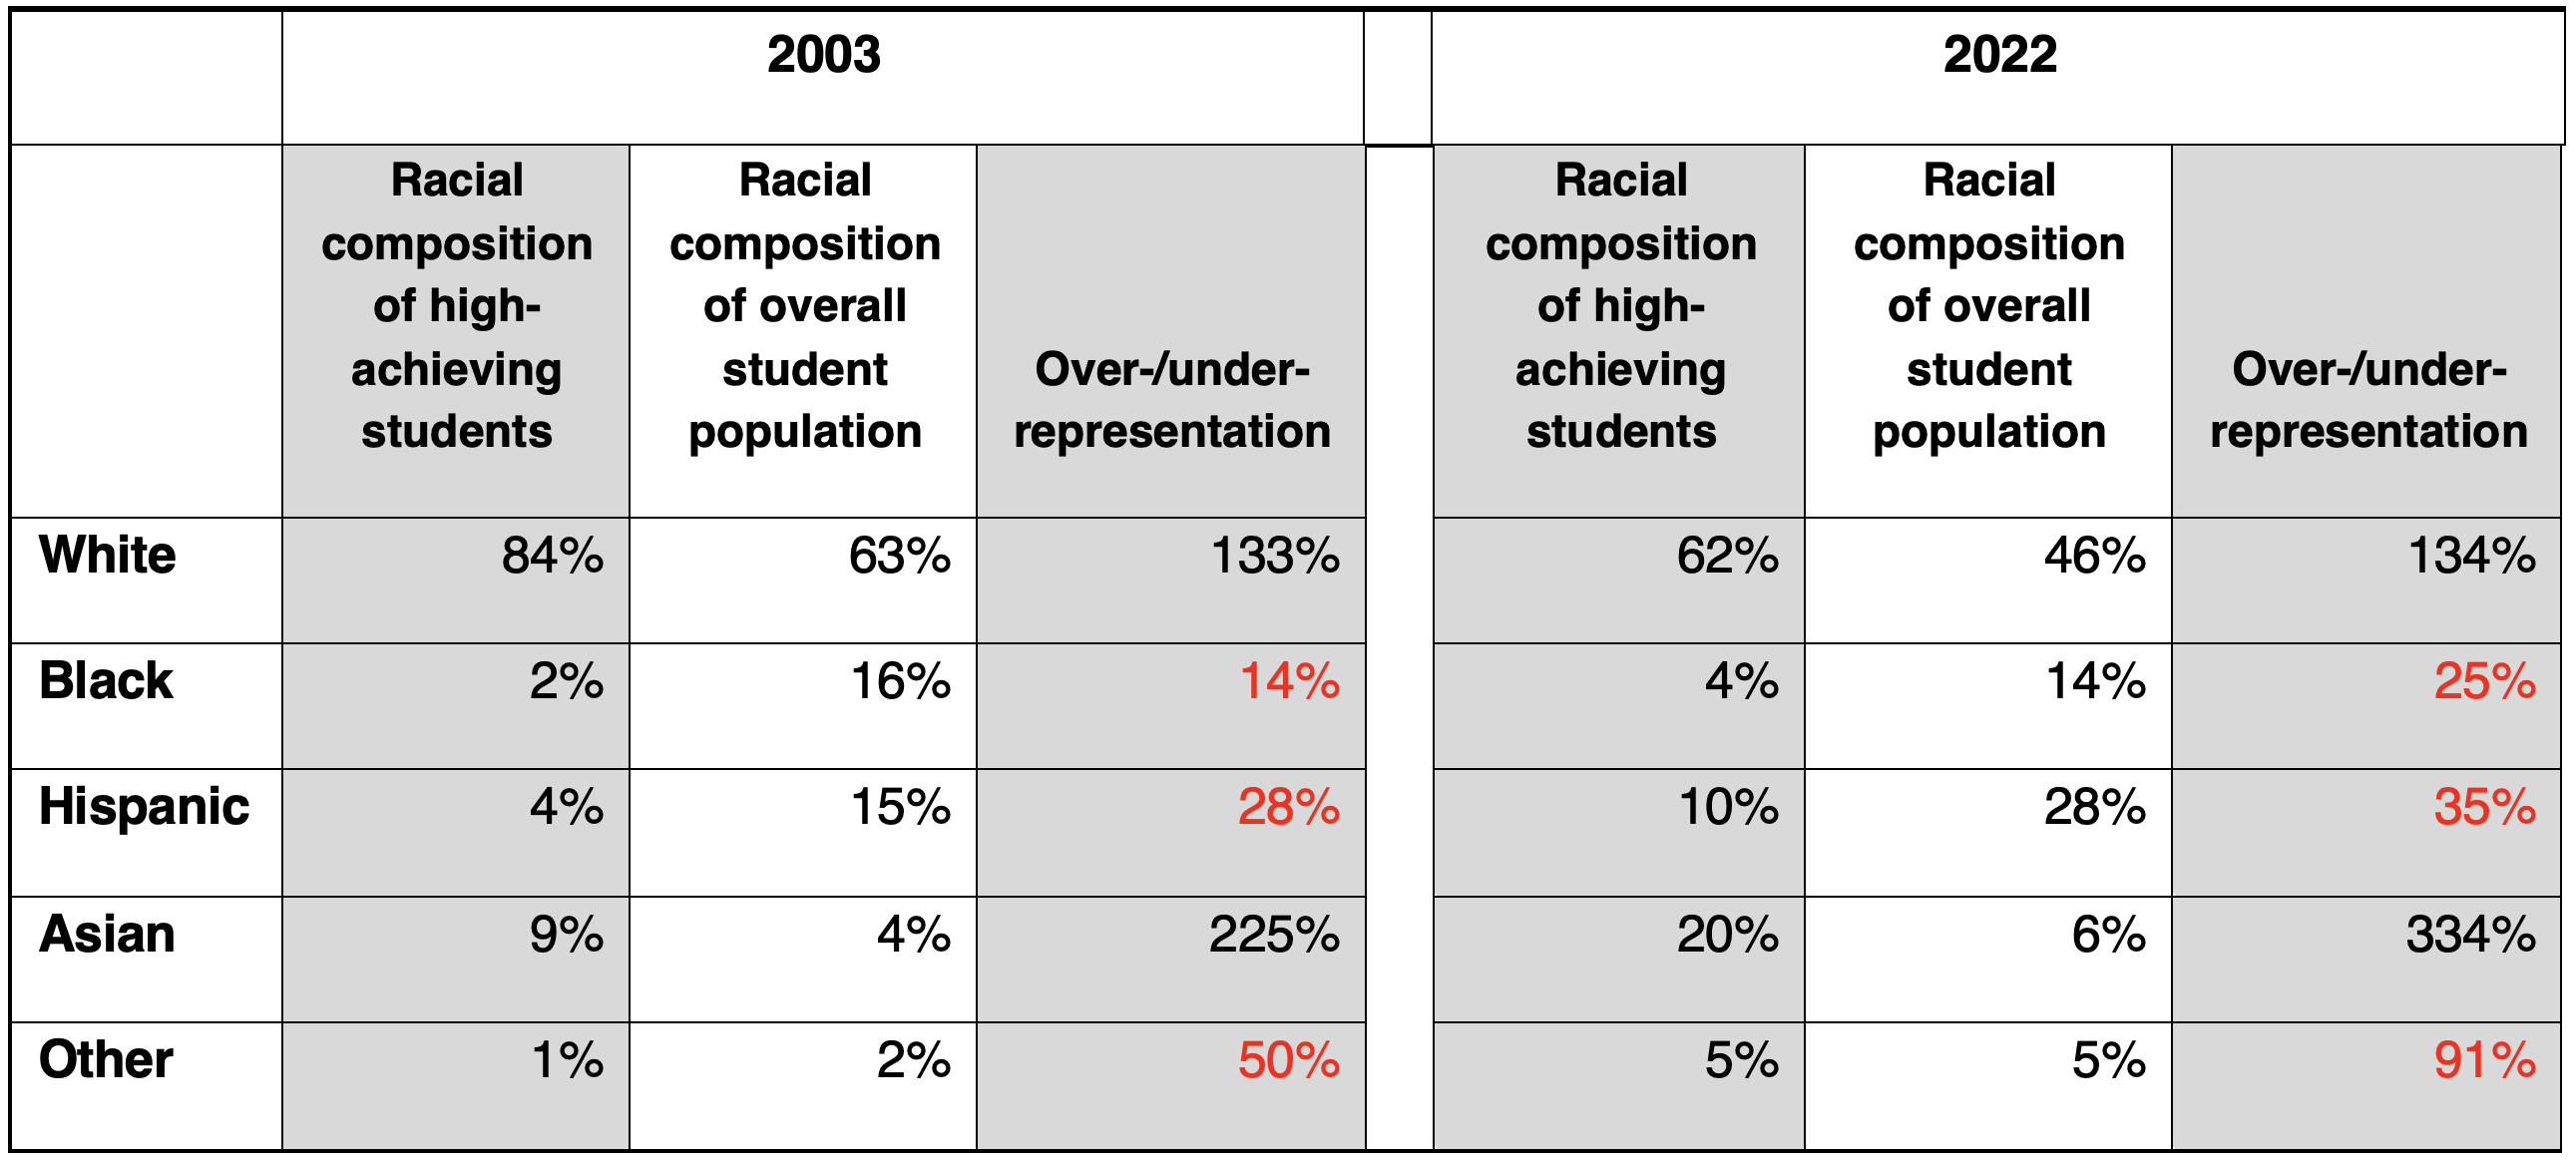
Values above 100 percent for “over-/under-representation” mean that a group is over-represented among high achievers, compared to their share of the total student population; anything under 100 percent means the group is under-represented.
What we see from these data, then, are that high-achieving math students in 2022 were not only more diverse than their counterparts in 2003, but also that under-represented groups were less under-represented. That’s the good news.
The bad news is that there’s still so far to go. Black high achievers now make up 4 percent of the total, up from 2 percent in 2003, even as their share of the total population dropped from 16 to 14 percent. That’s a huge amount of progress on a relative basis. Yet it’s still the case that there are barely one-quarter the number of Black high-achieving math students as there would be were their numbers proportional to their overall population. For Hispanic students, it’s just over one-third. This is better than in 2003, but it’s not much to celebrate.
Asian students, meanwhile, are even more over-represented than before. They used to be twice as likely to be in the high-achieving group as one would expect from their population share; now they are more than three times as likely. The fact that 20 percent of our high-achieving math students are Asian, then, reflects both the growing Asian population in America, and their improved performance over time.
The one constant has been White students: In 2003, they were about one-third more likely to be in the high-achieving student group than one would expect based on their population share, and that’s still the case today.
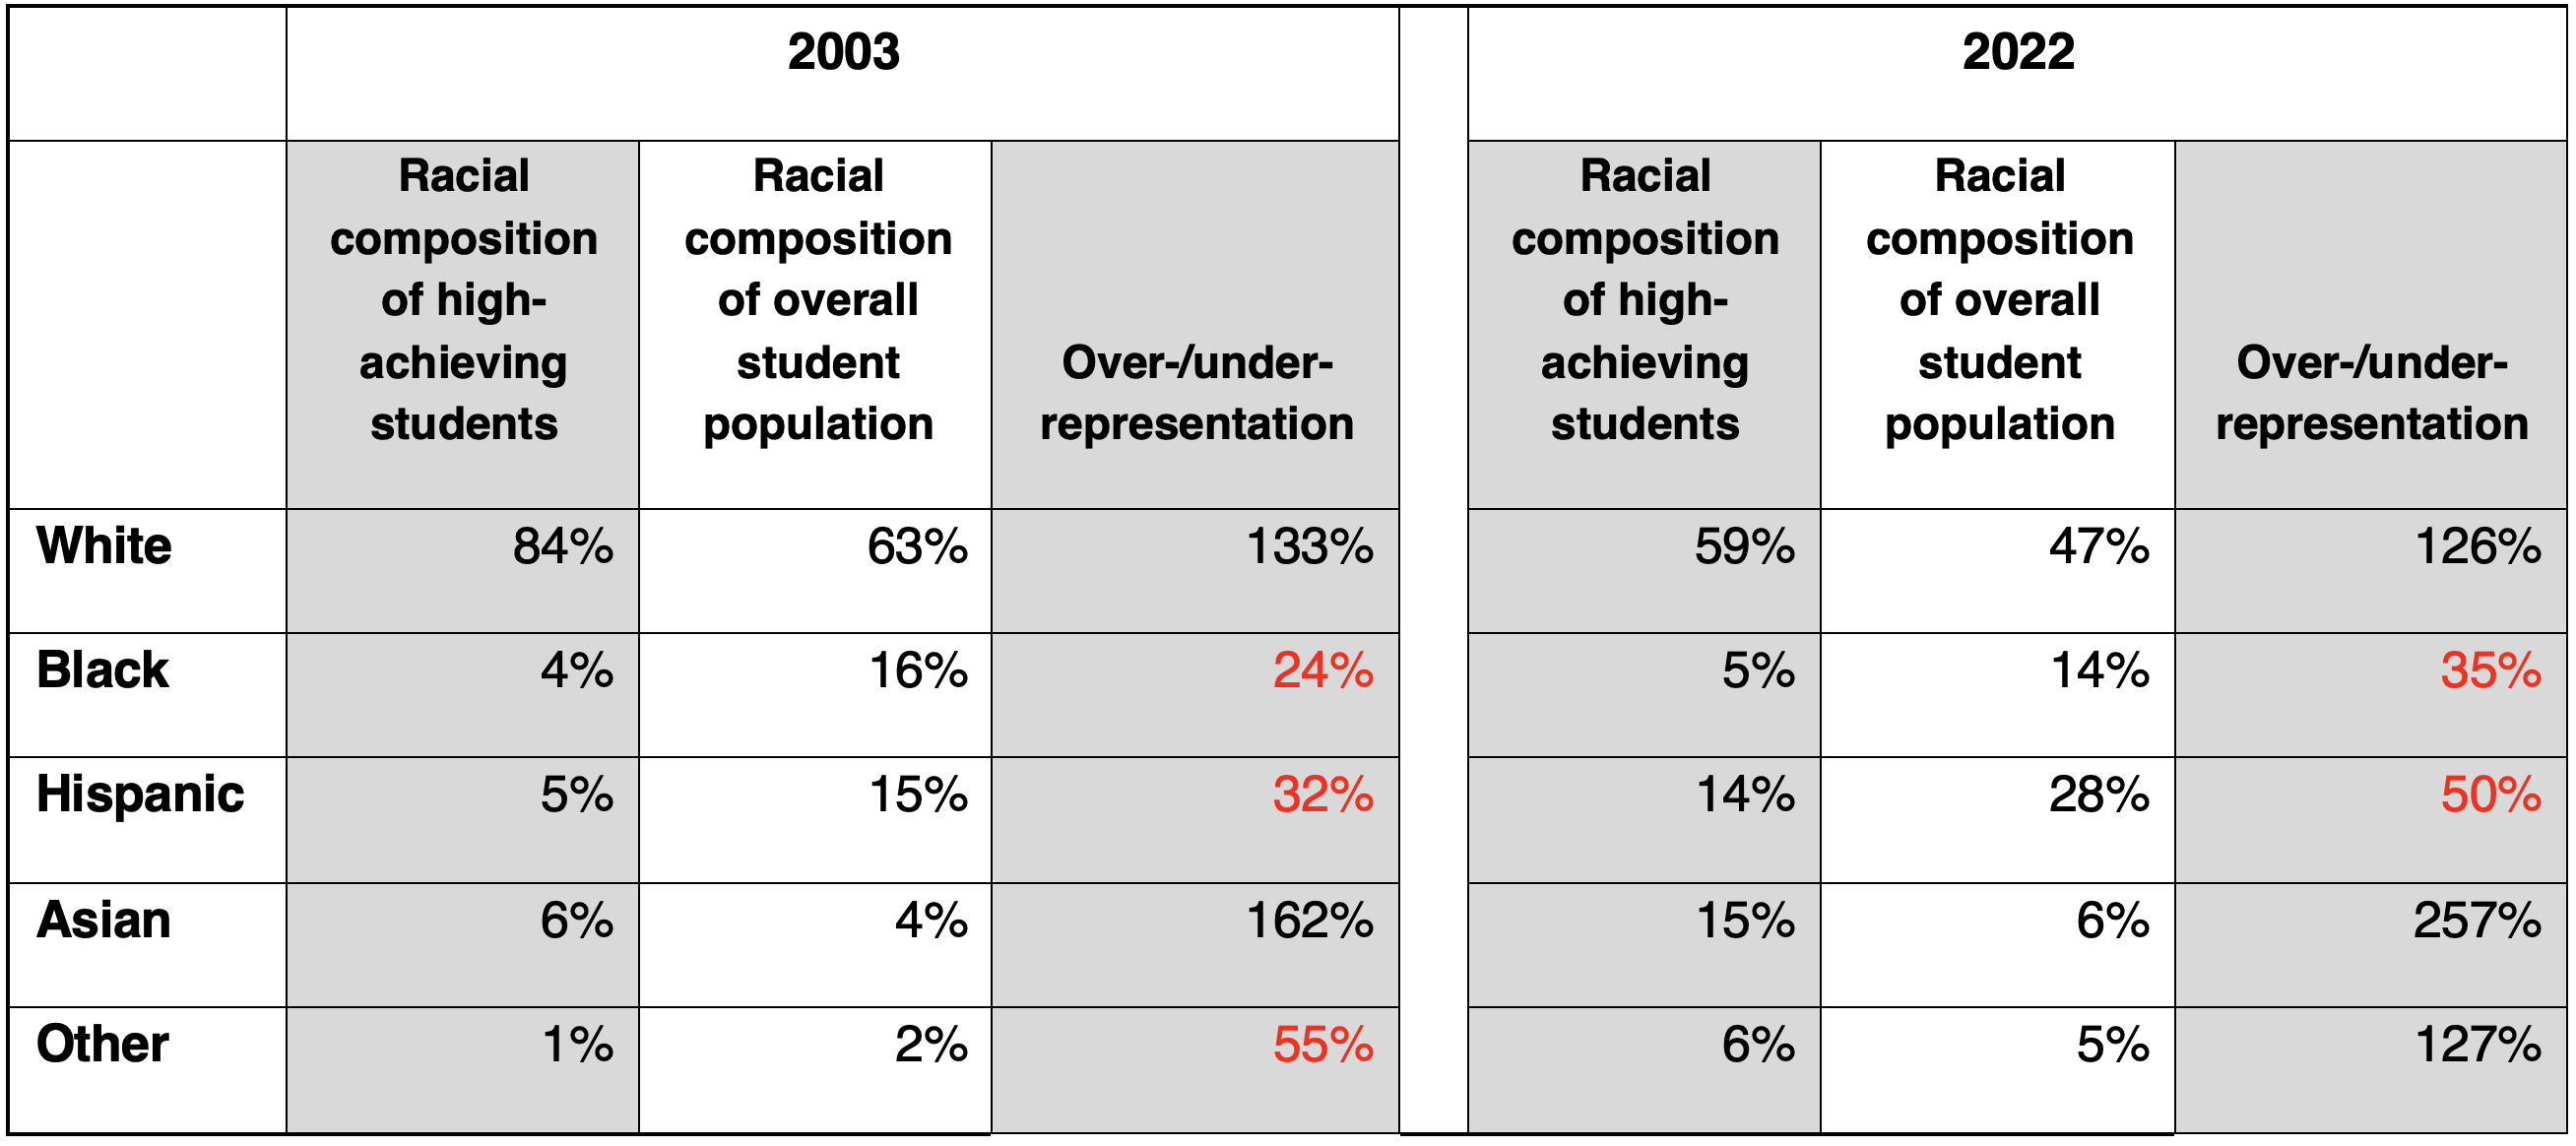
The trends in reading are broadly similar, with a bit more progress for Hispanic students, at the expense of White students:
Table 2. Racial composition of students at the 90th percentile of the reading NAEP versus all students, 2003 and 2022
Analysis
So what can we take from all of these numbers?
First, let’s recognize that America’s high-achieving students are a more diverse group at the end of middle school now than they were just twenty years ago. Given that these are the students most likely to arrive four years later at our most selective universities, it’s no surprise that those campuses have become much more diverse, as well.
Yet most of this growing diversity has been driven by gains by Hispanic and Asian students. For Hispanic student, that largely tracks the growth of their population writ large. That’s part of the story for Asian students, too, but it’s also because of their improved performance. There’s been progress for Black students, but from such a low starting place that their numbers remain tragically low.
So was Justice O’Connor right that we are nearing the day when colorblind admissions would result in university classes just as racially diverse as America? Sadly, no. At least based on NAEP scores, such an approach would result in student bodies in which Asian students would be significantly over-represented, White students somewhat overrepresented, Hispanic students somewhat underrepresented, and Black students significantly underrepresented.
Which of course is why the Harvards of the world continue to come up with creative, if constitutionally dubious, ways to boost the chances of Black students and depress the chances of Asian students when applying for the golden ticket of admissions.
Meanwhile, the challenge for America’s K–12 system remains the same as it was twenty years ago: How to accelerate the progress of all students, including our high achievers, and especially our Black and Hispanic high achievers, so that Justice O’Connor’s expectation can finally be met.
Special thanks to Ebony Walton of the National Center for Education Statistics and Fordham’s Jeanette Luna for their assistance with the data presented here.


