Because the pandemic exacerbated chronic absenteeism in many parts of the country, the need to understand how schools can improve student attendance has never been greater. Accordingly, this study breaks new ground by examining high schools’ contributions to attendance after accounting for individual students’ prior absenteeism and other observable characteristics—that is, their “attendance value-added.”
To gauge the validity and reliability of this new indicator of school quality, Jing Liu of the University of Maryland analyzed more than a decade of data on student attendance, reading and math achievement, and long-term outcomes, such as college enrollment.
He finds:
- Conventional student-absenteeism measures, including chronic absenteeism rates, tell us almost nothing about a high school’s impact on students’ attendance.
- Like test-based value-added, attendance value-added varies widely between schools and is highly stable over time.
- There is suggestive evidence that attendance value-added and test-based value-added capture different dimensions of school quality.
- Attendance value-added is positively correlated with students’ perceptions of school climate—and, in particular, with the belief that school is safe and behavioral expectations are clear.
To read the full report (with appendices), and its implications for educational leaders and policymakers, scroll down or download the pdf.
Foreword/Executive Summary
By Amber M. Northern and Michael J. Petrilli
For many parents and teachers, the Covid experience has confirmed at least two pieces of common sense: It’s hard for kids to learn if they’re not in school, and those who are in school tend to learn more.[1] Yet in some communities, the crisis persists, thanks to one of the pandemic’s most pernicious effects: the surge and apparent normalization of student absenteeism, especially in the many low-income communities that have been slammed by the virus.
Nationally, one in four students was chronically absent in 2020,[2] and it’s not over: 59 percent of Detroit students are on pace to fit that category in 2021–22.[3] In many parts of America, enrollment data show tens of thousands of students to be simply missing, even after accounting for increases in charter, private, and home school enrollment.[4]
A focus during the post-Covid education recovery phase, then, should be making sure students return to school. Yet our systems for measuring their attendance—and holding schools accountable for getting kids back into classrooms—are woefully inadequate.
First, most jurisdictions rely exclusively on raw attendance rates and/or chronic-absenteeism rates, both of which are highly correlated with student demographics and other factors that schools generally cannot control.[5] Nevertheless, such metrics are ubiquitous in state accountability systems, with at least thirty states and the District of Columbia having adopted student absenteeism, chronic absenteeism, or variants thereof as a “measure of school quality” under the Every Student Succeeds Act.
Second, many states and districts do a poor job of measuring attendance because they can’t (or choose not to) differentiate between full-day absences and partial-day ones (as in, when students show up for some classes but not for others). Prior research shows that partial-day absenteeism in secondary school is rampant, mostly unexcused, and explains more missed classes than full-day absenteeism.[6] Part-day absences increase with each middle school grade and then rise dramatically at the transition to high school.
In short, the most widely adopted “fifth indicator” under ESSA has been framed in ways that are hopelessly broad and unfair. But why? After all, collecting detailed attendance data ought to be straightforward in the era of smart phones and live tweets. And nothing prevents states from designing more sophisticated attendance and absenteeism gauges, as they already do when it comes to test scores. Just as “value-added” calculations derived from test scores help parents and policymakers understand schools’ impact on students’ achievement, so too might a measure of schools’ “attendance value-added” complement raw attendance or chronic-absenteeism rates by highlighting schools’ actual impact on attendance—after taking students’ preexisting characteristics into account. Such an approach is also fairer, as it doesn’t reward or penalize schools based on the particular students they serve. But what’s more important, in our view, is that if “attendance value-added” were baked into accountability systems, it might encourage more schools to embrace changes that actually boost attendance.
For instance, some schools form task forces to closely monitor attendance to catch problems early, such that three absences might raise a warning flag that triggers a parent phone call. They make home visits if parents can’t be reached by email or phone. They refer students with frequent absences to the school counselor or social worker for case management and counseling, as needed. They establish homeroom periods in high school, where students remain with the same teacher all four years so that they form relationships, making it easier for the educator to monitor and discuss attendance with the child and family.
We wanted to know whether these types of efforts might be isolated and reliably measured such that schools get credit (or don’t) for making them. To that end, this study examines the following:
1. Whether conventional measures of student absenteeism reflect high school students’ individual characteristics rather than high schools’ effects on attendance.
2. Whether high schools vary in their “attendance value-added.”
3. Whether test-based value-added and attendance value-added are correlated and how well each predicts long-run outcomes, such as postsecondary enrollments.
4. Whether attendance value-added correlates to students’ perceptions of key facets of high school culture and climate, such as safety.
To tackle these questions, we reached out to Jing Liu, assistant professor of education at the University of Maryland and the author of numerous studies on the causes and effects of student absenteeism. He leveraged sixteen years of administrative data (2002–03 to 2017–18) from a large and demographically diverse district in California whose attendance information included data on partial-day absences. It’s worth your time to read this (fairly short) study and Jing’s policy implications, but for those in a rush, here are the four key findings:
1. Conventional student absenteeism measures tell us almost nothing about a high school’s impact on students’ attendance.
2. Like test-based value-added, attendance value-added varies widely between schools and is highly stable over time.
3. There is suggestive evidence that attendance value-added and test-based value-added capture different dimensions of school quality.
4. Attendance value-added is positively correlated with students’ perceptions of school climate—in particular, with the belief that school is safe and behavioral expectations are clear.
There’s much to unpack here, but to us, four takeaways merit attention.
First, more information is better.
The message from this study isn’t that schools need to stop reporting raw attendance rates and chronic absenteeism. Instead, we think a both/and rather than either/or approach is the right choice. In fact, we’d go so far as to suggest that, just as some states have two grades for schools based on test scores (one for achievement and one for growth), we should consider having two measures of attendance (chronic absenteeism and “value-added” measures, once they’re vetted).[7]
In general, status measures and growth measures are apples and oranges, so it doesn’t make sense to average or aggregate them. The simplicity and usefulness of a single, summative grade is lost if it doesn’t serve any one purpose well.
For instance, if the purpose is to decide whether to renew a school’s charter for the next five years, that decision should rest on growth-based test-score measures. But if the purpose is to understand whether students are ready for college and career, status-based measures are best. Each tell us something different. So it is with chronic-absenteeism rates and attendance value-added.
Second, better attendance measures have real-world implications for educators.
One of the reasons for measuring a school’s impact on attendance is to be able to hold school staff accountable for what’s under their control. Plus, we want to encourage behavior that will make it likelier that students will come to school so they can learn more. “Value-added” measures are the best way to do that. They help us gauge how well teachers and school leaders cultivate better attendance because they adjust for what teachers and principals can’t influence, such as students’ demographics, baseline achievement, and prior absences and suspensions. Without making these adjustments, a chronic-absenteeism rating (based on raw attendance) might make a high-poverty school look bad, even if it’s actually high performing. Simply put, attendance value-added differentiates between high-poverty schools that deserve to be lauded and those that demand intervention.
Likewise, we need to worry about demotivating the teachers and principals who choose to work in high-poverty schools and may be getting unfairly penalized when, in reality, they are making progress in improving student attendance, even if the “status” measures remain unsatisfactory.
All that said, this study is the first to explore the feasibility of attendance value-added, and we need other researchers to test the measure empirically—with larger samples and in other states—before it’s ready for prime time. What’s more, though the study undoubtedly demonstrates the promise of attendance value-added, it also underscores the strength and utility of test-based value-added measures—and why we’d be foolish to move away from them.
Third, better attendance measures could help students and families make better decisions.
On average, attending a high school with high attendance value-added increases a student’s attendance by twenty-eight class periods (or roughly four school days) per year. And there is suggestive evidence that high schools that do an above-average job of boosting attendance also boost postsecondary enrollment—even if the school’s test-based value-added is middling.
That is to say, just as there are high-test-value-added, low-achievement schools that help students succeed, there are high-attendance-value-added, low-raw-attendance schools that do, too.
Many low-income parents face a choice between two schools with similar achievement and attendance patterns but with value-added scores that vary widely. Helping them to understand and act upon those distinctions is essential. We want parents to choose schools that are “beating the odds,” and value-added measures are one good way to identify these schools.
Finally, school safety matters when it comes to student attendance.
With wonky empirical studies such as this one, practitioners understandably ask, “What do these study findings imply for my work in real schools and classrooms?”
Although we hesitate to rely too heavily on correlational evidence, we’d point to some intriguing student-survey data. They consistently show that the strongest links to attendance value-added pertain to students’ sense of safety at school and their perception that the rules and behavioral expectations are clear.
In other words, staff who earnestly want to improve attendance rates should be mindful that safe schools and coming to school go hand in hand.
*************
To repeat, one in four American students was chronically absent in 2020, up from the previous rate of one out of six in 2017–18.[8] Thankfully, buildings reopened last year as educators learned to navigate the pandemic. But it’s past time to get all our kids back in school.
Cultivating a positive school culture—one that prioritizes student engagement, safety, and high expectations—has been and always will be a key piece of the attendance puzzle. But so is developing a novel way to isolate and measure a school’s impact on attendance so that the efforts (or lack thereof) of those who work there can be made visible.
That’s important because better measures can inform strategies to deter those absences in the first place.
Introduction
It’s no secret that kids who aren’t in school don’t learn as much. Everyday experience and systematic research suggest that student absenteeism negatively impacts both short-run academic achievement and long-run outcomes such as high school graduation and college enrollment.[9] “Chronic absenteeism,” commonly defined as missing at least 10 percent of a school year (or about eighteen days), is widely accepted as a leading indicator of academic peril. At least thirty states and the District of Columbia have adopted student absenteeism, chronic absenteeism, or variants thereof as a “measure of school quality” under the Every Student Succeeds Act.
Yet, despite the central role that student absenteeism plays in educational effectiveness and policy, little is known about the extent to which schools actually influence students’ attendance (or the likely academic benefits of enrolling in a school that succeeds on this front). Recent studies have found that individual teachers can have a significant effect on student attendance.[10] But it’s likely that schools also impact attendance through mechanisms such as creating a culture of attendance, connecting with parents, and ensuring students’ physical safety, despite the fact that some principal determinants of a schools’ attendance rate—such as students’ home lives, access to transportation, and physical health—are largely beyond the control of educators.
As American education slowly emerges from yet another Covid-induced wave of school closures and quarantines, the need to understand how and why schools affect student attendance has never been greater. Accordingly, this study breaks new ground by using a value-added framework to examine high schools’ contributions to attendance after accounting for individual students’ prior attendance rates and other observable characteristics. In other words, it seeks to gauge schools’ “attendance value-added.”
With test-based value-added as a reference point, the study also evaluates the validity of this new indicator of school quality by quantifying its stability, impacts on short-term and long-term outcomes, and links to students’ perceptions of school climate.
Specifically, the study answers the following research questions:
1. To what extent do conventional measures of student absenteeism reflect high school students’ individual characteristics as opposed to high schools’ effects on attendance?
2. To what extent do high schools vary in their “attendance value-added”? And how much does a typical high school’s attendance value-added vary over time?
3. How strongly correlated are test-based and attendance value-added? And how well do each of these measures predict long-run outcomes such as postsecondary enrollment?
4. How strongly does attendance value-added correlate to students’ perceptions of various dimensions of high school culture and climate (e.g., safety)?
Background
Like its test scores, a school’s raw attendance rate often reflects the challenges its students face outside of school rather what happens within it. For example, a number of studies have found that minority, low-income, and low-achieving students accrue more absences than their White, high-income, and high-achieving peers.[11] Thus, if the goal is to hold schools accountable for what’s under their control—and shine a light on those that succeed in promoting attendance—it is critical to account for students’ demographics and educational histories.
One previous study evaluated school performance by using absenteeism (along with many other non-test-score student outcomes) using a value-added framework;[12] however, it focused on full-day absenteeism, meaning that it failed to capture partial-day absenteeism (e.g., coming to school on time but skipping sixth period), which other research suggests accounts for at least half of lost instructional time at the secondary level.[13] Failing to account for these additional absences could lead to biased estimates of schools’ impacts, especially when partial-day absenteeism is more prevalent in some schools than others. Hence the present study’s focus on the total number of classes that a student misses rather than the total number of days that he or she is absent (or his or her chronic-absenteeism status).
Test-based value-added, which is a well-established measure of school quality, is a useful benchmark for “attendance value-added” insofar as it helps us understand whether the latter provides similarly useful information. And linking both measures to students’ long-run outcomes can help unpack the complex mechanisms through which schools contribute to student success.
Data and Sample
This study uses sixteen years of administrative data (2002–03 to 2017–18) from a large and demographically diverse urban school district in California that serves approximately 60,000 students each year.[14] This dataset is unique in that it contains student attendance records for each class, allowing for a highly precise measure of student absenteeism.[15] It also includes detailed information on students’ gender, race/ethnicity, special-education status, English-language-learner status, discipline histories, math and English language arts (ELA) test scores, grade point average (GPA), and residential addresses (which enable the derivation of neighborhood characteristics)—plus several long-term outcomes, including measures of college enrollment (collected from the National Student Clearinghouse).
Three years of student self-reported school culture and climate survey data (for 2015–16 to 2017–18) are used to examine the associations between attendance value-added and various dimensions of school climate. The survey contains four main constructs, including “climate of support for academic learning,” “sense of belonging,” “knowledge and fairness of discipline rules and norms,” and “sense of safety”; however, for the purposes of this analysis, the two subconstructs that comprise the “knowledge and fairness of discipline rules and norms” constructs (“Rule Clarity” and “Respectful and Fair”) are analyzed separately (for a detailed description of the survey items, see Appendix C in the PDF).
The analytic sample includes 58,125 ninth-grade students[16] who attended a total of twenty regular high schools between 2002–03 and 2017–18.[17] Of the students in this group, 50 percent were Asian, 23 percent were Hispanic, 11 percent were Black, and 9 percent were White. On average, students missed seventy-nine class periods annually or roughly eleven school days (for more descriptive statistics, see Table B1 in the PDF).
Methodology
A high school’s attendance value-added is constructed based on the total number of class periods that its school’s ninth graders missed in a given school year. To isolate a high school’s contribution to ninth-grade attendance in a given school year, the model controls for a rich set of student demographics and prior outcomes, including gender, age, race/ethnicity, English-language-learner status, special-education status, neighborhood conditions, prior achievement, prior suspensions, and prior absences, as well as time-varying school-level covariates that correspond to the individual-level covariates. To avoid mechanical endogeneity in the long-run analysis, we use “leave-year-out” estimates which give additional weight to value-added attendance in more recent years for a given school, and a weighting method to account for the “drift” of school effects (meaning they might fluctuate over time).
We estimate test-based value-added scores using essentially the same methodology. To make attendance- and test-based value-added scores commensurable, both variables were standardized, and attendance value-added was reverse coded (for more technical details, see Appendix A in the PDF).
Findings
Finding 1: Conventional student-absenteeism measures tell us almost nothing about a high school’s impact on students’ attendance.
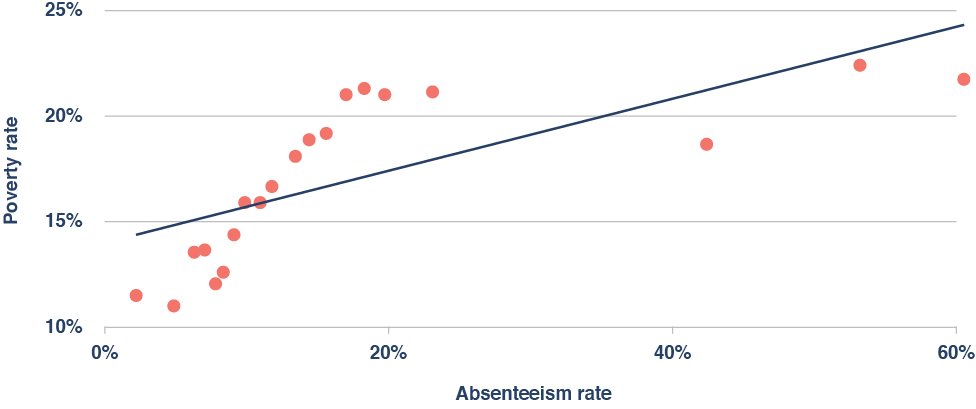
On average, high schools that serve large proportions of low-income students have much higher absenteeism and chronic-absenteeism rates than those that serve more affluent students (Figure 1). And a similar pattern also emerges for other demographic characteristics, such as the percentage of students who are White, Black, or Hispanic (see Appendix B, Table B2 in the PDF).
Figure 1. On average, high-poverty schools have much higher rates of absenteeism.
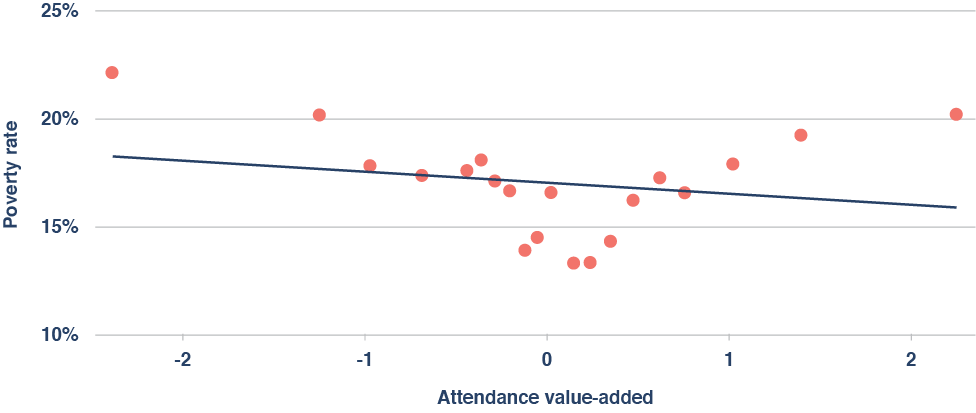
In contrast, because “attendance value-added” takes students’ demographic characteristics and attendance histories into account, it isn’t significantly correlated with a school’s poverty rate (Figure 2), nor is it significantly correlated with most other demographic characteristics of high schools (see Appendix B, Table B2 in the PDF).
Figure 2. There is no significant relationship between a school’s poverty rate and its attendance value-added.
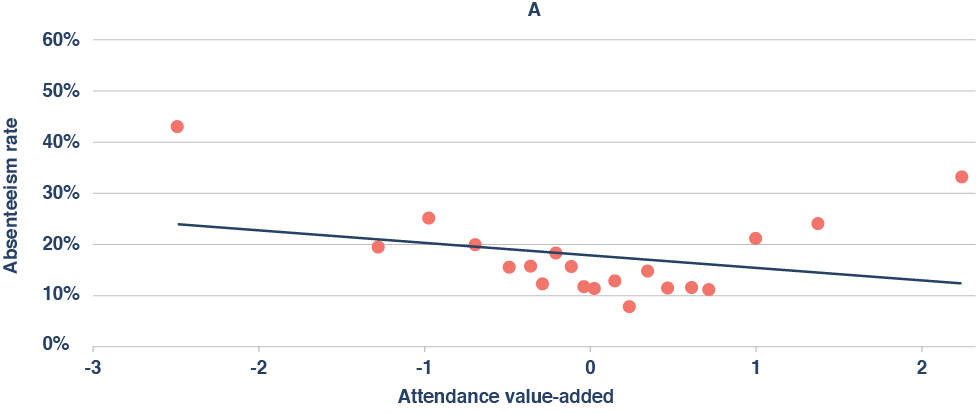
Finally, the correlation between a school’s attendance value-added and its overall absenteeism rate is quite small, as is the correlation between a school’s attendance value-added and its chronic-absenteeism rate (Figure 3A-B).
Figure 3A-B. Conventional absenteeism measures tell us almost nothing about a school’s effects on attendance.
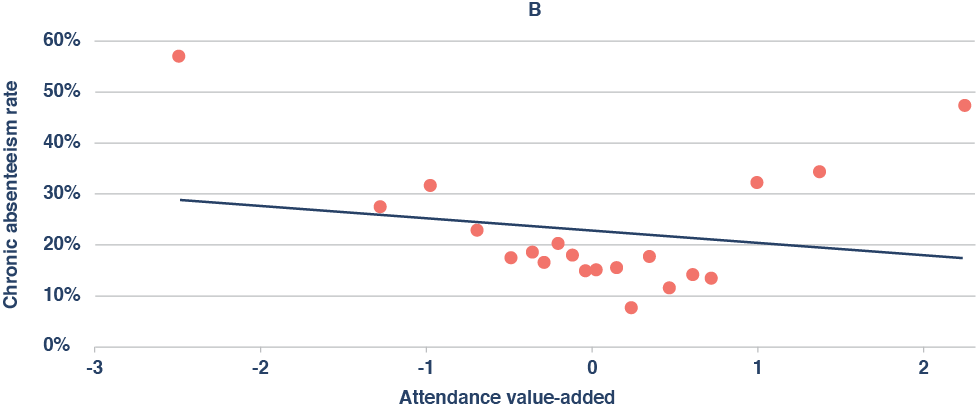
p= 0.098
In other words, conventional absenteeism measures tell policymakers almost nothing about a high school’s effect on attendance. So if the goal is to hold schools accountable for things that are under their control, these measures are both uninformative and unfair to high-poverty schools—just like raw proficiency rates and other test-based measures that fail to capture a school’s value-added.
Finding 2: Like test-based value-added, attendance value-added varies widely between schools and is highly stable over time.
On average, attending a high school with high attendance value-added increases a student’s attendance by twenty-eight class periods (or roughly four school days) per year (Figure 4). Relative to the variation in attendance and achievement that is observed at the student level, the magnitude of this effect is somewhat larger than the magnitude of an above-average school’s effect on its students’ ELA and math test scores.
Figure 4. Attending a high school with high attendance value-added significantly reduces the average student’s absenteeism rate.
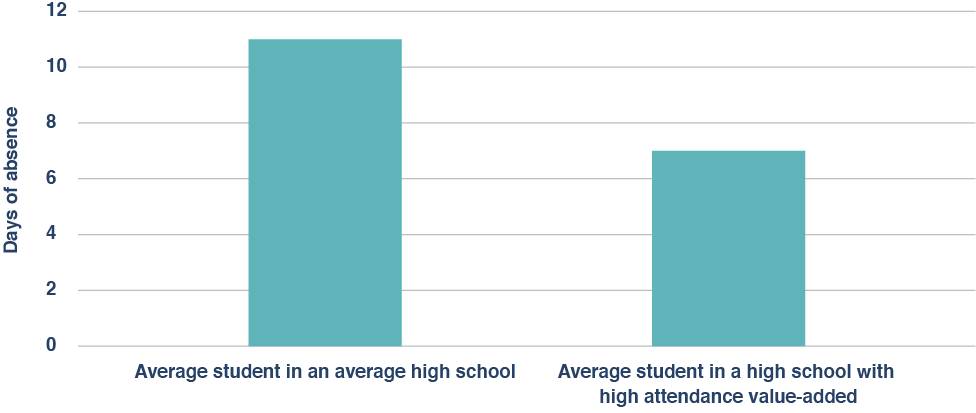
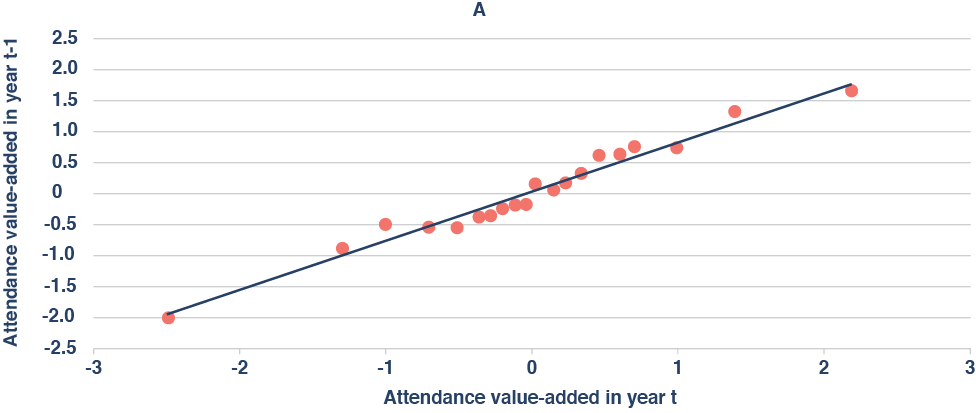
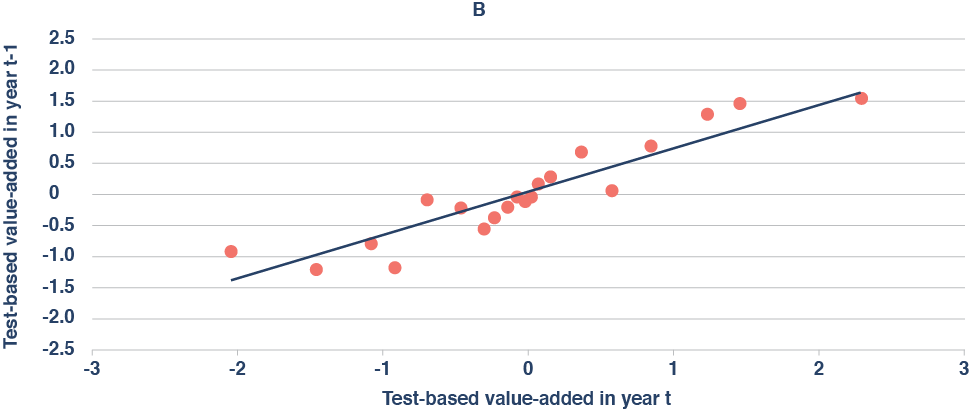
Similarly, the average correlation between a school’s attendance value-added in one year and its attendance value-added in the following year is 0.878, while the year-to-year correlation for test-based value-added is 0.774. In other words, attendance value-added is actually more stable than test-based value-added (Figure 5A-B).
Figure 5A-B. Attendance value-added exhibits even greater year-to-year stability than test-based value-added.
Finding 3: There is suggestive evidence that attendance value-added and test-based value-added capture different dimensions of school quality.
Perhaps surprisingly, attendance value-added is weakly correlated with test-based value-added at the school level (Figure 6). Moreover, each of these measures is only predictive over its own domain: that is, attendance value-added offers no additional information about a school’s impact on student achievement conditional on test-based value-added, and test-based value-added offers no additional information about a school’s impact on attendance conditional on attendance value-added (see Appendix, Table B4 in the PDF).
Figure 6. Attendance value-added is weakly correlated with test-based value-added.
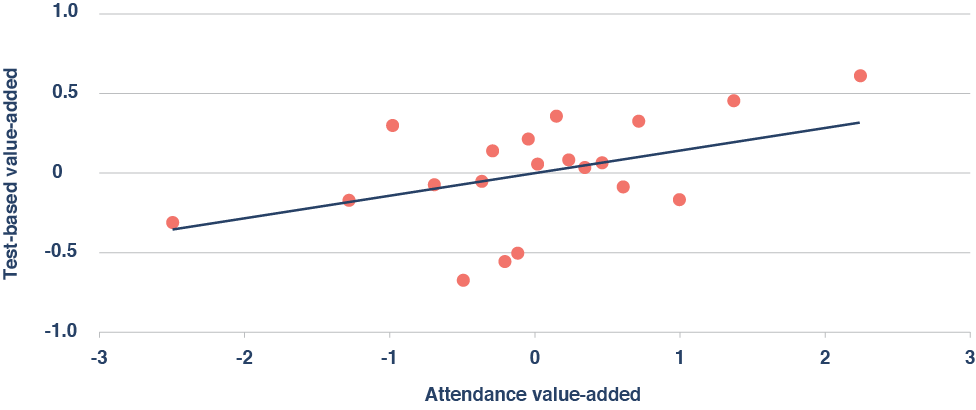
p= 0.026
In addition to this disconnect, there is also suggestive evidence that high schools with above-average attendance value-added boost postsecondary enrollment—even if their test-based value-added is average (Figure 7). For example, there is suggestive evidence that attending a high school with high attendance value-added increases a ninth grader’s probability of attending a four-year college by 1.7 percentage points (for context, attending a high school with high test-based value-added but average attendance value-added boosts four-year college attendance by 2.2 percentage points).
Figure 7. Evidence suggests that attending a high school with high attendance value-added boosts postsecondary enrollment.
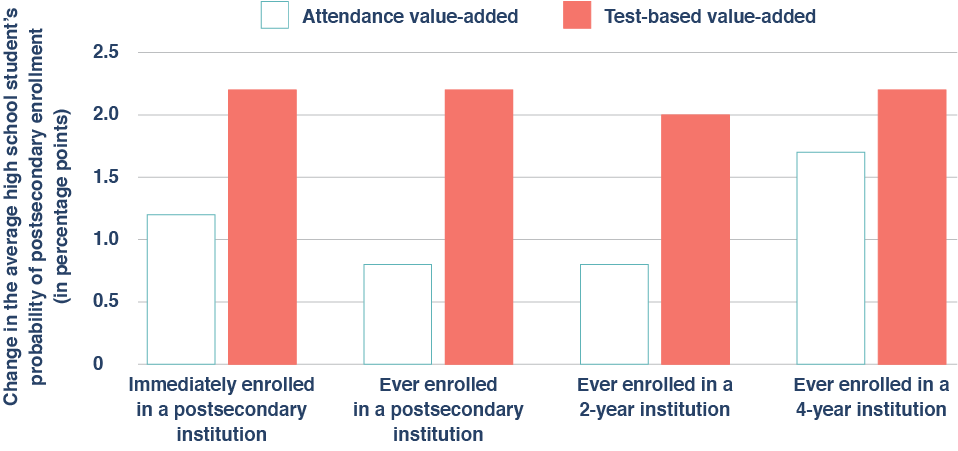
Collectively, these results suggest that attendance value-added captures some dimensions of school quality that are not captured by test-based value-added; however, additional research (with larger samples) is needed to clarify this point and to establish more conclusively that attendance value-added significantly predicts long-term outcomes.
Finding 4: Attendance value-added is positively correlated with students’ perceptions of school climate—and, in particular, with the belief that school is safe and behavioral expectations are clear.
Of the five aspects of school climate that are included in the district’s school-climate survey, attendance value-added is most strongly correlated with the sense of safety that students feel at school and the clarity of rules and expectations related to student behavior—though it’s also significantly correlated with students’ sense of belonging, their perceptions of academic support, and their belief that student-adult relationships are respectful. In contrast, neither test-based value-added nor a school’s raw absenteeism rate (i.e., the total number of classes missed by the average student) is significantly correlated with any of the five constructs reported by students (Figure 8).
Figure 8. Unlike test-based value-added and raw attendance, attendance value-added is significantly correlated with several dimensions of school climate.
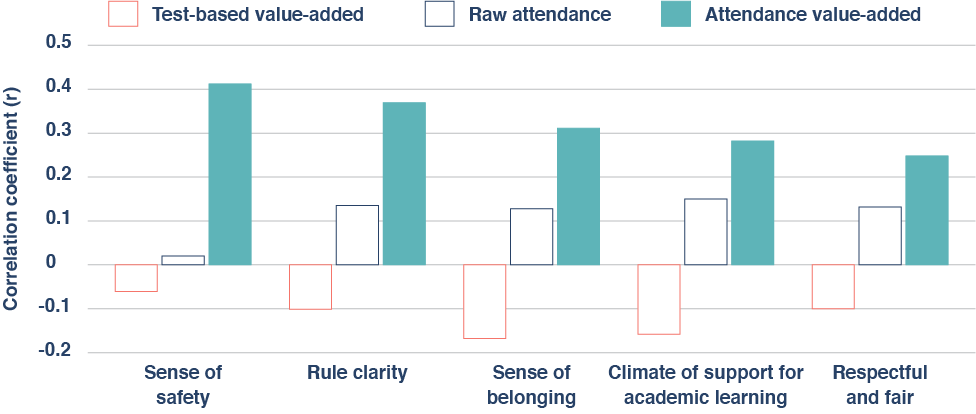
At a more granular level, attendance value-added has meaningful correlations with several individual survey items touching on various aspects of school climate, including the perception that “teachers give students a chance to take part in classroom discussions” and that “the teachers at this school treat students fairly”; however, the single item that correlates most strongly to attendance value-added is, again, students’ feelings of safety (Figure 9).
Figure 9. Attendance value-added is significantly correlated with a diverse collection of individual survey items.
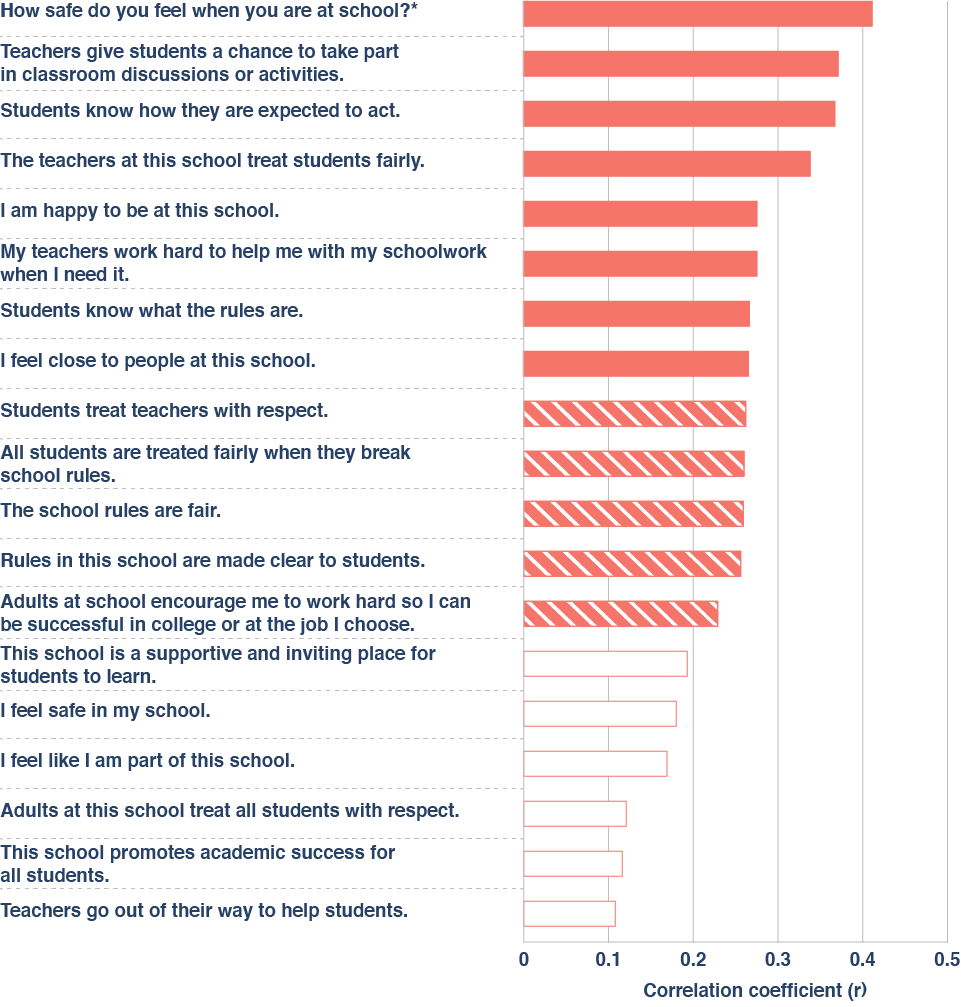
* All item responses map to a Likert scale that ranges from strongly disagree to strongly agree, except for the first item, which has a Likert scale that ranges from very unsafe to very safe.
Implications
1. Using raw student-absenteeism measures in accountability systems likely imparts credit or penalty to schools that don’t deserve it.
As the findings make clear, some schools do a better job of getting students to come to class regularly. Yet many of these schools are overlooked by states’ existing accountability systems—even as others are rewarded for habits and circumstances that students developed before their arrival. To be clear, there are good reasons to report schools’ raw attendance and chronic-absenteeism rates, which are transparent, parent-friendly, and crucial to understanding the depth of the problem. But if the goal is to hold schools or educators accountable for things they can control or help parents understand if their child’s attendance is likely to improve, then raw attendance rates are unfair and uninformative (and the same is also true of any non-test-based indicator that fails to account for the things students bring to school).
2. States and districts with the requisite resources should explore “attendance value-added” measures to better understand schools’ and teachers’ effects on attendance.
Per the findings, there is suggestive evidence that students see long-term benefits from attending high schools with high attendance value-added, even if their raw attendance rates, test scores, and test-based value-added are average. Broadly speaking, this evidence is consistent with an emerging literature that suggests that effective schools contribute to students’ success through the cultivation of noncognitive and/or socioemotional as well as academic skills.[18] Accordingly, states and other jurisdictions should consider developing their own measures of attendance value-added. That will, of course, entail the collection of precise and detailed attendance data while minimizing the potential for gaming and misreporting.
3. Schools and districts that are seeking to boost their attendance rates in the wake of the pandemic should remember that many students prioritize safety and order.
It is notable that the strongest correlates of “attendance value-added” at the high school level are students’ feelings of safety and order—or, more specifically, their sense that rules and behavioral expectations are clear—consistent with prior research on school climate[19] (for example, 7 percent of Black teens report avoiding school activities or classes because of “fear of attack or harm”).[20] Meanwhile, surveys of educators suggest that student absences have doubled as a result of remote learning and have remained elevated, along with various forms of misbehavior—even as students have returned to in-person instruction.[21] As they continue to do so, policymakers and educators must continue to focus on reengaging students, ensuring that school is a safe place, and combating the sadly rejuvenated scourge of chronic absenteeism. Left unaddressed, its implications for American youth and society are troubling indeed.
***To read the appendices, click “DOWNLOAD PDF”.***
Endnotes
[1] Jennifer Darling-Aduana, et al., “Learning-Mode Choice, Student Engagement, and Achievement Growth During the COVID-19 Pandemic,” EdWorkingPaper No. 22-536, Annenberg Institute for School Reform at Brown University, https://www.edworkingpapers.com/sites/default/files/ai22-536.pdf
[2] U.S. Department of Education, “Supporting Students During the COVID-19 Pandemic: Maximizing In-Person Learning and Implementing Effective Practices for Students in Quarantine and Isolation,” accessed March 8, 2022, https://www.ed.gov/coronavirus/supporting-students-during-covid-19-pandemic; Lucrecia Santibanez and Cassandra Guarino, “The Effects of Absenteeism on Cognitive and Social-Emotional Outcomes: Lessons for COVID-19,” EdWorkingPaper No. 20-261, Annenberg Institute for School Reform at Brown University, October 1, 2020, https://edworkingpapers.com/sites/default/files/Annenberg%20WP%20Submission%20-%2020201001_0.pdf; Carl Smith, “Chronic Absenteeism Is a Huge School Problem. Can Data Help?” Governing: The Future of States and Localities, May 20, 2021, https://www.governing.com/now/chronic-absenteeism-is-a-huge-school-problem-can-data-help; and Scott Calvert and Ben Chapman, “Schools See Big Drop in Attendance as Students Stay Away, Citing Covid-19,” Wall Street Journal, January 12, 2022, https://www.wsj.com/articles/schools-see-big-drop-in-attendance-as-students-stay-away-citing-covid-19-11641988802.
[3] Matt Barnum, “Schools are back in person, but quarantines, health concerns have students missing more class,” Chalkbeat, December 1, 2021, https://www.chalkbeat.org/2021/12/1/22811872/school-attendance-covid-quarantines.
[4] Sherri Doughty et al., K-12 Education: An Estimated 1.1 Million Teachers Nationwide Had At Least One Student Who Never Showed Up for Class in the 2020-21 School Year (Washington, D.C.: U.S. Government Accountability Office, March 23, 2022), https://www.gao.gov/assets/gao-22-104581.pdf; Ted Oberg and Sarah Rafique, “‘Daunting task’ to locate students as thousands are still missing from Houston-area schools,” Ted Oberg Investigates, ABC 13 Eyewitness News, August 12, 2021, https://abc13.com/students-missing-unenrolled-houston-isd-enrollment-drop/10945181; Tareena Musaddiq et al., “The Pandemic’s Effect on Demand for Public Schools, Homeschooling, and Private Schools,” Working Paper 2021 (Ann Arbor, MI: Education Policy Initiative; Boston, MA: Wheelock Education Policy Center, September 2021) https://edpolicy.umich.edu/sites/epi/files/2021-09/Pandemics%20Effect%20Demand%20Public%20Schools%20Working%20Paper%20Final%20%281%29.pdf.
[5] Hedy N. Chang and Mariajosé Romero, Present, Engaged, and Accounted For: The Critical Importance of Addressing Chronic Absence in the Early Grades (New York, NY: National Center for Children in Poverty, September 2008), http://www.nccp.org/wp-content/uploads/2008/09/text_837.pdf.
[6] Camille R. Whitney and Jing Liu, “What We’re Missing: A Descriptive Analysis of Part-Day Absenteeism in Secondary School,” AERA Open 3, no. 2 (2017): 1–17, doi:10.1177/2332858417703660.
[7] Chester E. Finn, Jr., and Chad L. Aldis, “Disputing Mike and Aaron on ESSA school ratings,” Flypaper, Thomas B. Fordham Institute, October 17, 2016, https://fordhaminstitute.org/national/commentary/disputing-mike-and-aaron-essa-school-ratings.
[8] Attendance Works, “National Analysis Shows Students Experiencing Chronic Absence Prior to Pandemic Likely to be Among the Hardest Hit by Learning Loss,” news release, February 2, 2021, https://www.attendanceworks.org/wp-content/uploads/2019/06/Attendance_Works_OCR_17-18_Press_Release_020121.pdf.
[9] Jing Liu, Monica Lee, and Seth Gershenson, “The short-and long-run impacts of secondary school absences,” Journal of Public Economics 199 (2021): 104441, doi:10.1016/j.jpubeco.2021.104441.
[10] Jing Liu and Susanna Loeb, “Engaging teachers: Measuring the impact of teachers on student attendance in secondary school,” Journal of Human Resources 56, no. 2 (2019): 343–79, doi:10.3368/jhr.56.2.1216-8430R3.
[11] Michael A.Gottfried and Ethan L. Hutt, eds., Absent from School: Understanding and Addressing Student Absenteeism (Cambridge, MA: Harvard Education Press, 2019).
[12] C. Kirabo Jackson, et al., “School effects on socioemotional development, school-based arrests, and educational attainment,” American Economic Review: Insights 2, no. 4 (2020): 491–508.
[13] Camille R. Whitney and Jing Liu, “What we’re missing: A descriptive analysis of part-day absenteeism in secondary school,” AERA Open 3, no. 2 (2017): 2332858417703660, doi:10.1177/2332858417703660.
[14] At the suggestion of district leaders, we exclude data from 2013–14, when the district’s transition to a new attendance-tracking system caused some data-quality issues.
[15] Before the school year 2013–14, teachers used a paper scantron to mark a student as absent, tardy, or present in each class; however, starting in 2014–15, the district transitioned to an electronic system called Synergy in which teachers use an electronic tablet to track each student’s class-attendance information in real time. Conversations with several district leaders suggest that data quality in the transition year (2014–15) was low due to the rolling out of the new system. Accordingly, that school year is omitted when estimating school value-added to attendance.
[16] To ensure that each school in the sample has enough observations for both cross-sectional and longitudinal analysis, schools that have fewer than five years of data, and school years that have fewer than ten students are dropped.
[17] Because they serve a very different population of students, the special-education schools in the district are not included in the analysis.
[18] Jackson, “School effects on socioemotional development.”
[19] Susan Williams, et al., “Student’s perceptions of school safety: It is not just about being bullied,” The Journal of School Nursing 34, no. 4 (2018): 319–30, doi:10.1177/1059840518761792.
[20] “Students’ reports of avoiding school activities or classes or specific places in schools,” National Center for Education Statistics, accessed February 19, 2022, https://nces.ed.gov/programs/coe/indicator/a17.
[21] Mark Lieberman, “5 things you need to know about student absences during COVID-19,” Education Week, October 16, 2020, https://www.edweek.org/leadership/5-things-you-need-to-know-about-student-absences-during-covid-19/2020/10.
About this study
This report was made possible through the generous support of the Chan Zuckerberg Initiative, as well as our sister organization, the Thomas B. Fordham Foundation. We are deeply grateful to external reviewers Cory Koedel, professor of economics and public policy at the University of Missouri, and Douglas Harris, professor of economics at Tulane University, for offering feedback on the methodology and draft report.
On the Fordham side, we express gratitude to associate director of research, David Griffith, for managing the study, asking probing questions, and editing the report. Thanks also to Chester E. Finn, Jr. for providing feedback on drafts, Pedro Enamorado for managing report production and design, Victoria McDougald for overseeing media dissemination, and Will Rost for handling funder communications. Finally, kudos to Pamela Tatz for copyediting and Dave Williams for creating the report’s figures.
Cover Photo: smolaw11/iStock/Getty Images Plus
