NOTE: On September 14, 2018, Chad Aldis was invited to provide testimony to the Ohio Advisory Committee to the U.S. Commission on Civil Rights. The meeting, held in Cleveland, examined civil rights as it relates to education funding in Ohio. The big question in front of the committee was “whether the state’s school funding system contributes to a disparate impact on educational outcomes for student groups protected under federal law.” The following is a summary of Chad’s remarks compiled from his notes.
The Thomas B. Fordham Institute’s long-term focus on school quality and student achievement makes us very appreciative of the work of this advisory committee. Any aspect of the education system that could be contributing to the racial achievement gap must be identified and corrected.
Today, I’ll provide information in a variety of areas that are likely to be relevant to the analysis this committee will conduct, including student achievement, funding data, the relationship between funding and academic achievement, and data related to charter schools. Finally, I’ll identify a few areas where Ohio can improve its funding system and offer a few final thoughts.
Achievement gap data
Using data from the 2016–17 school year, compiled by the Ohio Department of Education, the following figures reflect student achievement by race and ethnicity.
Figure 1, focused on elementary grades, shows a pronounced achievement gap in fourth grade by race/ethnicity in both math and English language arts. White students (in blue) achieve proficiency at a much higher rate than both Hispanic students (in orange) and black students (in green).
Figure 1: Fourth grade state exams proficiency by selected race/ethnic subgroups, 2016–17
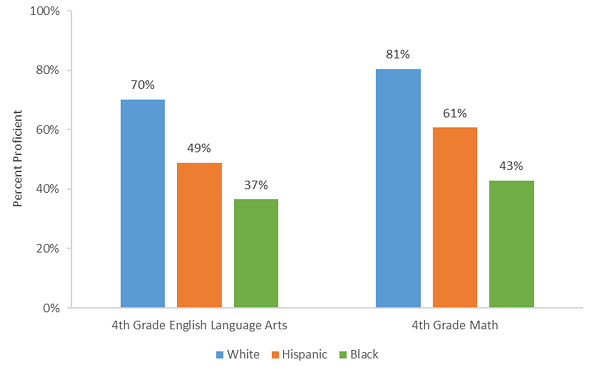
Figure 2 shows the same data for eighth grade, giving us a look at middle school. The only change, depressingly, is that the proficiency level goes down for all students in both subjects. The gaps, however, remain largely unchanged.
Figure 2: Eighth grade state exams proficiency by selected race/ethnic subgroups, 2016-17
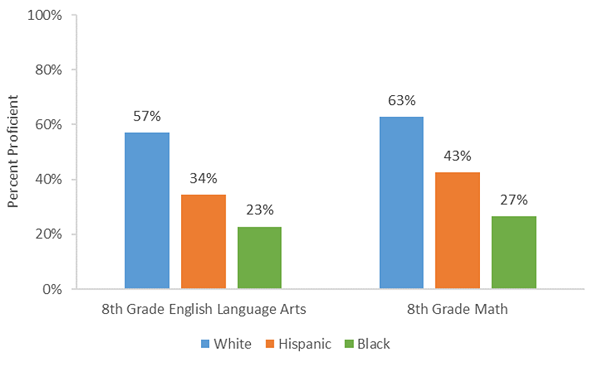
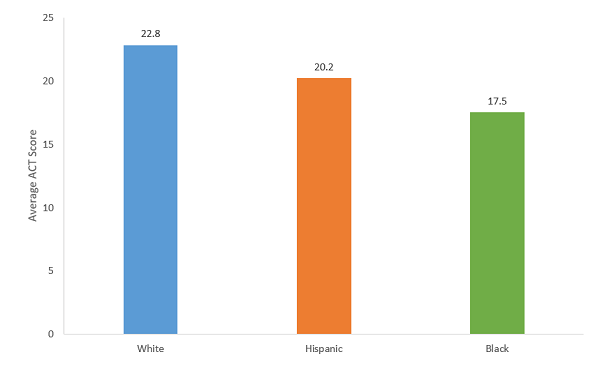
Figure 3 looks at high school achievement. Specifically, average composite scores on the ACT for the Class of 2017. Even in high school, the sizable achievement gap remains.
Figure 3: ACT composite scores by selected race/ethnic subgroups Ohio’s class of 2017
Source: ACT profile report for Ohio.
Just for context, in past years, roughly two in three students in Ohio took the ACT. Starting with the Class of 2018, all public school students are required to take either the ACT or SAT, including those who are not planning to attend college. Given the increased number of students taking the exam, this is likely to reduce scores across all subgroups.
While the focus is on Ohio students, we also thought it would be worth knowing whether similar achievement gaps were present across the nation. As Figures 4 and 5 show, the Ohio achievement gap in eighth grade on the NAEP assessment (often called the Nation’s Report Card) is similar to the national gap. Ohio has a slightly narrower achievement gap than the nation between white and Hispanic students and slightly wider between white and black students.
Figure 4: Eighth grade NAEP reading scores Ohio and national averages by selected race/ethnic subgroups, 2017
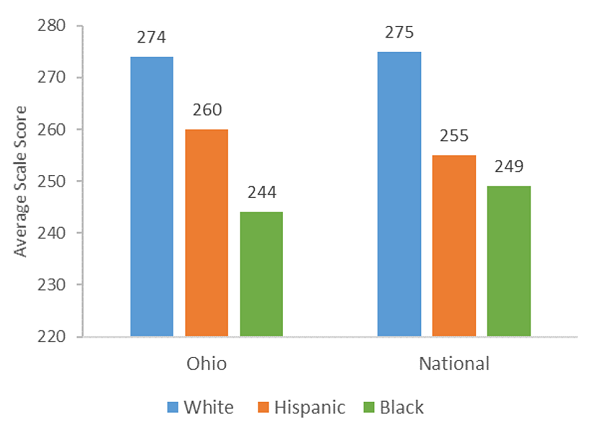
Figure 5: Eighth grade NAEP math scores Ohio and national averages by selected race/ethnic subgroups, 2017
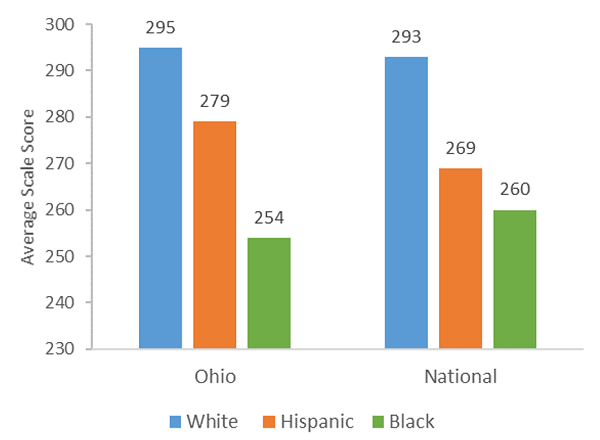
These data make it clear that the achievement gap problem isn’t limited to Ohio.
Funding
Having established that there is a difference in educational outcomes by race, I’ll shift my focus to school funding data. It is important to note that the expenditures in the following figures are operational expenses—things like instruction, support services, and books. It excludes such things as construction, interest, and land. Districts spend on average about $1,500 per pupil on non-operational expenses. And Ohio’s statewide average for FY 2017 is $11,603 per pupil. Importantly, the expenditures analyzed here include federal dollars, which are often targeted to low-income and minority students.
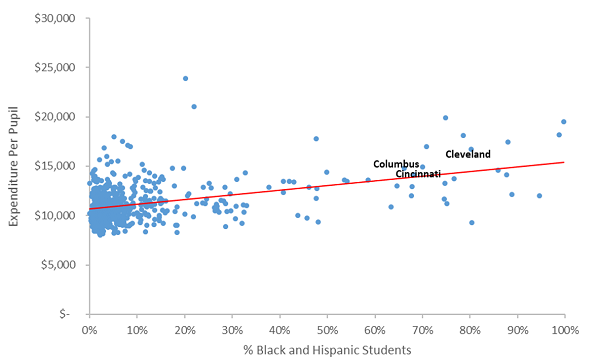
The scatterplot in Figure 6 shows the expenditure per pupil by district (each blue dot represents a district) compared to the percent of black and Hispanic students in that district.
Figure 6: Operating expenditures per pupil versus black and Hispanic enrollment Ohio school districts FY 2017
Source: ODE, District Profile (Cupp) Reports (FY 2017).
As you can see by the cluster of blue dots on the left side of the chart, a large majority of Ohio districts enroll less than 10 percent black and Hispanic students. Per-pupil funding in these districts varies widely, with most spending between $9,000 and $15,000.
Overall, the trend line is slightly upwards. This means that as the percent of black and Hispanic students in the district increases, so does the per-pupil funding.
Figure 7 shows the same data in a slightly different way. Here, districts are split into five equal enrollment groups (quintiles) based on their percentage of black and Hispanic students. Scatter plots are nice, but they don’t tell the entire story because each point is treated as if each district were the same size. The bar chart helps show that the large urban districts, because of the large number of black and Hispanic students they serve and their relatively high per-pupil spending, increase the average expenditures.
Figure 7: Operating expenditures per pupil versus black and Hispanic enrollment by quintiles of Ohio school districts FY 2017
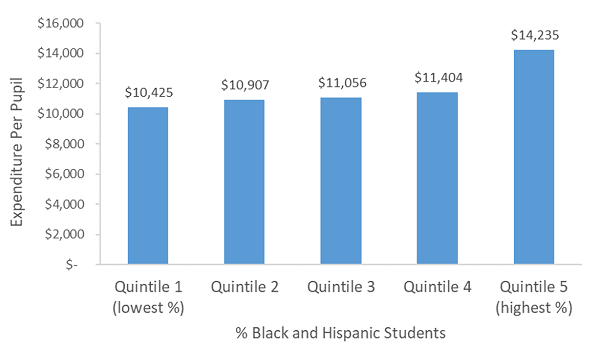
In fact, districts with the highest percentage of black and Hispanic students spent on average $14,235 per pupil, while districts with the lowest percentage of black and Hispanic students spent $10,425.
It is worth noting that Quintile 5 represents districts that have 32 percent or more black and Hispanic students.
As this chart shows, Ohio’s funding system drives significantly more dollars to districts with higher numbers of those students.
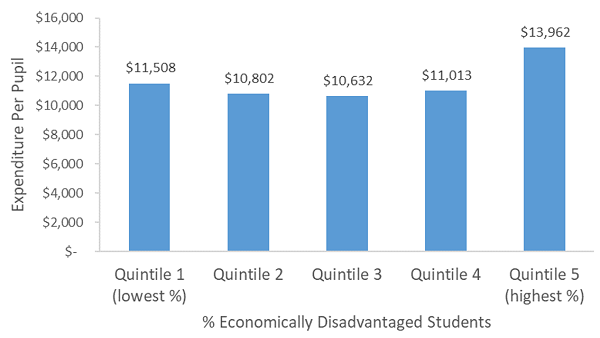
Figures 8 and 9 offer a similar analysis but for economically disadvantaged (ED) students. Figure 8 places the percentage of ED students on the horizontal axis instead of black and Hispanic students. The trend line is more or less flat. You will notice the number of districts between 30 and 50 percent ED below the trend line. These are mainly rural, lower spending districts. Districts at the far left and right sides of the chart (very low-poverty and very high-poverty, respectively) tend to spend more than those in the middle.
Figure 8: Operating expenditures per pupil versus economically disadvantaged enrollment in Ohio school districts FY 2017
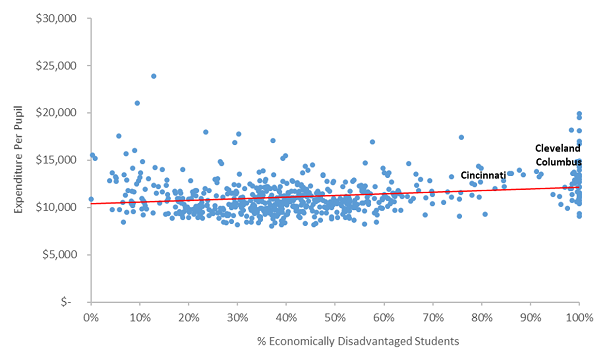
The cluster near 100 percent is due in large part to the Community Eligibility Program (CEP) that allows districts with high poverty to declare every student to be low-income—primarily for school lunch purposes.
Figure 9 shows that districts with a high percentage of economically disadvantaged students spend more than others.
Figure 9: Operating expenditures per pupil versus economically disadvantaged enrollment by quintiles of Ohio school districts FY 2017
Figures 1 through 9 make it clear that black and Hispanic students in Ohio have lower academic achievement, on average, than their white peers. But in terms of funding, the picture is more nuanced. Although black and Hispanic students can benefit from additional supports, they already tend to be in districts with higher per-pupil funding amounts. This is not to say that black and Hispanic students receive “enough” funding, just that they receive more. There still is very much a lack of consensus on what constitutes “enough” when it comes to school funding, and whether spending more would help Ohio’s schools get better results.
To start to get at these questions, Figure 10 compares academic achievement versus a district’s per-pupil expenditure. The achievement measure used on the vertical axis is Ohio’s performance index (PI). PI is a weighted measure of student proficiency on state test scores, calculated by ODE, and scores can range from 0 to 120. Per-pupil spending is on the horizontal axis.
Figure 10: Student achievement versus operating expenditure per pupil expenditures for Ohio school districts FY 2017
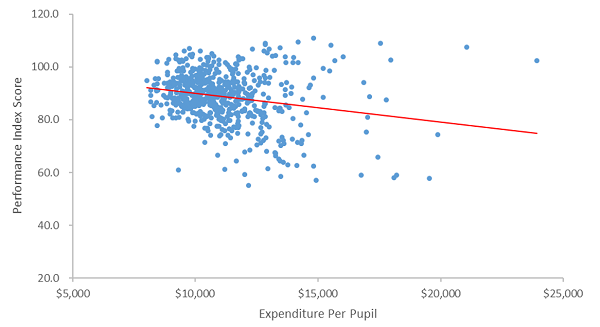
This comparison attempts to illustrate the relationship—if there is any—between spending and academic achievement in Ohio. A common theory suggests that if the achievement gap is caused by a lack of adequate funding, these data might provide some evidence of that. If more spending indeed results in higher academic achievement, we would expect to see an upward trendline. But in Figure 10 we see that the line is actually slightly downward sloping. This doesn’t necessarily imply that more money causes lower achievement, but it does suggest that there isn’t a clear and obvious correlation between spending amounts and achievement levels.
Of course, the pattern in Figure 10 might be driven mostly by student demographics. Since we have already illustrated that districts with higher proportions of students of color, and low-income students, tend to spend more than others, it is possible that the negative relationship is driven by students’ background characteristics rather than funding per se.
Figure 11 repeats the previous one but highlights—using orange circles—districts whose black and Hispanic student populations comprise 50 percent or more of its total enrollment. Now we can control for student demographics and look at the spending versus achievement relationship more directly.
Figure 11: Student achievement versus operating expenditure for Ohio districts serving 50 percent or more black and Hispanic students FY 2017
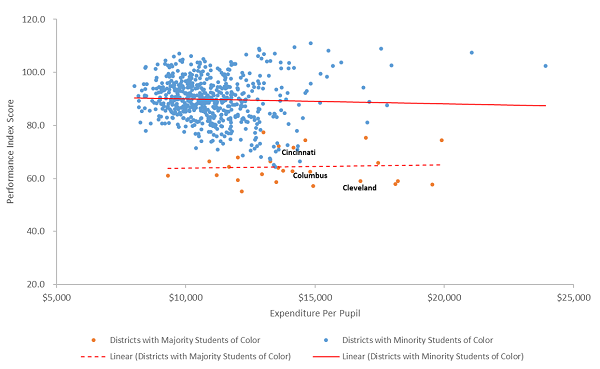
The chart not only shows a graphic representation of the achievement gap—notice how the student achievement trend line is shifted lower—but it also demonstrates that the trend lines are flat for all districts. This indicates that student achievement doesn’t appear to increase in either cohort as per pupil funding increases.
Charter schools
Ohio’s robust charter school sector serves many black and Hispanic students, so its expenditure data is also relevant.
Figure 12 plots per-pupil expenditures in charter schools versus their percent of black and Hispanic enrollment. The data clearly show that most charters serve a majority of black and Hispanic students. These data are from ODE’s Advanced Reports, and mirror the district operational expenses used in previous charts.
Figure 12: Operating expenditure versus black and Hispanic enrollment for Ohio public charter schools FY 2017
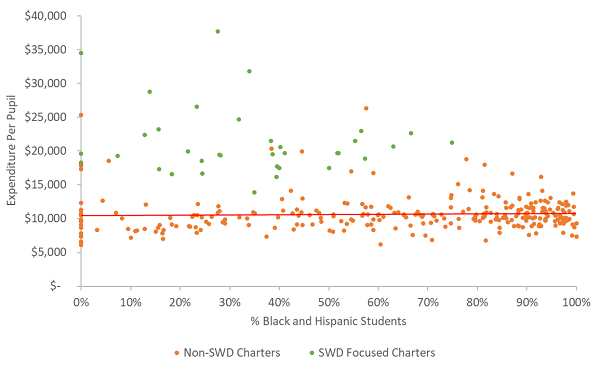
Distressingly, there is no clear relationship between spending and percentage of black and Hispanic enrollment in charters, which is far different than what we found in our earlier analysis of traditional public school districts.
Finally, note the green dots. These are schools where more than 50 percent of pupils are students with disabilities. Schools such as these that focus on educating students with special needs are recognized as a distinct group under state law. As you’d expect, per-pupil funding is rightly much higher in these schools.
Figure 13 adds districts (blue dots) to the scatterplot of charters (orange dots) and charters that specialize in students with disabilities (green dots).
Figure 13: Operating expenditure versus black and Hispanic enrollment for Ohio districts and public charter schools FY 2017
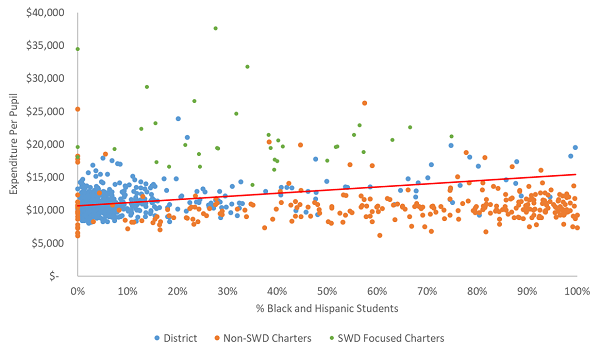
As you can see, charters are more likely to be in the bottom right part of the graph, indicating that they educate predominately black and Hispanic students but do not receive increased funding as a result.
Figure 14 converts the scatterplot into a bar chart. In this case, it compares charter funding statewide, charter funding in the eight largest urban districts in Ohio, and funding in several specific urban districts. For context, the percentages of black and Hispanic students are displayed in parentheses under each bar.
Figure 14: Expenditures per pupil for Ohio charter schools and districts FY 17 (percentage of black and Hispanic students in parentheses)
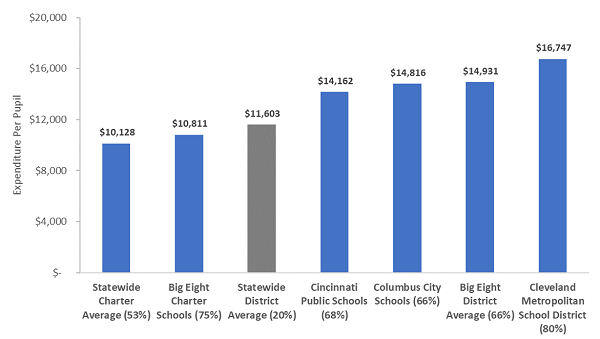
A couple of notes on the comparison in Figure 14:
- All Big Eight charters are brick-and-mortar
- Statewide charter average includes both online and brick-and-mortar
This analysis reveals a fairly significant gap in expenditures between charter and district schools serving similar students. Note that Big Eight charter schools spend less than districts statewide but enroll a much higher percentage of black and Hispanic students—75 percent to 20 percent.
Areas for improvement
There are some definite areas where we believe that Ohio’s school funding system could be improved to better serve all students, including minority pupils:
- Shift from providing a funding boost to students based on their free-or-reduced-price-lunch status to basing it on direct certification—a truer measure of poverty and student need that would drive more resources to the most disadvantaged students.
- Eliminate funding caps. Columbus and Dayton school districts lost $100 million and $10 million, respectively, as a result of caps. If you have a formula, fund the formula.
- Ensure charters receive funding that’s more on par with the districts whose students they serve.
Final thoughts
Achievement gaps between black and Hispanic students and their white peers are demonstrably real, and it’s imperative that we continue to find ways to increase minority achievement, whether through increased funding or some other means.
Spending among districts serving primarily black and Hispanic students is higher than most other districts. We should exercise caution when making school funding comparisons because many proponents of additional per-pupil funding cite a handful of small, high wealth suburban districts that outspend Ohio’s big-city districts. For example, Orange City School District in Cuyahoga County spends $24,000 per pupil. Beachwood City Schools, also in Cuyahoga County, spends $21,000 per pupil. And Indian Hill Exempted Village Schools in suburban Cincinnati spends $18,000 per pupil. They are largely outliers, and there is no reason to think they should be the floor for comparison purposes.
And finally, public charter schools are serving a large percentage of Ohio’s black and Hispanic students. Yet they are significantly underfunded relative to similar districts.
I appreciate the opportunity to provide testimony to you today and commend you for digging into this very important issue.


