As ESEA reauthorization heads to conference committee, debate is certain to center on whether federal law should require states to intervene if certain subgroups are falling behind in otherwise satisfactory schools. Civil rights groups tend to favor mandatory intervention. Conservatives (and the teachers’ unions) want states to decide how to craft their school ratings systems, and when and how to take action if schools don’t measure up. The Obama administration is siding with the civil rights groups; a recent White House release, clearly timed to influence the ESEA debate, notes that we “know that disadvantaged students often fall behind in higher-performing schools.”
But in how many cases do otherwise adequate schools leave their neediest students behind? Are there enough schools of this variety to justify a federal mandate? Fortunately, we have data—and the data show this type of school to be virtually nonexistent.
In a recent post, I looked at school-level results from Fordham’s home state of Ohio. That analysis uncovered very few high-performing schools in which low-achieving students made weak gains. (“Low-achieving” is defined as the lowest-performing fifth of students statewide.) Just seven schools (in a universe of more than 2,300) clearly performed well as a whole while allowing their low-achievers to lag far behind.
But perhaps Ohio’s data are an anomaly. Or maybe the low-achieving subgroup results don’t tell the full story. (Ohio doesn’t break out growth results by race or by economic disadvantage.) So I looked for another state that disaggregates student growth results by subgroup.
Surprisingly, twenty-three states do so—an impressive number that demonstrates the improvements states are making in school accountability systems. Colorado is one such state, and it has an extensive but navigable reporting system. It also disaggregates results for seven different student subgroups—the most we observed in our fifty-state review. Colorado employs the Student Growth Percentiles (SGP) methodology to measure student growth. SGP utilizes longitudinal, individual student data and statistical methods to calculate learning growth over time, a similar but not an exact equivalent of Ohio’s value-added model.
When we look at the school-level results from Colorado, a story similar to Ohio’s emerges. Only a small number of highly rated schools, as measured by growth on state exams, appear to leave disadvantaged students far behind. In fact, just eleven schools—less than 1 percent of those rated—perform well overall, while also receiving the lowest rating for their Free or Reduced-Price Lunch (FRPL) students. Only four schools do well overall while receiving the lowest rating for their minority students.
Table 1: Number of schools receiving each combination of overall and subgroup growth ratings in reading, Colorado schools, 2013–14
(A) Overall versus FRPL student subgroup ratings

(B) Overall versus minority student subgroup ratings

Source: Colorado Department of Education
Notes: The numbers of schools included in Tables 1A and 1B are 1,810 and 1,753 respectively. Colorado has four rating categories, from lowest to highest: “does not meet,” “approaching,” “meets,” and “exceeds expectations.” The ratings are assigned based on a school’s median growth percentile scores and whether the school has made “adequate” growth; for more details on the school rating procedures, see this document. “Minority student” denotes any non-white student—the state does not decompose a school’s minority subgroup rating by specific race or ethnic group.
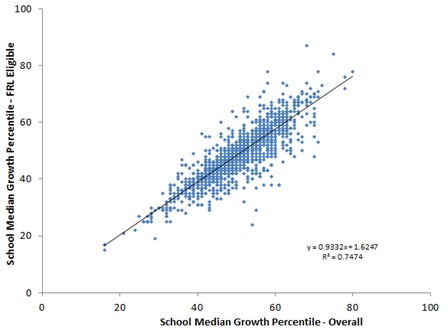
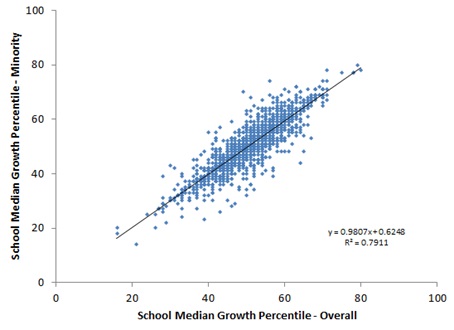
Consider also the charts below, which display the relationship between a school’s overall and subgroup growth scores in numeric terms. You’ll notice a remarkably strong correlation between overall and subgroup performance. (Of course, some schools have a large fraction of disadvantaged or minority students; for those schools, we’d expect a near-perfect correlation.)
Chart 2: Correlation between overall and subgroup growth scores in reading, Colorado schools, 2013–14
(A) Overall versus FRPL student growth scores

(B) Overall versus minority student growth scores

Source: Colorado Department of Education
Notes: A school’s median growth percentile is reported on a scale of 1–99, based on a three-year average; a higher value indicates that a group of students—either an entire school of students or a subgroup—is making relatively more progress than its peer group (e.g., a median value of 80 indicates that the group’s growth outpaced 80 percent of its peers); a lower value indicates that the group made less progress. See here for more information. The numbers of schools included in Charts 2A and 2B are 1,810 and 1,753, respectively (some schools receive an identical combination of values, so the actual number of points displayed doesn’t match the n-count). Elementary, middle, and high schools are included. Correlation coefficients are 0.86 and 0.89 for FRPL and minority subgroups, respectively. The correlations for math, not displayed, are not substantially different from the reading results (0.89 and 0.93 for FRPL and minority subgroups, respectively).
The evidence from Colorado and Ohio suggests this general principle: Good schools are usually good for needy children (and, conversely, bad schools are bad for them). The NCLB-era concern about schools’ averages masking poor subgroup performance goes away if we measure school effectiveness the right way—via student growth rather than proficiency rates.
Still, like Ohio, Colorado has a few outlier schools—those that perform well overall but poorly for disadvantaged groups. One Colorado school, for example, had an overall score of 54—slightly above-average progress for all students—but a score of 24 for its FRPL-eligible students. States are absolutely right to identify such outliers, and local educators, parents, and citizens should be alarmed about the discrepancy in results.
As federal lawmakers weigh intervention policy options, though, they should reflect on the evidence from Ohio and Colorado. The number of otherwise-satisfactory schools where disadvantaged students lag behind is vanishingly small. (So trivial is the number of such schools that the administration’s claim, cited above, that this occurs “often” should be called into question.) Should federal lawmakers create a nationwide, one-size-fits-all school intervention policy based on isolated cases? Not in my view; it would be like mandating hurricane drills in Kansas.
