School report cards arrived today. The good news is that Ohio has a waiver from No Child Left Behind’s (NCLB) “100 percent proficiency” mandate for 2013-14. Very few Ohio schools, I suspect, hit the 100 percent mark in math and reading in 2013-14. (A rough read of district and charter-school data, indicate that a couple high-achieving charters came close; for instance, in grades 3-8 Columbus Preparatory missed 100 percent proficiency in just fifth-grade reading. Menlo Park Academy, a charter for gifted students, came close too.)
A good first step to understanding state assessments is looking at student proficiency. Proficiency is a one-year snapshot of student performance, measured by state exams, not necessarily a clear indicator of the performance of their school per se. For a clearer understanding of the impact of a school on achievement, we’d want to look at student-growth measures, such as the state’s value-added data. (We’ll unpack the value-added results in more depth in the near future—so stay tuned.) But proficiency does give us a general sense of how students performed on state exams in 2013-14.
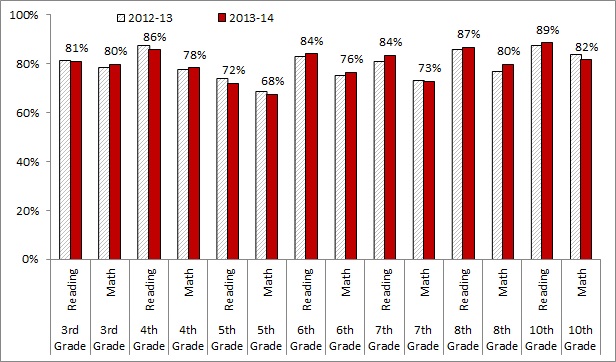
Statewide, around one-in-five students fell short of Ohio’s standard for proficiency, though there is some variation across grade and subject. (That variation could be a result of the mechanics behind the definition of "proficiency" across grades/subject, not necessairly a function of differences in actual achievement across grades.) Figure 1 shows the proficiency rates for grades 3-8 and 10 in math and reading. The chart displays the proficiency rates for 2013-14; meanwhile, the proficiency data from 2012-13 is displayed alongside for context (without the actual percentage). As you’ll notice, the year-over-year change in proficiency rates was pretty flat across math and reading in these grades. The largest jump was just 3 percentage points in seventh-grade reading and eighth-grade math. Recently, it seems that rumblings of a proficiency-rate fall would occur for the 2013-14 cycle of testing—perhaps due to changes in the test. However, that does not appear to be the case. (That being said, Ohio should buckle in for a fall in proficiency when the PARCC assessments arrive in 2014-15.)
Figure 1: Statewide proficiency rates, grades 3-8 and 10 math and reading - 2013-14
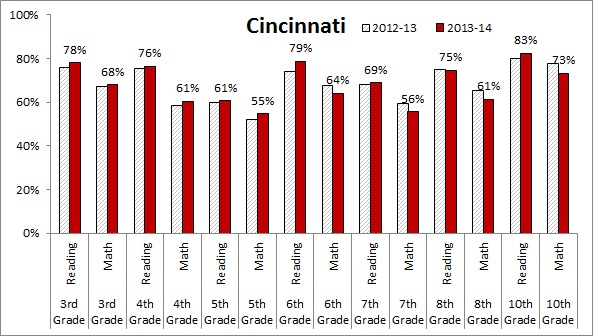
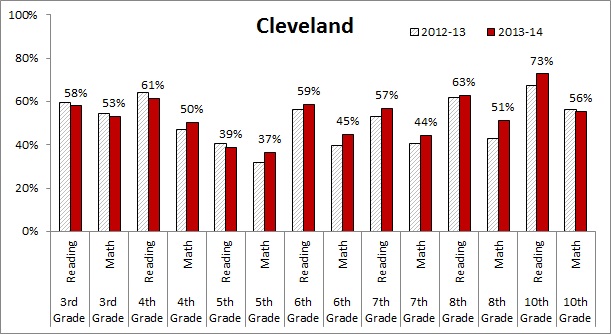
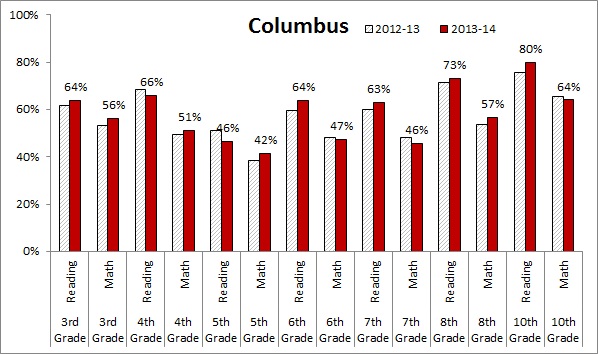
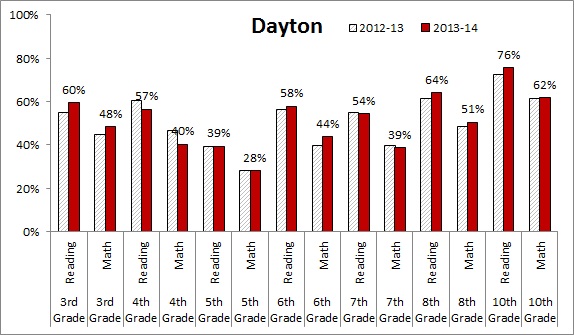
Meanwhile, proficiency remains dismal in Ohio’s urban communities. Figure 2 displays the proficiency rates for Cincinnati, Cleveland, Columbus, and Dayton (just the school district, not including charters)—and as we observe, the fraction of students who reach the state’s proficiency standard is very low in relation to the statewide expectation for a district’s proficiency rate, which is 80 percent. Large numbers of students in the state’s inner-cities continue to struggle with basic numeracy and literacy skills. Among Ohio’s big-city districts, Cincinnati’s students continue to lead the way while Cleveland and Dayton’s students tend to achieve at the lowest levels among this group. It is worth noting that middle-school students in Cleveland (grades 6-8) did show some small signs of improvement, at least in terms of year-over-year proficiency rate changes.
Ohio’s school report cards are an excellent way for parents and policymakers to begin to understand how schools and students are doing. And much is changing too, with the implementation of the Common Core and the PARCC assessments at hand. As we did last year, we at Fordham will parse the report-card data from 2013-14—and expect a full report on the performance of Ohio’s students and schools, looking at well beyond the somewhat rough “proficiency” measures.
Figure 2: Proficiency rates, grades 3-8 and 10 math and reading, selected city school districts - 2013-14
