Academic Distress Commissions (ADCs) have a long and controversial history in Ohio. They were first created in 2005 as a way for the state to intervene in districts that consistently failed to meet academic standards. The law was significantly strengthened in 2015, and was promptly met with immediate and fierce pushback from district advocates. By 2021, lawmakers had caved to political pressure and created an easy off-ramp for the three districts that were under ADC control: Youngstown, Lorain, and East Cleveland. This off-ramp was pitched as a compromise—control of the district would return to the local school board and its chosen superintendent, but in exchange, they would be tasked with developing academic improvement plans containing annual and overall improvement benchmarks. ADCs would be permanently dissolved if districts met a majority of these benchmarks by June 2025 (previously, districts had to achieve state-defined performance targets to exit).
Official implementation of these plans began during the 2022–23 school year. State report cards for that year—the report cards released earlier this month by the Ohio Department of Education—were meant to be the first check-in on how things were going under these new improvement plans. Thanks to the state budget enacted at the end of June, though, things are a little more complicated. That’s because the budget contained a tiny provision that dissolved Lorain’s ADC and its academic improvement plan. As a result, Lorain is no longer required to demonstrate that it’s improving on behalf of its students. Its counterparts in Youngstown and East Cleveland, however, didn’t benefit from the same carve out.
This tiny change sets up a hugely interesting comparison. This year’s state report cards are no longer a simple check-in. Now, they’re an opportunity to compare the district that state leaders deemed worthy of an academic free pass—Lorain—to the other two that weren’t quite so “lucky.” Below is an examination of each district’s results in four of the report card’s most significant areas: achievement, progress, early literacy, and chronic absenteeism.
Achievement
Achievement is the only test-based report card indicator that appeared on each of the three districts’ improvement plans. Specifically, the plans focus on performance index (PI) scores, which measure the state test results of every student and award districts points based on the state’s six achievement levels. The higher a student’s achievement, the more points the district earns. For example, a student who scores at the advanced level earns their district 1.2 points, while a student testing at the basic level (just below proficient) earns 0.6 points.
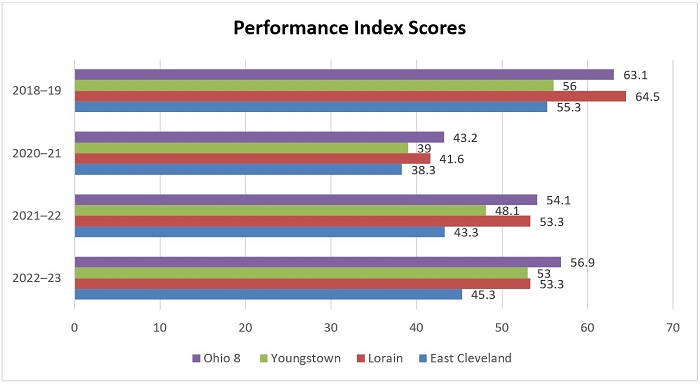
The chart below depicts performance index scores in ADC districts, with averages from the Ohio Eight urban districts included for comparison. It’s important to remember that the PI calculations award zeros when students do not participate in state assessments. The number of untested students was significantly higher in 2020–21, the height of pandemic-related disruptions and school closures. That—combined with learning loss—depressed some districts’ PI scores that year.
Figure 1. Performance index scores, 2018–2023

Results from the 2021–22 school year indicate the beginnings of an academic bounce back. The Ohio Eight average and results from the three ADC districts are all higher than the year prior. Based solely on these data—which are what lawmakers had available to them during the budget cycle—Lorain was outperforming the other ADC districts and closing in on the Ohio Eight average. Perhaps advocates from Lorain used this as evidence that they were worthy of receiving an early release from state oversight.
But struggling districts need to prove that they’re getting better over time. That’s why the ADC off-ramp that was put into law in 2021 required districts to implement an improvement plan and track results through June 2025. Unfortunately, lawmakers decided that didn’t matter for Lorain. And now, report card results from 2022–23 have revealed that Lorain hasn’t continued improving. In fact, its performance index score is flat compared to the year prior, while scores ticked up statewide and in the other ADC districts. East Cleveland’s score went up slightly, while Youngstown’s jumped by five points.
Progress
Ohio’s progress component measures the academic growth students make over the course of a year. This measure is crucial, as it showcases a district’s or school’s contribution to student learning while yielding results that are closer to neutral with respect to schools’ demographics. Even in districts where students are far behind in reading and math achievement, the progress component can reveal positive academic growth.
The table below breaks down the progress ratings of each ADC district for the 2021–22 and 2022–23 school years. East Cleveland and Youngstown remained poor performers at just one and two stars, respectively, in both years. Their lack of growth should be a red flag, as a consistent four- or five-star rating is needed to close achievement gaps. But Lorain’s rating should also cause concern. In 2021–22, the district earned four stars. That meant students made more progress than expected. But in 2022–23, its progress rating dropped to two stars. That means students made less progress than expected. In the time span of one year—the same year that lawmakers decided Lorain had done enough to earn a free pass—the district’s progress rating dropped from positive and promising to negative and discouraging.
Table 1. Progress ratings for ADC districts 2021–22 and 2022–23

Early literacy
Ohio is on the cusp of a significant early literacy overhaul centered on the science of reading. This overhaul makes results on the early literacy component even more important than usual, as results from 2021–22 and 2022–23 will offer a baseline against which to compare future results.
The table below breaks down the early-literacy results for each ADC district. Results for 2021–22 are shown in blue, while those for 2022–23 are shown in red. Once again, Lorain is not the ADC district that performed best. That would be East Cleveland, which earned two stars overall and had nearly half of their third graders score proficient on the reading portion of the state test. By comparison, Lorain and Youngstown earned only one star and had just one-third of their third graders score proficient. Perhaps most troublesome are the results indicating that Lorain moved just 16 percent of its students from off track to on track in reading. Youngstown, on the other hand, moved 21 percent of its students, while East Cleveland doubled Lorain’s total and moved 32 percent. Also of note are the universal promotion rates of all three ADC districts: Without a retention requirement, they waved through practically all third-graders to fourth grade regardless of whether they were prepared to succeed there.
Table 2. Early literacy scores for ADC districts 2021–22 and 2022–23

Chronic absenteeism
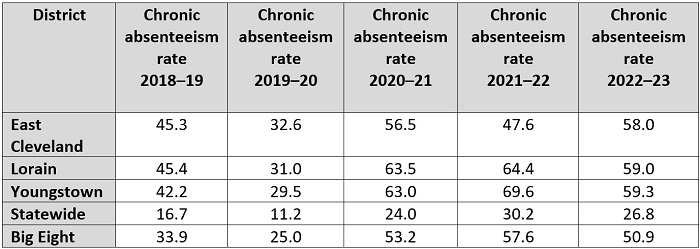
Chronic absenteeism has been a hot topic in Ohio as of late, and rightfully so. Student absences have soared in recent years, and have become a prominent roadblock in Ohio’s efforts to mitigate pandemic-caused learning loss and improve student outcomes. Fortunately, Ohio has tracked chronic absenteeism data on its state report cards since 2017. As a result, we can examine chronic absenteeism rates in all three ADC districts over time, and compare them with the statewide average and the average in the Ohio Eight.
As the table below demonstrates, student absences skyrocketed once the pandemic hit. Chronic absenteeism rates during the 2021–22 school year were particularly bad, but two ADC districts had truly appalling numbers: Lorain had a chronic absenteeism rate of 64 percent, while Youngstown had a rate of 69 percent. Those rates got better during the 2022–23 school year, but are still well above 50 percent. East Cleveland, meanwhile, saw its absenteeism rate rise significantly this year.
Table 3. Pre- and post-pandemic chronic absenteeism percentages

***
There is one more crucial report card measure worth mentioning: overall grades. This measure takes into account all of the report card components and combines them into a concise, easy-to-understand measure of district performance. Unsurprisingly, overall grades from ADC districts are not inspiring. Youngstown, which outperformed Lorain and East Cleveland on several measures, was awarded 2.5 stars. Lorain and East Cleveland were each awarded two stars. These results are even more concerning within the context of the overall distribution of scores across the state. Only fourteen of over 600 districts were awarded two stars, and another forty-six were awarded 2.5 stars (just one district received one or 1.5 stars). That puts Lorain and East Cleveland in the bottom 2 percent of districts statewide and Youngstown in the bottom 8 percent.
District advocates will likely argue that this is only one year of results, and that it’s going to take time for ADC districts to work themselves up from the bottom of the barrel. But that was the whole point of the ADC transition plan established in 2021. Chronically-underperforming districts were given a timeline and standards (albeit questionably low ones) against which they were expected to improve. They were even provided with the local control they demanded to do so. After one year, that local control hasn’t yet seemed to benefit students. In fact, in Lorain, things have gotten worse. And yet, Youngstown and East Cleveland are still under state oversight and Lorain is not. To be clear, this doesn’t mean that Youngstown and East Cleveland also deserved special treatment. It means that lawmakers should have resisted political pressure and insisted that all three ADC districts prove that they were getting better over time. If they had, they wouldn’t be facing the uncomfortable question of why they gave a free pass to a district that now seems to be moving backward.


