The Advanced Placement (AP) exams have become an iconic institution in American high school education. Administered by the College Board since 1955, the AP courses and accompanying exams have given precocious high-school students the opportunity to take college-level courses and earn college credit. In spring 2012, over 2 million students in the U.S. took at least one of the thirty-four exams offered by the College Board. In Ohio alone, over 53,000 high-school students took an AP exam in 2012, more than double the number of students in 2000 and nearly five times the number of students in 1990.
As a growing program, in Ohio and nationally, AP scores should provide an increasingly accurate picture of the college-readiness of high school students, while also providing a comparison to their peers in other states. So how are students in Ohio measuring up to their counterparts in other states?
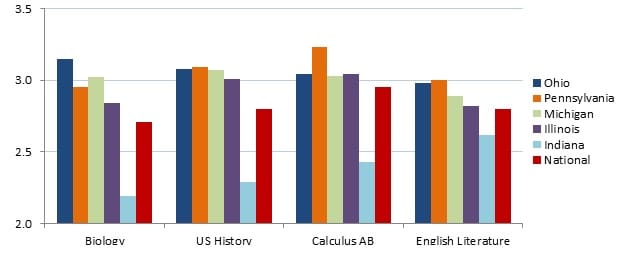
Consider the chart below, which shows the 2012 average scores for AP Biology, U.S. History, Calculus AB, and English Literature. Of the AP exam offerings, these four exams are among the most popular exams—both nationally and within each of these states. The results for Ohio, Pennsylvania, Michigan, Illinois, Indiana, and the United States are displayed. AP exams are scored on a scale of one to five, five being the highest score possible. A score of three or higher is generally considered sufficient to receive college credit (though, university policies on granting AP credit vary considerably).
Chart 1: Ohio’s AP scores mostly above or on par with Midwestern peers, and above national averages - Average AP scores, selected subjects and states, spring 2012

Source: College Board, Summary Reports: 2012. Note: A score of 3 is generally the minimum score required for college credit, though university policies vary—many schools require a score of 4 or above for credit. See table 1 at the end for the averages and number of test-takers.
Ohio’s AP test-takers generally stack up favorably compared to their closest peer states and nationally. (Of course, the comparisons aren’t necessarily apples-to-apples due to the different characteristics of test-takers across the states.)[1]
- Ohio’s average slightly outperforms Michigan and Illinois in all four subjects, with a lone exception—Illinois’ Calculus AB average, which equals Ohio’s;
- Ohio’s students substantially outperform Indiana, whose students score noticeably poorly relative their Midwestern peers and nationally;
- However, Ohio’s average AP scores fall short of Pennsylvania’s in three of the four subjects, and trails noticeable behind the Keystone State’s Calculus AB average score;
- Finally, compared to national averages, Ohio’s students outperform them in all four subjects.
The AP results indicate that Ohio’s K-12 system is creating a relatively strong pipeline of students primed and ready for college. Yet, the test results still show substantial room for improvement, both in Ohio and across the nation. Nationally, the average AP score falls short of the minimum college-credit threshold score of three. And, in Ohio, where the average hovers around three, many of its test-takers are eligible to receive college credit only by the skin of their teeth, if at all. So, can Ohio's top students reach even higher heights—and, can the state do better in preparing more students to take and pass the exams? Yes, for as the AP data show, there's plenty of room for improving the education of Ohio's most intellectually gifted students.
Table 1: Average test scores and number of test-takers, spring 2012, selected states and exams

[1] Roughly speaking, the racial demographics are similar for the Midwestern states. White and Asian students took the following percentages of the total AP tests taken in 2012: OH – 87 percent; PA – 86 percent; MI – 86 percent; IN – 85 percent; IL – 71 percent. Nationally, 63 percent of tests were taken by White or Asian students.
