In a series of articles, I’ve been looking at various issues in school funding as Ohio lawmakers discuss the state budget. This piece looks at a special component of the funding formula, known as Disadvantaged Pupil Impact Aid (DPIA), which current provides districts and charters with $542 million in extra funding based on economically disadvantaged student enrollments.
One of the basic principles of equitable school finance is to fund low-income pupils at higher levels. This type of weighted student funding ensures that more dollars are available to help children who typically need more supports, whether that’s tutoring, summer school, or non-academic services. The extra dollars also support schools that may need to offer higher salaries to attract and retain talented educators who are willing to work in tougher environments. For many years, Ohio has followed this concept and funded economically disadvantaged students (as well as special education and English learners) at higher amounts via the formula.
The rationale for DPIA is sound, but the implementation needs improvement. In a problem that predates Ohio’s new funding model, the state significantly over-identifies economically disadvantaged students, which undermines the intent of the funding stream and soaks up dollars that could otherwise be used to better support students who are actually in need.
Like many other states, Ohio relies on free and reduced-price lunch (FRPL) eligibility to identify economically disadvantaged students. Historically, this has served as a decent proxy for income, as students need to come from households at or below 185 percent of the federal poverty level to receive subsidized meals. But a 2010 change in federal policy has weakened the connection. Known as the Community Eligibility Provision (CEP), certain higher-poverty districts and schools are now allowed to offer subsidized meals to all students, regardless of their household income. This makes sense as a way to address nutritional needs and is a paperwork saver for schools and families. But it has also led schools to report—inaccurately—that all their students are economically disadvantaged.
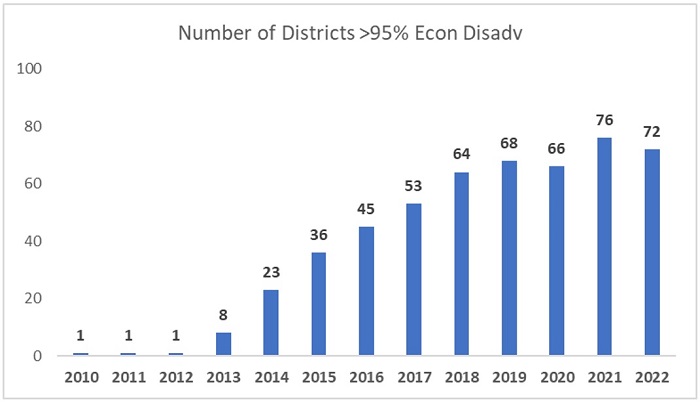
This wouldn’t be a big issue if CEP applied to a handful of schools here and there. But this year, seventy-two Ohio districts—more than one in ten—reported that 95–100 percent of students were economically disadvantaged (and almost 1,000 individual public schools did so). Figure 1 shows the marked increase in CEP eligible districts over the past decade. Prior to the meals initiative, just one district (Cleveland) reported universal economic disadvantage. But that number has grown significantly since 2012–13.
Figure 1: Number of Ohio districts reporting blanket economically disadvantaged rates

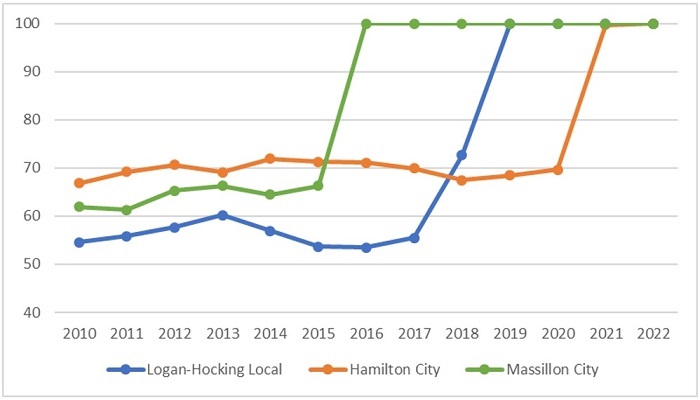
Figure 2 offers a closer look at how CEP inflates the data of three mid-poverty districts. Historically, Logan-Hocking, Hamilton, and Massillon school districts reported between 50 and 70 percent economically disadvantaged rates. But with CEP, those rates spiked to 100 percent in all three districts. Assuming that the 2010 data more accurately reflect the number of disadvantaged students in Ohio’s seventy-two CEP districts, the state over-identifies roughly 60,000 students as “economically disadvantaged.” This is a conservative estimate of the overcount, as individual schools also participate in CEP, even if their overall district does not participate.
Figure 2: Spike in economically disadvantaged rates in three Ohio districts after CEP

Inflated headcounts lead to an inefficient allocation of DPIA funding. To illustrate, let’s return to Hamilton City Schools, a district outside of Cincinnati. Table 1 shows its DPIA funding calculations (under a fully phased-in formula) using its currently inflated economically disadvantaged rate. It also shows a “simulated” DPIA calculation using its pre-CEP rate of 70 percent—almost surely a more accurate number. Note three things: (1) Hamilton’s “economically disadvantaged index”—a key multiplier that drives DPIA funding—doubles when it is allowed to report blanket rates. This, in turn, more than doubles its per-pupil DPIA amount, from $869 to $1,768; (2) Hamilton’s number of economically disadvantaged students swells by more than 2,500 students under CEP; and (3) its total DPIA funding almost triples when it’s allowed to report blanket rates. The district thus enjoys a nearly $10 million windfall because of CEP—an increase that pulls dollars away from districts that need them more.
Table 1: Illustration of inflated DPIA funding for a CEP district

Ohio legislators need to tackle these problems. Two steps would help.
- Move to direct certification to identify economically disadvantaged students. To address the data quality challenges presented by CEP, states including Massachusetts and Tennessee have transitioned to “direct certification” for identifying economically disadvantaged pupils. This method relies on an administrative process that links students to their families’ participation in means-tested benefits programs. In fact, Ohio already uses this method to identify students (sans income forms) who are eligible for free meals based on participation in SNAP or TANF, as well as a few other identifiers, such as homeless or migrant status. Just last month, Ohio received approval from the feds to also direct certify students based on Medicaid participation, which should further improve the accuracy of the data. Under current law, the Ohio Department of Education has discretion to determine an identification method, but it has yet to make the shift to direct certification. State lawmakers should move the process along by enacting language that requires the department to do so.
- Use the more accurate direct certification numbers as the basis for DPIA funding. Once a move to direct certification has been made, state legislators should use those data to steer DPIA funds to Ohio districts and charter schools. This would more effectively target state funds to the highest-poverty schools, and it would also give legislators the confidence to increase DPIA funding in the long-term knowing that the funds are going to the right places. The transition would also provide the state with an opportunity to overhaul the DPIA formula itself—and it may need to do so anyway to account for the “deflated” (albeit more accurate) headcounts.[1] One possibility is to align DPIA with the weighted student funding model used in the other categorical funding streams. Under this approach, the state would create a weight that yields an incremental amount above the base by which economically disadvantaged students are funded. (For instance, the formula could be: 0.3 x $7,000 = $2,100 per disadvantaged pupil.) As with the other categoricals, the state share could also be applied to account for districts’ local capacity to support low-income students. This structural change would make DPIA more consistent with the rest of the formula, create a more transparent DPIA per-pupil base,[2] and would allow the DPIA funding to automatically rise when legislators increase the formula’s general base per-student amount.
Properly funding low-income pupils’ educations should be a priority for state lawmakers. Such students rely on effective schools and supplemental supports to reach their full potential. But without a reliable methodology for identifying them, Ohio is failing to target DPIA funds to students who need them most. The data quality problem is known. And with widening achievement gaps, the need to effectively target DPIA funds is great. It’s time for Ohio to transition to a more accurate count of low-income students, along with a better method for allocating resources for their education.
[1] It’s possible, for instance, that the squaring mechanism used in the economically disadvantaged index could produce extreme results, if there are districts that maintain high direct certification rates relative to a lowered statewide average (e.g., resulting in indexes of six to eight, which is then multiplied by $422).
[2] Right now, the true DPIA per-pupil funding amount is somewhat obscured through use of the economically disadvantaged index and the squaring mechanism. It creates a misperception that Ohio is adding just $422 per economically disadvantaged student in a high-poverty district, when in fact, it’s funding them at more than $1,000 extra per disadvantaged pupil.


