“Confront the brutal facts (yet never lose faith)” – Jim Collins, Good to Great
Cheerleading on schools and students is widespread in K–12 education. Go to a school district website and you’re bound to see something heralding an afterschool program, celebrating an arts initiative, or profiling the most recent teacher of the year.
This positivity is well and good—and completely understandable. But once in a while, we need a reality check. Every two years, the National Assessment of Educational Progress (NAEP), commonly referred to as the “Nation’s Report Card,” gives us the cold (often hard) facts about student achievement in America. A random sample of fourth and eighth grade students in all fifty states take the NAEP exams in reading and math. And in today’s release of data from the 2019 assessment, NAEP again delivers sobering news about achievement both nationally and in Ohio.
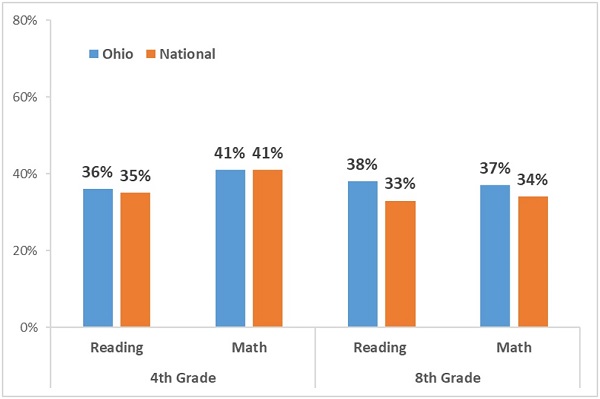
NAEP has long been a much sterner test of student proficiency than Ohio’s state exams. That was no different in 2019. As figure 1 indicates just 36 percent of Ohio students reached proficiency or above on fourth grade reading NAEP exams, 41 percent on fourth grade math, 38 percent in eighth grade reading, and 37 percent in eighth grade math. As the chart below shows, Ohio’s proficiency rate tracks closely to the national average in fourth grade and is slightly ahead in eighth grade. Though not displayed here, upwards of 60 percent of Ohio students reach proficiency on most state exams.
Figure 1: Student proficiency on 2019 NAEP exams, Ohio and national
Source (for all data displayed in this piece): NAEP Data Explorer. Note: For NAEP proficiency rates from 2017, see our Ohio By The Numbers webpage.
While the proficiency data remind us how much work is needed to enable all students (or even a majority) to reach high academic standards, the NAEP trend data offers insight into whether Ohio is making progress toward that goal. Unfortunately, as the figures below indicate, progress has been slow over the past decade and a half. Even more sobering is that Ohio, following national trends, lost some ground in three of the four NAEP exams between 2017 and 2019.
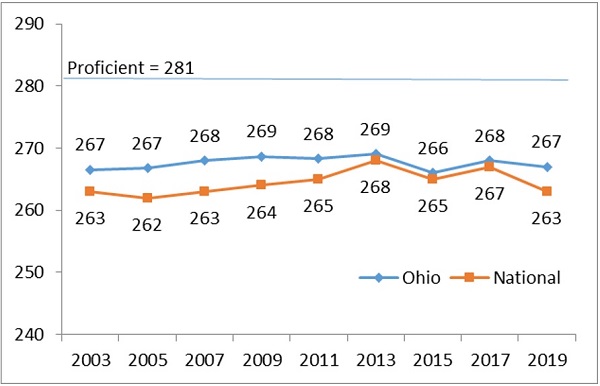
Figures 2 and 3 display results from fourth grade. While Ohio scores were unchanged in fourth grade math between 2017 and 2019, scores have noticeably slumped over the longer term, leading to a convergence between Ohio and the national average in 2019.
Figure 2: Fourth grade math NAEP scores, Ohio and national
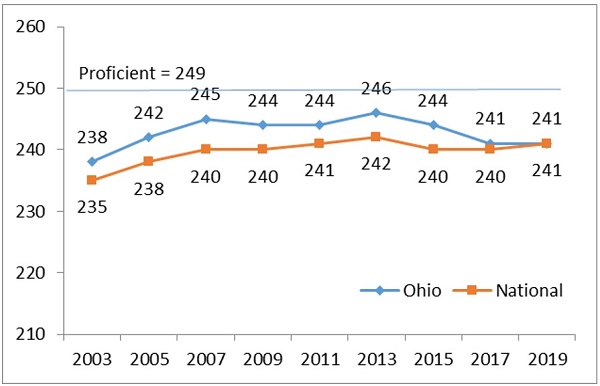
Note: Figures 2 through 5 display NAEP scaled scores, with the exam’s proficiency bar displayed for reference (the full range of scores across all of these exams is 0–500).
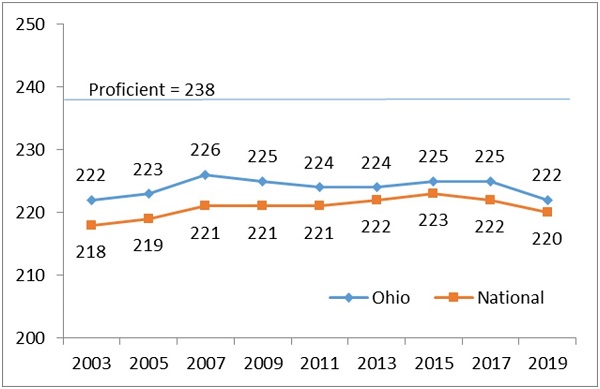
On the reading side, Ohio scores have been largely stagnant during the period shown in the figure below, though the three-point decline between 2017 and 2019 is worrying, especially given the state’s recent efforts to improve early literacy.
Figure 3: Fourth grade reading NAEP scores, Ohio and national
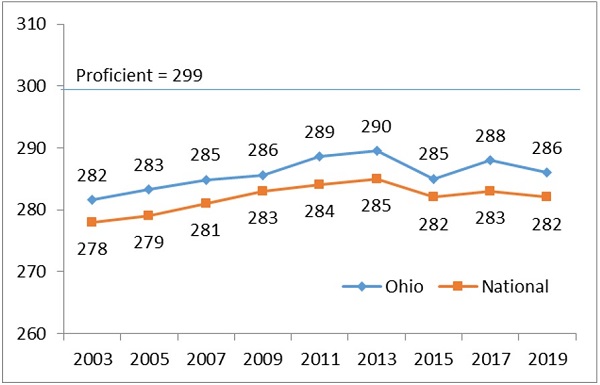
Turning to eighth grade, figure 4 indicates that math has been a bright spot for Ohio, with generally increasing scores over the period shown below. The results in recent years, however, have been more uneven, with the slide in the 2019 scores (relative to 2017) offsetting the uptick registered in 2017.
Figure 4: Eighth grade math NAEP scores, Ohio and national
Akin to fourth grade reading, Ohio’s eighth grade reading scores have also been largely flat since 2003. Fortunately, the slight dip in Ohio’s 2019 eighth grade reading score was less severe than the four-point drop in the national average from 2017 to 2019.
Figure 5: Eighth grade reading NAEP scores, Ohio and national
Because NAEP administers the same tests in all states, we can see how Ohio stacks up nationally. Table 1 below shows Ohio’s rankings on these exams since 2003. Generally speaking, Ohio has ranked between 10th and 20th in the nation in student achievement, a pattern also visible in the 2019 data. Compared to 2017, Ohio moved up in the rankings in eighth grade reading, perhaps because it didn’t lose as much ground as its counterparts (see figure 5). In the other subjects, Ohio’s ranking slightly declined. Overall, these results should ease concerns that Ohio’s school system is falling behind, but also put to rest any fanciful notion that Ohio is (or has been) one of the nation’s highest performers.
Table 1: Ohio’s national ranking on NAEP exams
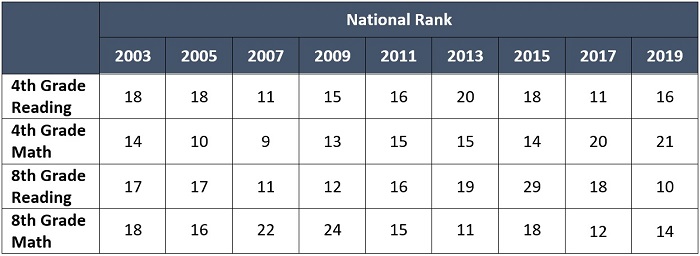
Note: These rankings include all 50 states plus the District of Columbia and US Department of Defense Education Activity. To see how Ohio compares on NAEP after making adjustments for states’ demographics, see the Urban Institute’s website.
* * *
The brutal fact, as delivered by NAEP, is that too few Ohio students are reaching rigorous academic benchmarks. And progress, whether influenced more so by economic or educational trends, has been much too slow over the past decade and a half. Yes, it’s important to root on our schools and praise their successes, but we cannot forget the state of achievement in Ohio. By confronting these facts, and not running away from them, Ohio’s policymakers will be in the best position to help change the trajectory of achievement in the Buckeye State.


