The recently released 2009 NAEP science results provide an in-depth look at how knowledgeable students across the country are in various science-related academic areas. The framework for 2009 sought to align the assessment with new developments in science standards, content, and curricula. The framework for the test broke down the questions into three separate areas: physical science, life science, and earth and space science. NAEP tests students in grades 4, 8, and 12.
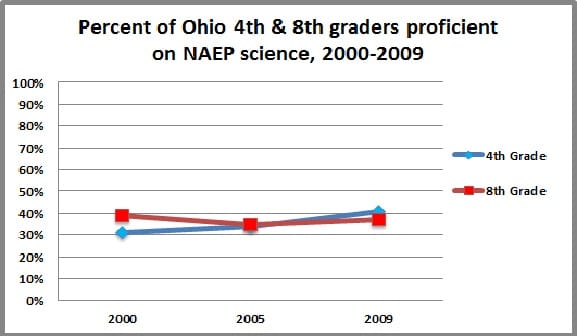
The good news is that Ohio students outperformed students in many peer states. The average score of fourth-grade students in Ohio was 157 out of 300, which surpassed the national average of 149. Furthermore, 41 percent of Ohio fourth-grade students scored at or above proficient compared to the national average of 31 percent. The average score of eighth-grade students was 158 with 37 percent of students scoring at or above proficient, compared to national average of 149 (scale score) and 29 percent of eighth graders scoring at or above proficient. Ohio scored higher than 27 states and only four states scored higher (the remainder of the states were not statistically different than Ohio).
The bad news is that proficiency rates in both grades are still alarmingly low, and haven’t budged much in a decade (much like in reading and math). Chart 1 below depicts the proficiency rates of Ohio students in science over the past several years. Fourth-grade results have actually increased slightly over the last decade, but eighth-grade results have remained relatively constant.

The most recent NAEP science results also illustrate the “proficiency illusion” between different assessments. The Ohio Achievement Assessment (OAA) shows far higher rates of proficiency for the same Ohio students than does NAEP. Chart 2 below compares proficiency rates of the OAA and the NAEP for eighth-grade students in Ohio. Sixty-five percent of eighth-grade students scored at or above the proficiency level on the OAA, compared to the only 37 percent of eighth graders at the same level on the NAEP. The almost 30-point discrepancy between the NAEP and OAA demonstrates the difference in rigor of the two assessments.

This difference justifies a call for Ohio to create stronger assessment standards that more directly line up with national tests. To Ohio’s credit, in June 2010 the State Board of Education agreed to adopt the Common Core Standards in ELA and math. It will be imperative that they follow suit and adopt similar assessments in science and other subjects.
In conclusion the results of the NAEP science test are a familiar good news-bad news scenario. While it’s encouraging that Ohio outperformed most other states in science, proficiency in tested science skills are still very low (not to mention that as a nation we are well behind our international counterparts). These results of this test are yet just another confirmation to the same story that has been told for years. The U.S. cannot be competitive in a global economy that is dependent more and more on science and technology if we continue to produce lackluster results. Neither can Ohio.
