Teacher shortages have been a hot topic over the last few years. In Ohio, districts and teachers unions have been vocal about the impacts of pipeline shortfalls and hiring difficulties, and have warned that things could get worse. The state has sponsored regional meetings to collect ideas about how to improve teacher recruitment and retention efforts. And the governor recently included a proposal aimed at addressing some shortages in his budget recommendations.
But just how widespread and worrisome are these shortages? Ohio doesn’t collect data on teacher demand, which means we don’t know the number of teaching positions that go unfilled each year. This lack of data also means there’s no way of knowing how long it takes districts to fill open positions, what the candidate pool looks like, or whether schools have opted to just stop offering certain classes—say, for instance, German or a career-tech course—because they couldn’t find a teacher.
Fortunately, Ohio collects several other data points that can indicate mismatches between teacher supply and demand and serve as proxy measures to help policymakers understand shortages. These data are limited to public schools (including charters), as the state does not collect data on educators working in private schools. At a meeting in March, staff from the Ohio Department of Education (ODE) presented these measures to the state board and later published a more in-depth look at their data insights into Ohio’s teacher workforce. Here’s a look at a few big takeaways.
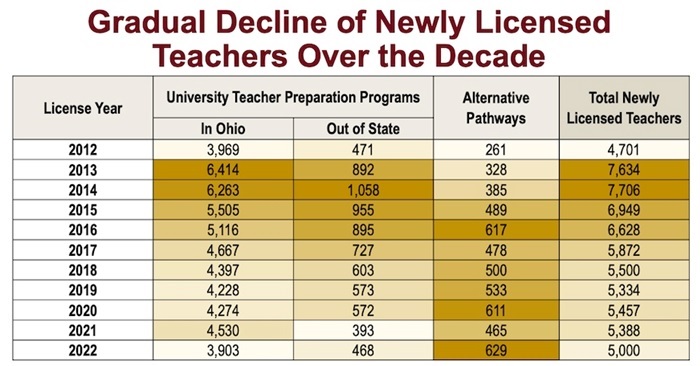
Ohio has seen a gradual decline of newly licensed teachers over the last decade.
In 2022, the number of newly licensed teachers coming from university-based teacher preparation programs in Ohio was roughly the same as it was in 2012. But as evidenced by the table below, this doesn’t mean that things stayed steady over that time. Rather, there was a massive jump in the total number of newly licensed teachers in 2013, followed by a gradual decline over the next several years. The number of new teachers coming from universities both inside and outside of Ohio followed a similar downward trend, though the number of educators coming from alternative pathways increased. The overall decline in newly licensed teachers could be a general indicator of a growing teacher shortage, though it should also be noted that student enrollment in Ohio has declined, thus requiring a slightly smaller workforce. It’s similarly important to note that national data also indicate a gradual decline in the number of students who complete teacher preparation programs, so this isn’t a trend that’s unique to Ohio.

It’s hard to know why there was a spike in teacher numbers in 2013 and 2014 and then a noticeable decline. It’s possible that economic factors contributed. The 2013 and 2014 graduates from teacher preparation programs would’ve started their degrees in 2009 and 2010, which was the tail end of the Great Recession. College students eager for a stable job with guaranteed benefits and retirement and consistent increases in salary might have opted to enter the classroom rather than try their luck in a tough job market elsewhere.
State and district attrition rates are up.
The statewide annual attrition rate recently ticked upward. In 2021, the number of exiting teachers (meaning individuals who taught during the 2020–21 school year but not during the 2021–22 school year) clocked in at 9,148, making the attrition rate 8.3 percent. That’s up from 2020, when 6,864 teachers exited and the attrition rate was just 6.2 percent. Meanwhile, at the local level, attrition rates are rising in almost every region and district type. Urban districts have the highest rates, ranging from 8.4 in the southeast region to 14.5 in the southwest. Rural districts are close behind, with attrition rates ranging from 9 in the west to 12.2 in the central region. Suburban districts have the lowest rates, but even those have grown compared to five-year average annual attrition.
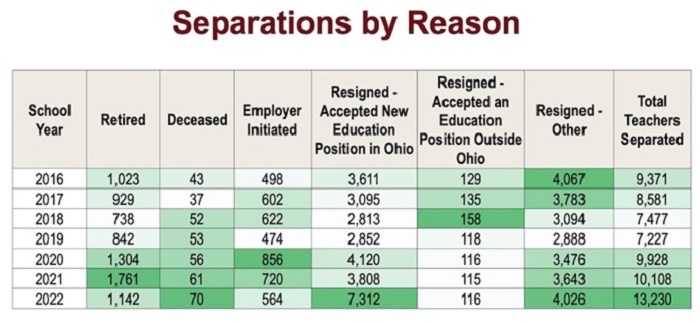
Statewide attrition rates include teachers who left because of retirement, career changes, and transitions to other education staffing roles (like a principal or district administrator). To dig deeper into some of the reasons why teachers are leaving, ODE included the following chart in their presentation to the state board.

Since the start of the pandemic, an increasing number of teachers have retired, perhaps reflecting the challenges of the Covid era, or simply the huge Baby Boomer generation aging out of the profession. But that’s not the main factor pushing people out of classrooms, not by a longshot. Between 2021 and 2022, the number of teachers who resigned but accepted new education positions in Ohio—meaning they resigned their previous position to take a different one within the same district or to take a job within another Ohio district—nearly doubled. ODE noted in their presentation to the state board that this suggests that the main driver of increasing district-level attrition is teacher mobility, rather than teachers leaving the profession or the state.
Potential shortages seem to be concentrated in certain subject areas.
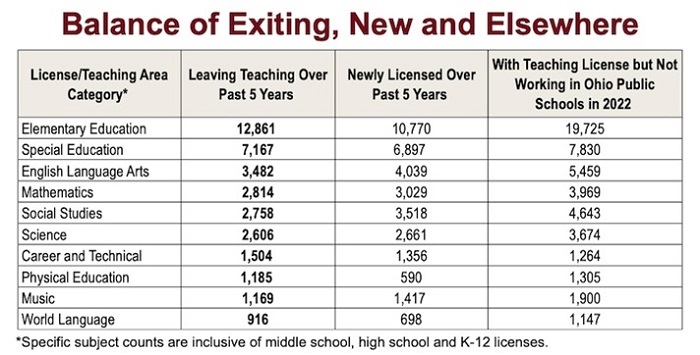
The chart below outlines the number of educators who have left teaching, as well as those who have been newly licensed over the past five years. Based solely on these data, there are several subject areas where the number of teachers who left the profession is larger than the number of teachers who were newly licensed and could replace them, thereby creating a possible shortage. These subjects include elementary education, special education, career and technical education, physical education, and world languages.

The most interesting part of this chart, though, is that it identifies the number of individuals who hold teaching licenses in each subject but were not working in public schools in 2022. In total, there are more than 43,000 people with active teaching credentials in Ohio who are not employed in a public school. It’s unclear where these individuals are working instead. It’s possible that some are teaching in private schools (ODE doesn’t collect data on educators working in private schools) or that they left education entirely for jobs that were less stressful or paid more. What we do know is that, in every one of the possible shortage areas—elementary education, special education, career and technical education, physical education, and world languages—there are enough licensed individuals to cover the difference between those who left and those were newly licensed.
***
There are several takeaways from these data. First and foremost, there’s plenty to be worried about. The decline of newly licensed teachers statewide indicates that fewer young people are entering the profession at the same time that Baby Boomers are retiring. Given today’s tight labor market, perhaps that shouldn’t be surprising; Gen-Z college students have plenty of options right now. Rising teacher attrition rates at the state level and in many districts, combined with potential shortages in specific grades and subject areas, is likely putting considerable pressure on schools. Meanwhile, there are tens of thousands of licensed teachers who are opting not to teach in public schools.
Second, Ohio has an urgent need for better data. Empowering ODE to collect data about teacher demand and vacancies is critical to better understand teacher shortages. Determining why individuals who have teaching licenses but aren’t working in Ohio public schools are steering clear of the classroom could help policymakers craft initiatives to lure them back to public schools. And collecting information from high school and college students about what would motivate them to consider a career in education (or, similarly, what might be dissuading them) would give leaders vital information about how to bolster Ohio’s teacher pipeline in the future.
Last but not least, Ohio leaders should consider prioritizing and investing in rigorous alternative teacher preparation programs. The data above show that, although the number of newly licensed teachers coming out of universities has declined, the number of teachers coming from alternative pathways is rising. The numbers are still small—just 629 teachers in 2022. Nevertheless, high-quality alternative pathways are a crucial part of addressing teacher shortages. This is especially true for Grow Your Own programs, which can help recruit and train teachers in hard-to-staff subjects and grade levels and aid in diversifying the profession.
Overall, the picture painted by these data points is of a profession under strain. Some are likely to say that more money is the solution. And while dollars can certainly help, we also need to think more comprehensively about how to make teaching a more attractive profession to young people, how to encourage mid-career professionals to enter the classroom, and how to ensure that our best teachers stay right where they are. The future of Ohio’s students depends on excellent teachers, and there’s a whole lot of work to be done to make sure Ohio’s teacher pipeline is up to the task.


