One of the big stories in the wake of the pandemic has been the nationwide slump in public school enrollments. From fall 2019 to 2021, public school enrollment nationally fell by 1.2 million students, or a loss of 2.5 percent. Various factors explain the slide, including more parents opting for private schools or homeschooling, as well as continuing declines in the overall number of school-aged children given the recent baby bust.
As previously discussed on this blog, Ohio’s public school enrollments also fell sharply during the pandemic. This piece looks at the most recent numbers from the 2023–24 school year. Has enrollment continued to slip, or is it starting to turn upward? Are there differences in trends across various regions of the state, or by district and charter school sector? Student enrollment numbers and trends are important, as they offer a window into parents’ school preferences and impact key policy areas like school funding.
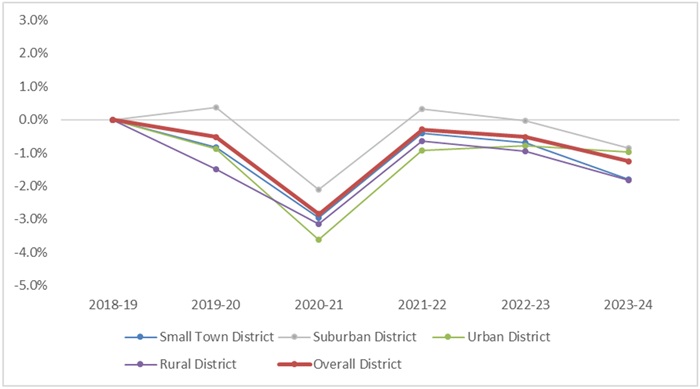
Let us begin with a look at traditional districts, excluding public charter schools for now. Figure 1 displays annual changes in district K–12 enrollments from 2018–19 to 2023–24. Points on the negative side indicate an enrollment decline relative to the year prior; positives indicate an increase. The red line shows the statewide trend, while the thinner lines display trends by typology (rural, small town, suburban, and urban).
We first note the dip in enrollment during the pandemic-disrupted 2020–21 school year. But district enrollments have continued to slide, albeit not as steeply, in each of the following three years. According to the most recent data, statewide district enrollment fell another 1.2 percent between 2022–23 and 2023–24, a loss of 18,161 students. As for trends by typology, rural and urban districts suffered steeper losses during this five-year period, while suburban districts experienced smaller declines. For the current school year, small town and rural districts registered the largest declines relative to the year prior (-1.8 percent each).
Figure 1: Percentage change in district enrollment compared to the previous school year, by district type, 2018–19 to 2023–24

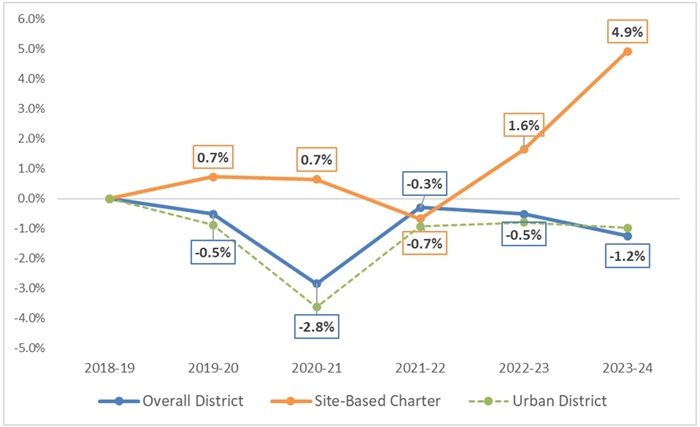
Adding public charter schools to the mix changes the picture dramatically. Figure 2 looks at the enrollment trend for Ohio’s site-based (a.k.a. “brick-and-mortar”) charter schools, thus excluding online charters. It shows that site-based charters not only avoided the enrollment drop that hit districts during 2020–21, but actually posted enrollment increases over the past two years. Between 2022–23 and 2023–24, site-based charter enrollments rose by an impressive 4.9 percent, a gain of 5,829 students. This annual increase easily topped districts overall (-1.2 percent) and that of districts in urban areas (-1.0 percent), which is where most site-based charters are located. Though not shown below, online charters have had even more robust growth during the time period. Their enrollments boomed in 2020–21 as families sought at-home instructional options, though they have somewhat fallen since then.[1]
Figure 2: Percentage change in enrollment compared to the previous school year, site-based charter schools versus districts, 2018–19 to 2023–24

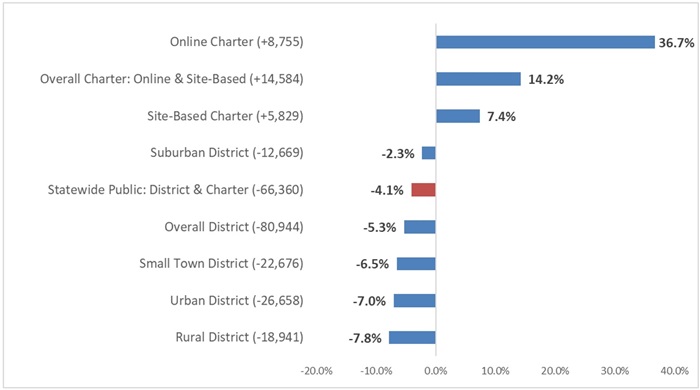
Figure 3 displays the cumulative changes in K–12 enrollment from 2018–19 to 2023–24. As the red bar indicates, total public school enrollment—district and charter combined—declined 4.1 percent during this period. District-only enrollment fell 5.3 percent, while site-based charter enrollment climbed 7.4 percent. To some extent, charters’ enrollment gains represent district losses, but it must be noted that district losses—almost 81,000 students—far exceed the gains of charters (+14,584 students). Thus, a large fraction of district enrollment losses can be attributed to other factors, such as students exiting for other educational options or declining school-aged populations.[2]
Figure 3: Public school (district and charter) enrollment changes, 2018–19 to 2023–24

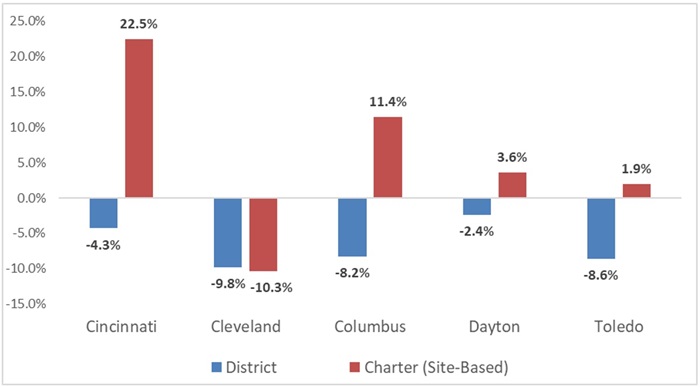
To close, we take a closer look at the trends in Ohio’s major cities where most site-based charter schools are located. Figure 4 shows some striking patterns. Of these locales, Cincinnati’s charter sector registered the largest enrollment increase (+22.5 percent), followed by Columbus (+11.4 percent). On the reverse side, Cleveland charters lost 10.3 percent of their enrollment during this period, a decline that is even steeper than the losses registered by the local district.
Figure 4: District and charter school enrollment changes in selected cities, 2018–19 to 2023–24

Though it has had a relatively small charter sector, Cincinnati’s impressive growth of late is partly attributable to the fall 2022 launch of the IDEA charter school, which has already scaled to serve nearly 1,000 students this year. This is great news for Cincinnati parents and students, as the school is affiliated with one of the nation’s top charter school networks. The other Cincinnati charter driving enrollment growth is Dohn Community, a dropout-recovery school that now serves more than 1,500 at-risk adolescents at multiple sites across the city.
Turning northward to Columbus, charter enrollment growth is led by KIPP Columbus, a perennial top-performer whose enrollment has increased by more than 600 students since 2018–19. The school now serves just over 2,000 students. (Fordham proudly sponsors both IDEA and KIPP Columbus.) Also notable are Cornerstone Academy and Columbus Bilingual Academy-North, whose enrollments are up by more than 200 students. With a new facility on the horizon (though just outside of the city), Cornerstone is poised for additional growth.
* * *
Enrollment trends often tell us something about the types of schools that families are gravitating to or moving away from. In the post-pandemic era, districts appear to be losing their edge, despite their historical position as a monopoly educational provider and their higher levels of taxpayer resources. Yes, they continue to educate a large majority of Ohio students. But persistent enrollment declines signal increasing parental interest in other options—particularly in light of recent legislative changes that have expanded access to private-school choice.
On the other hand, the state’s public charter schools are appealing to an increasing number of families. And the sector is also looking to meet those rising demands, as some longstanding schools are expanding their capacity and promising new startups are getting off the ground. With significantly improved funding starting this year, site-based charters are well-positioned for additional growth that can ensure more families seeking public school alternatives have quality options in their community.
Enrollments provide more than insights into parental demand, though. They also have implications for policy—an issue that I’ll cover in a follow-up piece. But for now, let’s cheer the work that charters are doing to serve an increasing number of Ohio families and students.
[1] Online charter enrollments grew by 46.1 percent in 2020–21 then fell by 5.9 and 1.6 percent in the following two years. Between 2022–23 and 2023–24, online charter enrollments increased by 3.4 percent.
[2] Private school enrollment increased by 6,484 students between 2018-19 and 2023-24. Homeschooling increased by 14,581 students between 2018-19 and 2022-23 (data are not yet available for this year). Note that private school competition, homeschooling, and demographic changes would also impact charter enrollments.


