It’s no secret that tough accountability measures are out-of-fashion in education circles these days. After much political debate, Ohio, for instance, has backpedaled on the implementation of stricter teacher evaluation, suspended accountability consequences during a recent period of “safe harbor,” and is actively debating whether to repeal the state’s district-intervention model. Riding the anti-accountability wave, education groups have been pushing lawmakers to dump Ohio’s A–F school rating system, which they’ve decried as “destructive” and “punitive.” Instead, they’ve advocated for the use of milquetoast descriptors such as “not met” and “very limited progress,” or numerical systems like 0–4.
All these proposals would avoid the use of an “F”—a letter associated with “failure”—to identify low-performing schools. It’s not, of course, surprising to see organizations representing the adults in the system favoring gentler, euphemistic terms that can help insulate schools from public criticism. But at the same time, we should ask whether the dreaded “F” is a necessary tool that can help protect students from the harms of truly deficient schools.
This post examines the academic data of schools assigned an overall grade of F under the state’s accountability system. The numbers are small: Just 8 percent, or 275 schools (204 district and 71 charter) received such a rating in 2018–19.[1] But their results suggest a continuing need for a red flag—an alarm bell—that warns parents, communities, and governing authorities that students in these schools are far behind, with little chance of catching up. Let’s dig in.
Student proficiency
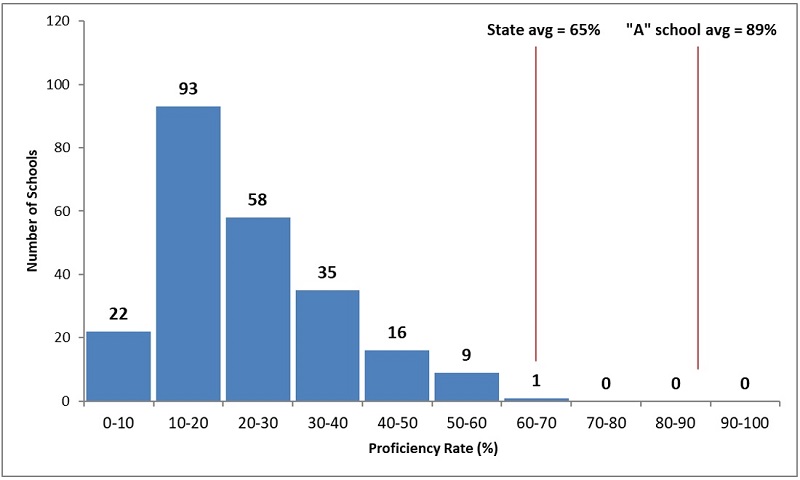
First, we look at proficiency rates, or the percentage of students reaching “proficient” or higher on state exams. Figure 1 displays the number of F-rated schools within ten equal intervals ranging from 0 to 100 percent proficiency. The bar at the far left of the chart, for instance, shows that twenty-two F-rated schools had proficiency rates between 0 and 10 percent last year. Overall, we see that a large majority of these schools post very low proficiency rates: 173 of 234 schools have proficiency rates below 30 percent. The average proficiency rate of F-rated schools is just 25 percent, less than half the statewide average and far behind the proficiency rates of A-rated schools. A small number of outliers register rates closer to the statewide average, but on the whole, the vast majority of students attending F-rated schools fall short of state academic standards in core subjects such as English, math, and science.
Figure 1: Proficiency rates of overall F-rated schools, 2018–19

Source for figures 1–3: Ohio Department of Education. Note: The average proficiency rate across the F-rated schools is 25.1 percent.
Student growth
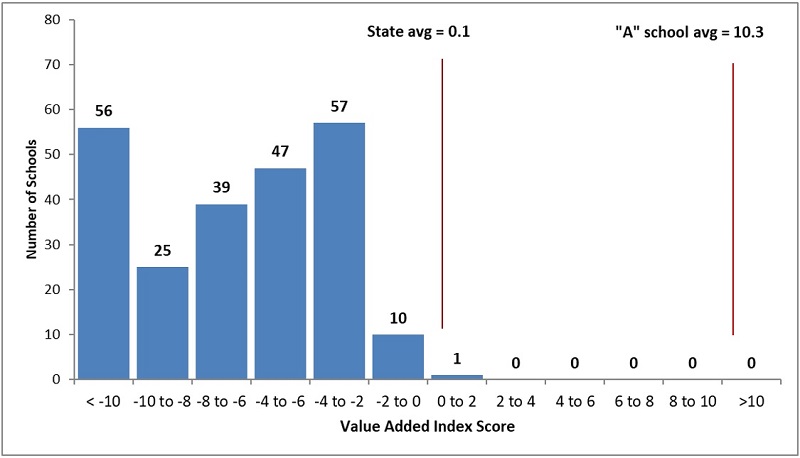
Despite low proficiency rates, the schools shown above might be helping students make significant academic progress that could eventually lead them to achieve proficiency on state tests. Figure 2 examines that possibility. It shows F-rated schools and their value-added index scores, a measure of statistical certainty that a school produces learning gains or losses that are different from zero (zero indicating that the average student maintains her position in the achievement distribution).[2] A score of -2.0 or below is usually interpreted to mean that there is significant evidence of learning losses, with lower values—e.g., -5.0—indicating stronger certainty that the average student lost ground. What we see in the figure below is that almost all of the state’s F-rated schools—224 out of 235—register value-added index scores below -2.0. This indicates that not only are students struggling to meet proficiency targets, but they are also falling further behind their peers.
Figure 2: Value-added index scores of overall F-rated schools, 2018–19

Note: At a school-level, value-added index scores range from -47.8 to 35.0. The average value-added index score for F-rated schools is -9.7.
It’s critical to recognize that poor value-added results cannot be simply blamed on demographics. Because these growth measures control for students’ prior test scores, high-poverty schools can and do perform well on this measure. Quite a few of them regularly receive A’s and B’s on the value-added measure. Students struggling to meet proficiency targets need schools that accelerate learning. Sadly, these data indicate that F-rated schools are not only failing to provide the academic growth required to achieve proficiency before exiting high school, but allow students to fall even farther behind.
College readiness
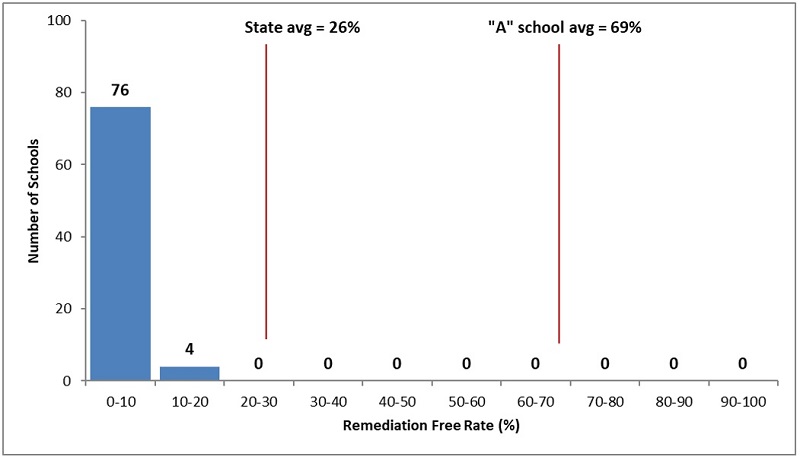
Speaking of high schools, a final data point worth examining is the percentage of students meeting the state’s college remediation-free standards on the ACT or SAT exams. Figure 3 shows the data among students attending F-rated schools. In seventy-six out of eighty F-rated high schools, less than 10 percent of students achieve a remediation-free score. The average remediation-free rate among these schools is a miniscule 3.8 percent, well behind the state average of 26 percent and a far cry from the 69 percent of students attending A-rated schools. Simply put, a depressingly small fraction of students who attended these high schools are prepared to handle the rigors of post-secondary education.
Figure 3: Percent scoring remediation-free on the ACT or SAT of overall F-rated schools, 2018–19
Note: The average remediation-free rate for F-rated schools is 3.8 percent.
* * *
All students deserve a quality K–12 education that puts them on a solid pathway to college and career. Unfortunately, the abysmal outcomes of some Ohio schools indicate a lack of success in achieving that goal. While it may be uncomfortable, the state has an obligation to identify such schools, and the overall “F” rating is the clearest possible signal of distress. The red flag serves a couple important purposes that help to protect families and students:
- Puts schools on urgent notice that something must change. Though a blunt tool, this letter grade should motivate changes that can benefit students attending these schools. When a school receives an “F” rating, governing authorities—whether a district school board or charter authorizer—ought to step in and urge improvement measures. Skeptics might argue that school transformation is pointless or counterproductive, but there is evidence from Ohio that forceful changes can boost student learning.
- Warns parents about the hazards of attending the school. Akin to a surgeon general’s warning, the “F” rating is a clear message to families that choosing the school may not be in the best interest of their child. In almost every community in Ohio, superior options likely exist that parents should consider instead.
Sugarcoating failure through nebulous descriptors or opaque numerical systems is unlikely to spur organizational change or alert parents about the risks of attending low-quality schools. Although an “F” rating may feel destructive to some, it can actually shield students from the long-term harms of being unable to read, write, and do math proficiently. As the debate continues around report cards, Ohio policymakers need to remember the importance of clear, transparent ratings.
[1] The analyses below exclude about forty F-rated early-elementary schools that lack these report-card data.
[2] The index scores—the estimated value-added gain or loss divided by the standard error—are used to determine the value-added ratings. Though also influenced by school enrollment size, larger index scores suggest more sizeable learning gains or losses.


