Over the past two decades, student enrollment has gradually declined across Ohio, reflecting demographic changes and out-migration that have reduced the overall childhood population in the state. But with the pandemic wreaking havoc on education, public school enrollment fell more sharply between the 2019–20 and 2020–21 school years. Taken together, Ohio district and charter schools’ K–12 enrollments declined by about 30,000 students last year. That represented a 2 percent loss, slightly less than the national decline of 3 percent in public school enrollment. Analysts have pointed to a number of explanations for the dip, including more parents choosing to “redshirt” their kindergarteners, increases in homeschooling and private school enrollments, and perhaps higher numbers of dropouts.
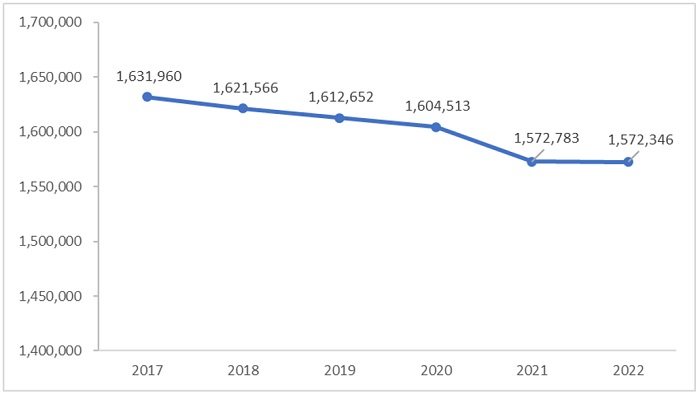
This year has been marred by fewer disruptions, but does that mean enrollments are bouncing back? A first look at the 2021–22 data indicates that they remain depressed. Figure 1 displays the statewide numbers—traditional districts and public charters schools combined—showing that enrollments are flat compared to last year.
Figure 1: Public school enrollment, Ohio school districts and charters, FY 2017 to 2022

Source: Ohio Department of Education (ODE). Traditional district enrollments for FYs 2017–21 were calculated based ODE’s FY 21 Final #2 Payment file and the FY 22 district enrollment was pulled from the February 4, 2022 payment information in its Foundation Payment Reports. Charter school enrollments for FYs 2017–21 were calculated based on ODE’s Community School Annual Report (Table 2) and the FY 22 charter school enrollments were calculated based on its FY 22 December Payment file.
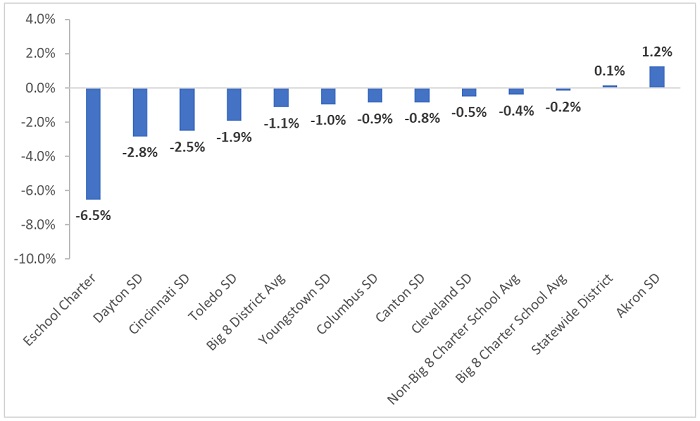
Analyses of last year’s data found that Ohio’s major urban districts suffered the greatest enrollment losses. That pattern has continued into this year. Figure 2 shows that Dayton and Cincinnati’s FY 22 headcounts are more than 2 percent below last year. On average, Big Eight district enrollment declined 1.1 percent year over year, even as district enrollment statewide inched upward by 0.1 percent.
Figure 2 also reveals a couple interesting patterns in charter school enrollments. First, continuing a pattern seen last year, headcounts across Ohio’s urban brick-and-mortar charters once again remain more stable than their urban district counterparts. This year, charters located in the Big Eight cities report enrollments that are just 0.2 percent lower versus the 1.1 percent slide for urban districts. Second, we notice that e-school charter enrollments fell rather substantially, declining by 6.5 percent compared to last year. This suggests that some of last year’s spike in e-school enrollment was transitory, i.e., parents using e-schools as a temporary alternative to brick-and-mortar options during the earlier days of the pandemic.
Figure 2: One-year percentage change in public school enrollment, FY 2021 to 2022

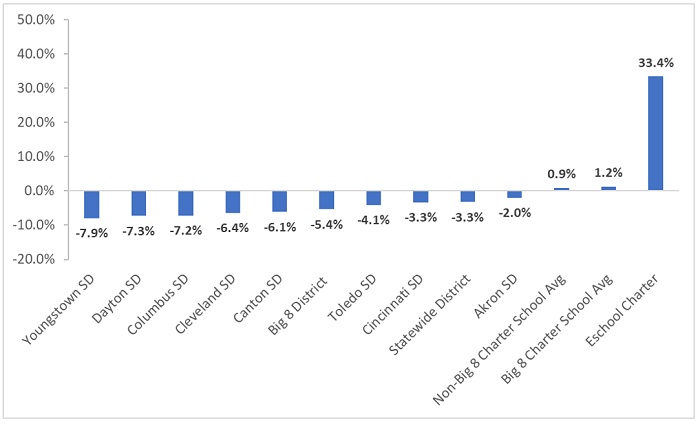
Figure 3 looks at changes in enrollment from the pre-pandemic year of 2018–19 to the current school year. Here, the enrollment declines in the Big Eight districts are more marked, particularly in districts like Youngstown, Dayton, and Columbus. In contrast, we see brick-and-mortar charter enrollments slightly increasing, despite the disruptions of the pandemic, rising by 1.2 percent over this period. Even with this year’s enrollment loss, as was shown in Figure 2, e-school enrollment rose significantly during these years.
Figure 3: Three-year percentage change in public school enrollment, FY 2019 to 2022

* * *
We don’t know all the reasons behind these trends, nor can we predict with certainty whether lower enrollment levels will be a permanent “new normal.” That being said, these patterns do have policy implications, two of which deserve brief mention.
- School funding: Ohio’s funding system has long included—and continues to include—guarantees that shield traditional school districts from funding losses even if their enrollments decline. Under the current formula, for instance, districts are guaranteed the amount of state funding they received in 2020, a pre-pandemic year in which enrollments were higher. Therefore, due to the recent declines in enrollment, the state effectively funds thousands of “phantom students.” To direct dollars to where they are most needed, state lawmakers need to dispense with guarantees and ensure funding is based on current headcounts—not those from prior years.
- Educational choice: Enrollment patterns reflect parent demand for particular schools, and types of schools. The decades-long exodus of students from Ohio’s urban districts—accelerated by the pandemic—continues to reveal dissatisfaction with clumsy, bureaucratic school systems. Conversely, the more buoyant enrollments of charters and other educational options likely reflect the positive attitudes that families have towards these more nimble and family-driven alternatives. State policymakers should value and respect the decisions of Ohio parents, remembering that—contrary to the anti-choice rhetoric—no one “system” has any inherent right to educate students. Rather, the choices of millions of Ohio parents should be decisive in matters of school enrollment.
The pandemic has altered life in many ways, some fleeting but others more permanent. In K–12 education, it’s led to some notable shifts in where students attend school. Moving ahead, policymakers need to work to ensure that Ohio’s education policies line up with this new reality.


