In summer 2021, Ohio lawmakers passed a brand-new school funding formula for Ohio’s 600-plus school districts and 300-plus public charter schools. To fulfill its constitutional responsibility of properly funding K–12 education, Ohio has long used a formula that seeks to deliver more state aid to districts that have less capacity to generate dollars locally and/or serve greater numbers of high-need students.
The latest iteration of the formula follows the much-discussed Cupp-Patterson plan, named after its legislative sponsors former Speaker Bob Cupp and former Representative John Patterson. They first unveiled this blueprint—also dubbed the “Fair School Funding Plan”—in spring 2019, and after much debate and revision, lawmakers eventually enacted the blueprint via the state budget bill for FYs 2022 and 2023. The new formula calls for an estimated increase of $2 billion per year in state education expenditures—a roughly 20 percent bump—and includes a new “base cost” model intended to determine the cost of educating an average student, among other structural modifications.
With the next biennial budget bill on deck for 2023, legislators will soon be reviewing the new school funding formula. There will certainly be strong advocates for maintaining the current model, but continued implementation isn’t a slam dunk. During the last budget cycle, important questions were raised about the formula, including concerns about its costs and long-term sustainability. As a result, legislators phased in just 33 percent of the additional funding called for under the new formula, and also included language that explicitly limited its use to FYs 2022 and 2023.
In this essay and a few forthcoming pieces (stick with me!), we’ll take a closer look at the formula and the major issues that legislators should focus on in the coming months. The details can get wonky, but it’s important for Ohio to get them right and ultimately implement a fair and sustainable formula. This piece starts with the basics, while future pieces will take a deeper dive into the mechanics.
The big picture
To understand the formula, we first need a handle on the basics of how funding in Ohio works. At a rudimentary level, we must remember that Ohio takes a “hybrid” approach to funding K–12 education, whereby both local and state dollars support schools. On the local side, all districts receive significant sums through property taxes. This includes dollars raised via a state-required property tax of at least 2 percent (20 mils), along with supplemental dollars generated when districts tax above that floor with voter consent. In total, Ohio districts received about $11 billion in local revenue during FY 2022.
The well-known problem with a “local-only” funding system is that substantial disparities in property wealth and income exist from district to district. Because of these differences, the state works to “level up” poorer districts to create a more even playing field. In 2022, the state provided approximately $10 billion to schools, allocated largely through the funding formula (about $8.5 billion).
Table 1 illustrates how the formula works to counteract disparities in local wealth. Districts such as Solon and Parma generate more local dollars, and as a result, their state funding levels are relatively modest. Cleveland, a poorer district, raises fewer dollars locally and thus receives—as it should—more from the state. Ohio’s public charter schools do not receive local funds (save for a few in Cleveland) and thus receive more state dollars, as well. However, charters’ state funds do not fully compensate for the absence of local resources. Consequently, charters on average receive significantly less overall funding than nearby districts.
Table 1: Illustration of local and state funding in Cuyahoga County, FY 2022

** State funding includes dollars that flow directly through the state funding formula, plus additional state funds provided through casino revenues and property tax reimbursements.
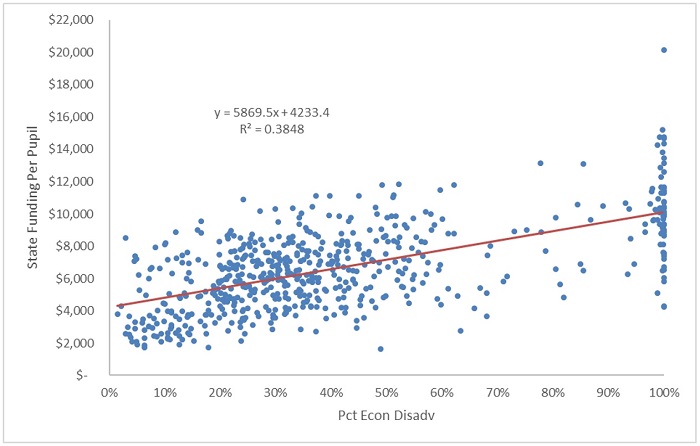
The chart below provides a higher-level look at the state’s allotment to all districts statewide. As indicated by the upward sloping line, districts with more economically disadvantaged students tend to receive more state funds. Of course, it’s not a perfect correlation—that would occur if the formula were premised only on disadvantaged enrollments (and ignored variables such as districts’ property wealth or special education pupils)—but, in general, the state’s formula is “progressive,” distributing more aid to districts with needier students.
Figure 1: Economically disadvantaged students versus state funding per pupil, Ohio districts, FY 2022

It should be emphasized that this progressive allocation at the state level has existed for many years. It’s not a novel invention brought about by the new formula. Ohio’s hybrid model—making school funding a joint state and local responsibility—has also existed for a long time. Over the past decade, the local-state share of overall education funding has been a near even split (roughly 43 to 43 percent), with the remainder coming from federal and non-tax sources. Overall, when looking at Ohio’s school funding system as a whole, Education Week awards the Buckeye State a solid B+ rating for funding equity.
What does the new formula do?
Broadly speaking, the new formula follows the previous one in many ways. The overall goal certainly remains the same—to deliver more state aid to districts in need of more financial assistance—and the new formula seems to accomplish this about as well as the old one. Moreover, the formula’s general design resembles the old framework—though there are some significant alterations beneath the hood.
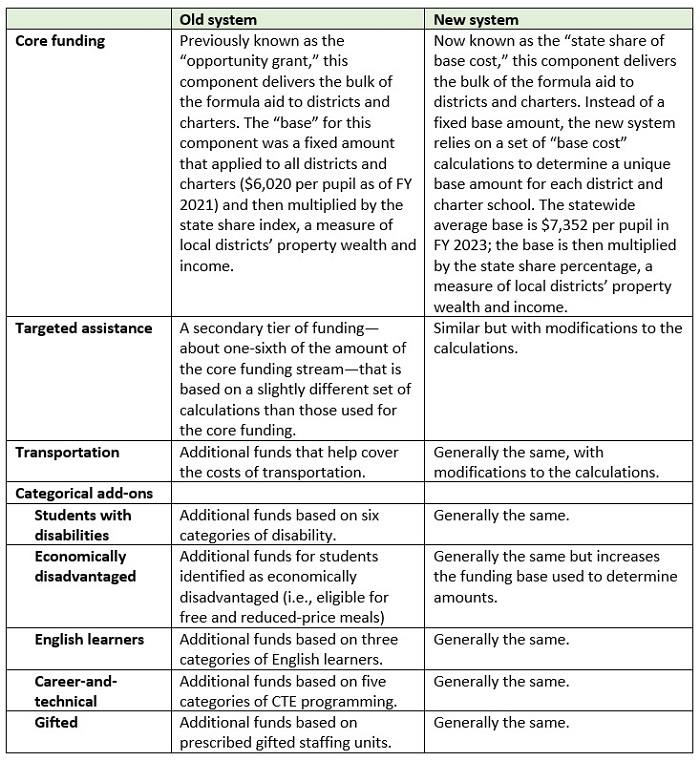
Table 2 shows an overview of the two system’s formula components. At the top is a core funding component that, in both models, delivers most of the state’s formula aid. However, the calculations are very different. We’ll discuss these changes in future pieces, but the two main things to know are that the new model’s base calculations (a) drive the much higher cost of the formula and (b) create a number of implementation challenges for policymakers. In addition to the core funding stream, the old and new systems include categorical “add-ons” that supply extra aid to districts serving students with greater needs. There also remains a supplemental tier of funding known as “targeted assistance,” as well as transportation dollars. While the general approach for these components is similar, some of the details are different and we’ll also touch on those in future pieces.
Finally, while not reflected in the table below, the new formula shifts to a direct funding approach for school choice programs. Rather than counting charter and most private-school scholarship students as district students and then transferring state funds for their education to their school of attendance, the state now sends dollars directly to schools of choice. This shift should reduce misconceptions about the source of charter and scholarship funding—they are supported by state dollars, not local—and eliminate some distortions in district formulas when choice students were included in their enrollments.
Table 2: An overview of Ohio’s previous and new funding formulas1

* * *
Some basic orientation to Ohio’s school funding system is critical for productive debates about the formula. We should first remember that in a “hybrid” local-state funding system, the state’s formula needs to counteract local inequities in wealth by sending more dollars to poorer districts. By and large, Ohio’s school funding formulas—both past and present—generally work to meet that goal. Big picture, the old and new formulas also have an overall framework that makes some reasonable sense. There is a core funding component, with categorical dollars for special-needs students added on top. But the devil’s in the details, and there are areas that require closer inspection. In the next piece, we’ll begin looking at several elements of the new formula—starting with the new “base cost” model—and see what we find.
- 1Charters previously received 25 percent of their local districts’ targeted assistance; under the new formula they are not eligible to receive targeted assistance. While brick-and-mortar charters receive all of the categorical funding streams, e-school charters are not eligible for economically disadvantaged or English learner funding (in both the old and new systems).


