For more than two decades, Ohio’s school report cards have shed light on the strengths and weaknesses of the state’s public schools. This year’s report card is no different. As has already been discussed on this blog, the release of 2022–23 results revealed issues that need serious attention—mathematics performance and absenteeism among them—as well as areas in which the state is making stronger progress. Reading proficiency, for example, has rebounded surprisingly quickly, post-pandemic.
But the performance of urban schools, particularly those in the Ohio Eight cities, remains concerning. This analysis examines the most recent data from areas, starting with an overview of proficiency rates and then moving to district and charter school results along three key report card components—performance index, value-added, and overall ratings. Spoiler alert: The results are sobering across the board, though with a few bright spots.
Student proficiency
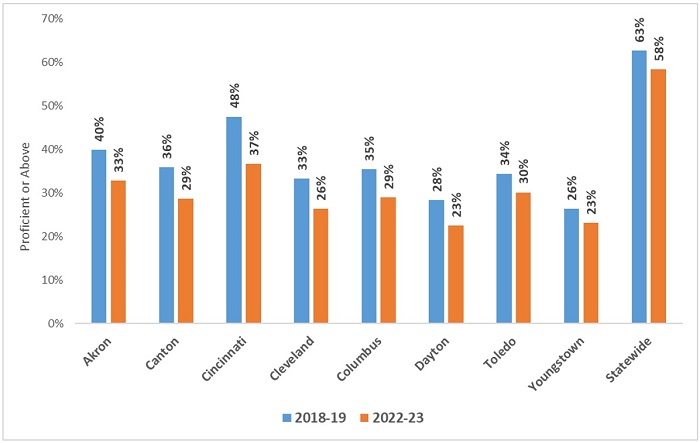
Historically, proficiency rates in the Ohio Eight cities (listed in figure 1) have fallen far below statewide averages, reflecting in part higher poverty rates but also greater school dysfunction. Regrettably, not much changed on the proficiency side in 2022–23. An abysmal 29 percent of Columbus students achieved proficiency on last year’s state exams; rates were even lower in Cleveland (26 percent), Dayton (23 percent), and Youngstown (23 percent). As the chart below indicates, proficiency across all eight of the districts remained below pre-pandemic levels. Compared to the statewide averages, proficiency rates across the Ohio Eight lagged some 20 to 35 percentage points behind.
Figure 1: Percent of students scoring proficient or above on state exams, Ohio Eight districts and statewide

Low achievement translates into poor post-secondary readiness outcomes. This year’s report card shows that less than 1 percent of Cleveland students passed three or more AP exams during high school, 5 percent achieved college-ready benchmarks on the ACT or SAT exam, and less than 1 percent earned industry-recognized credentials. In Columbus, rates were 2 percent (AP), 6 percent (college-ready), and 14 percent (credentials). In sum, poor literacy and numeracy continues to plague Ohio’s major cities, and remains an enormous barrier to economic and social advancement for the 200,000 plus students who live in urban communities.
* * *
Clearly, students in the Ohio Eight are in tremendous need of excellent schools. What does school quality look like in these cities? The next sections turn to the results of both district and public charter schools on rated components of the report card.
Performance index
Ohio has long reported performance index (PI) scores as an overall measure of student achievement in a school or district. Like a weighted GPA, schools receive more credit on this measure when students achieve at higher levels on state exams. The PI also combines results across all state assessments, including those in English language arts, mathematics, science, and the high school exams for U.S. history and government. Though they are somewhat different measures, PI scores are close counterparts to proficiency rates. As noted in the discussion above on proficiency rates and indicated in the PI data below, results on both measures tend to correlate with a school’s demographics.
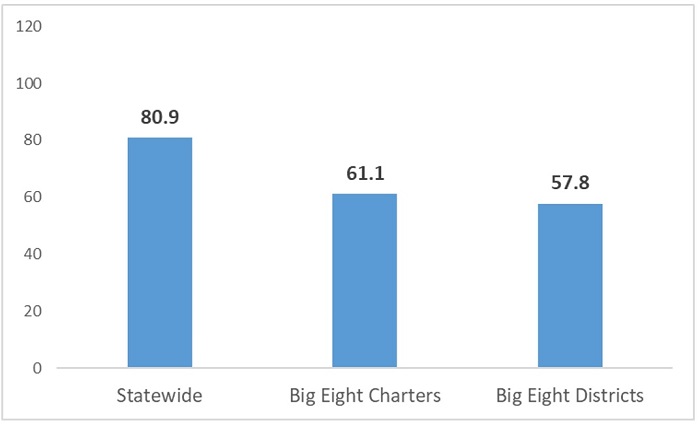
Figure 2 shows average PI scores for the Ohio Eight districts and the charter schools located in those cities. As is clear, scores across both sectors trailed well behind the statewide average—reflecting, again, the large achievement gap—but charters on average posted slightly higher scores than their district counterparts (61.1 versus 57.8).
Figure 2: PI scores in the Ohio Eight versus statewide, 2022–23

As for PI results by city, charters edged the local district in Cleveland, Columbus, Dayton, and Toledo, but lagged in Akron, Canton, and Cincinnati. The highest-scoring charter sector was Columbus’s (63.3) while Cincinnati’s school district was tops on the district side (62.8). Though not displayed here, the vast majority (90 percent) of Ohio Eight district and charter schools received 1- or 2-star ratings on the Achievement report card component, which is based entirely on PI results.
Table 1: PI scores by Ohio Eight city, district and charter

Value-added
Alongside the PI, value-added (VA) is the other key measure on the report card. Unlike the PI, which captures achievement at a point in time, VA tracks individual student’s learning gains or losses over time. This look at academic “growth” allows us to identify effective schools that are helping students make significant progress—no matter where they start the year (whether low- or high-achieving). Conversely, VA also flags less-effective schools that are allowing achievement to slip. For instance, VA would ding a school whose average student falls from the 50th to the 45th percentile. Because VA takes into account students’ prior achievement, it produces more poverty-neutral results. As we’ll see, schools in the Ohio Eight can and do receive top marks on this measure.
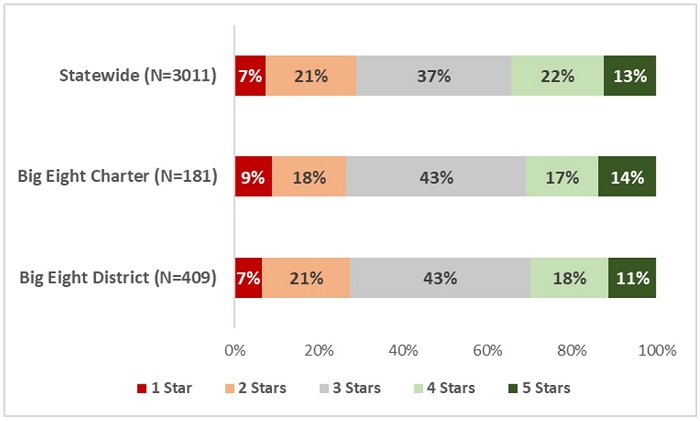
Figure 3 displays the Progress component ratings, which are based solely on schools’ VA results. Statewide, 35 percent of school buildings received 4 or 5 stars on this component, while another 28 percent received 1 or 2 stars. Progress ratings were similar in the Ohio Eight, with 29 percent of district schools receiving 4 or 5 stars and 31 percent of charter schools receiving such ratings. While most students attending these schools still need more help to reach proficiency, their schools are helping them make progress toward that goal. On the other side of the spectrum, 28 and 27 percent of Ohio Eight district and charter schools, respectively, received 1 or 2 stars. Almost all of these are struggling schools where achievement is weak and students are falling even further behind.
Figure 3: Progress ratings statewide and for Ohio Eight district and charter schools

Table 2 shows the percentage of Ohio Eight schools receiving 4 or 5 stars for Progress by individual city. When the focus is on top-rated schools, charters outperformed district counterparts in Akron, Cincinnati, Columbus, and Dayton in 2022–23. Meanwhile, districts performed better in Canton, Cleveland, Toledo, and Youngstown.
Table 2: Progress ratings by Ohio Eight city, district and charter

Overall ratings
For the first time since 2019, Ohio assigned an Overall rating that summarizes school performance on the various components of the report card. These elements include the PI (i.e., Achievement) and VA (i.e., Progress) measures, which are weighted more heavily in the Overall rating calculations, as well as the Gap Closing, Graduation, and Early Literacy components. For the sake of brevity, we omit discussion of the latter three dimensions.
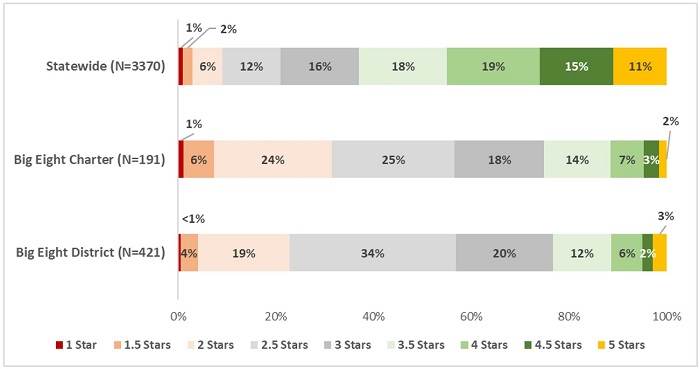
Figure 4 displays the Overall ratings statewide and for the Ohio Eight. As is evident, marks were generally lower in the Ohio Eight compared to statewide: 37 and 23 percent of Ohio Eight charter and district schools received 2 or fewer stars, a much higher rate than statewide (9 percent). At the same time, fewer Ohio Eight schools received top marks. As for district and charter comparisons, the results were something of a mixed bag. On the one hand, charters—as noted above—had a higher percentage of low-rated schools than districts. Yet on the other hand, charters also had a slightly higher proportion of highly-rated schools: 26 percent of Ohio Eight charters earned 3.5 stars or above versus 23 percent of Ohio Eight district schools.
Figure 4: Overall ratings statewide and for Ohio Eight district and charter schools, 2022–23

***
Let us conclude with four takeaways.
1. No one should be satisfied with student achievement in the Ohio Eight. There remains much work ahead—in both charter and district sectors—to help urban students read and do math on grade level.
2. Ohio is in sore need of more high-performing urban schools. Even on the value-added measure, which provides a clearer picture of school effectiveness, only a minority of Ohio Eight schools—roughly one in three—are pushing students forward. That’s simply not enough, especially in the wake of the pandemic.
3. Progress and Overall ratings help identify high-quality urban schools. In the Ohio Eight, schools receiving 4- or 5-star Progress ratings, or 3.5 star or above Overall ratings, merit a closer look from school-shopping parents, as well as community leaders looking to support the growth of excellent schools.
4. Narrowing Ohio’s staggering achievement gaps should stay atop the policymaking agenda. No state has successfully closed the achievement gap. But that doesn’t give Ohio leaders a free pass. All students—no matter their zip code or background—should be able to read and do math proficiently by the end of high school. How exactly to accomplish that goal remains a complicated question, but state leaders can ensure that achievement gaps continue to receive attention and that serious ideas to narrow them are discussed.
Ohio’s annual report card always elicits a variety of responses. Sometimes, it’s validation for a job well done. Other times, it means some soul-searching. The Ohio Eight results continue to reveal the sobering fact that tens of thousands of urban students are struggling with basic math and reading skills. At the same time, it’s another urgent call for more and better public school options in Ohio’s largest cities. Every student deserves the opportunity to reach their full potential. In the Ohio Eight, there is much work ahead to help all students achieve their dreams.


