In my annual review of Ohio report cards, I concentrate on the performance of public schools located in the state’s major cities, known as the “Big Eight.” The reason is twofold. First, the need to shine a light on school quality is most acute in these areas, as student achievement falls well below state averages. Second, a large majority of the state’s public charter schools are located in the Big Eight, and we at Fordham have long sought to gauge the extent to which they provide strong educational options for children living in these high-poverty areas.
This emphasis on urban education, regrettably, means that we can only scratch the surface when analyzing other parts of the state, some of which also face academic challenges—rural communities in particular. In fact, an astute reader of this year’s report asked about how many rural schools meet our “honor roll” criteria used to identify high-performing Big Eight schools.
Examining school quality in rural communities is certainly worthwhile. Although proficiency on state exams is not as sluggish as urban areas, rural students, especially those from high-poverty areas, tend to struggle to achieve college-ready targets or complete a college degree. For instance, a recent analysis found that 20 percent of students from rural Southeast Ohio meet the ACT or SAT college remediation-free targets, 6 percentage points below the statewide average. In the low-income Appalachian counties of Monroe and Vinton, just 11 percent of students reach this college readiness goal.
Rural students are deserving of great schools that prepare them for college and career. But what does school quality look like in their neck of the woods?
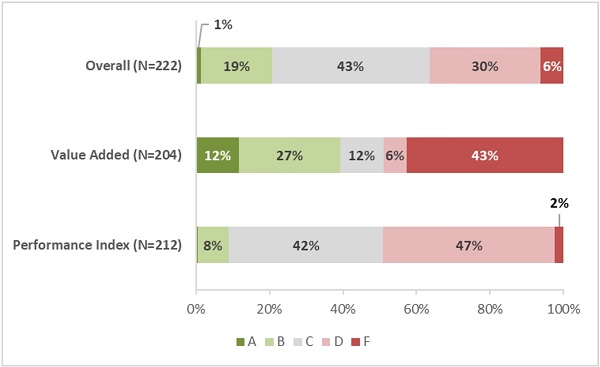
To explore this question, I split rural schools—identified as such via the state’s typology system—into two groups based on their student poverty levels. Figure 1 displays 2018–19 ratings for high-poverty rural schools, which enroll at least 50 percent economically disadvantaged (ED) students. It shows considerable variation in school ratings, especially on the overall and value-added ratings. For example, 20 percent of high-poverty rural schools earn impressive A’s or B’s on the state’s overall rating, while another 43 percent achieve respectable C’s. Meanwhile, just over one-third of these schools are struggling, having received D’s or F’s as their overall rating. The value-added results reveal even greater variation in ratings, but the performance index ratings of this group of schools are largely C’s or D’s.
Figure 1: Ratings of high-poverty rural Ohio schools, 2018–19

Source: Ohio Department of Education. Note: This chart displays the rating distribution of rural schools that enroll at least 50 percent economically disadvantaged students. The overall rating combines results from the various report card components (including value added, performance index, and a number of other measures); value added refers to the state’s student growth measure; and the performance index is a proficiency-based measure that reflects pupil achievement on state exams.
In comparison to the urban Big Eight, high-poverty rural schools tend to receive better ratings. For instance, 34 percent of Big Eight schools receive overall C or above ratings, while 63 percent of poor rural schools achieve that mark. The stronger overall ratings reflect these rural schools’ higher ratings on components such as the performance index, a measure on which nine in ten Big Eight schools receive D’s or F’s. The value-added ratings, however, are more similar between high-poverty rural and Big Eight schools (39 percent A’s or B’s versus 28 percent, respectively).
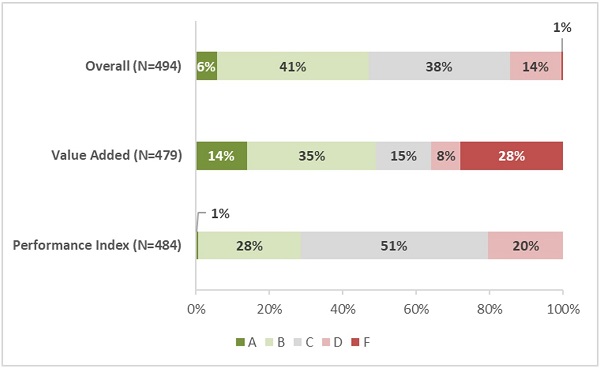
Turning to lower-poverty rural schools, Figure 2 shows that the overall ratings of this group are modestly higher than their poorer counterparts. Almost half of low-poverty rural schools achieve A’s or B’s on the overall rating and another 38 percent earn C’s. Finally, 14 percent receive overall D’s, and there are just a few F’s. The value-added ratings vary widely across the categories, and the distribution of ratings tracks relatively closely with that of high-poverty rural schools. (This is somewhat predictable as value-added ratings are less tied to school demographics.) As for the performance index, a slight majority of these schools earn C’s, while another 28 percent earn B’s. The advantage on the performance index and other “status”-type measures help to explain the higher overall ratings posted by low-poverty rural schools relative to their higher-poverty counterparts.
Figure 2: Ratings of low-poverty rural Ohio schools, 2018–19

Source: Ohio Department of Education. Note: This chart displays the rating distribution of rural schools that enroll less than 50 percent economically disadvantaged students. A short description of the ratings can be found under Figure 1.
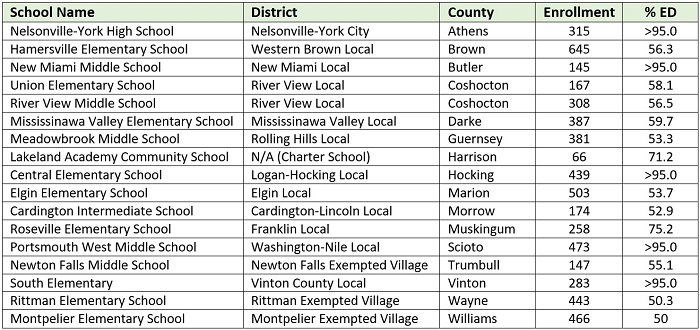
The general picture of school quality in rural areas is a mixed bag. There are a significant number of schools that perform very well overall, while other schools struggle when it comes to both growth and achievement measures. To put a special spotlight on exceptional schools that are “beating the demographic odds,” the tables below display twenty-three high-poverty rural schools that meet the same rating criteria we used to identify quality urban schools in our recent report. Table 1 shows seventeen schools that, for both of the past two years, earned an overall rating of a C or above and achieved an A value-added rating. The next table lists six additional schools that achieved these ratings in only 2018–19. The schools in the “honor roll” below represent 10 percent of all high-poverty rural schools—the same percentage of excellent Big Eight schools identified in our recent study.
Table 1: Second-year honor roll awardees

Table 2: First-year honor roll awardees

* * *
It’s well-documented that low-income students typically face more barriers to academic success. Fortunately, there are rural schools, like those in the honor roll above, that help students overcome the odds. Great schools, whether located in Ohio’s largest cities or its sparsely populated areas, are proof positive that “poverty isn’t destiny.”


