One of the defining characteristics of Ohio’s graduation debate is a lack of data. Back in 2017, when the State Board of Education first suggested weakening graduation requirements, its recommendations were made without clear and detailed data indicating a need for such sweeping changes. Even worse, the alternatives they endorsed included non-academic measures such as work or community service experience and 93 percent attendance during senior year. When these weakened alternatives were made into law for the class of 2018, it marked the first time in twenty-five years that Ohio students could earn a diploma without demonstrating some level of objective academic competence.
Almost a year and a half later—six months after the class of 2018 walked across the stage—the Ohio legislature passed a bill that extended the weakened requirements to the classes of 2019 and 2020. At the time of the vote, the public still didn’t know how many students in the class of 2018 used the alternative pathways to graduate. It wasn’t until the December state board meeting—a few days after the legislature approved the extension—that data about students using the alternative graduation pathways were released. This delay was unfortunate, as it could have informed the debate and may have ultimately swayed some votes.
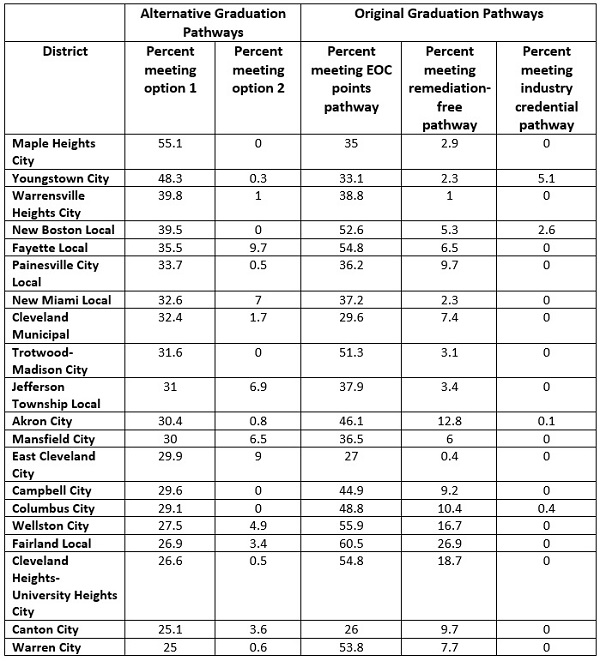
These data show the percentage of students in each district who graduated by meeting one of the original three pathways—end of course (EOC) exam points, remediation-free ACT or SAT scores, or industry-recognized credentials—or one of two additional pathways that were labelled “Option 1” and “Option 2.” Option 2 was limited to students in career-technical programs, but option 1 included the weakened alternative measures and was available to all students.
The table below lists the twenty districts with the highest percentage of students using option 1 to graduate in 2018. It also includes the percentage of students using option 2 and each of the three original pathways. It’s important to note that among the original pathways, some students met multiple ones and thus are included in more than one column. For instance, a student who met both the EOC and remediation-free requirements would be included in both statistics. The percentages listed for options 1 and 2, on the other hand, are mutually exclusive; students who are reported as having met these options met only one of those two pathways and not any of the original three.

We can draw a few conclusions from these data. First, all of these districts had at least a fourth of their graduating class take advantage of the weakened alternatives to graduate. Some of them—like Fairland Local and Wellston City—had a majority of their students demonstrate basic academic competency by passing EOC exams. But other districts, like Cleveland Municipal and East Cleveland, had more students graduate using the alternative pathways than they had students passing state exams. When considering these numbers, it’s important to remember that students do not need to score proficient on all of the exams to use them to graduate. In fact, it’s mathematically possible for a student to fail to earn proficiency on all four math and English EOCs and still earn enough points to graduate.
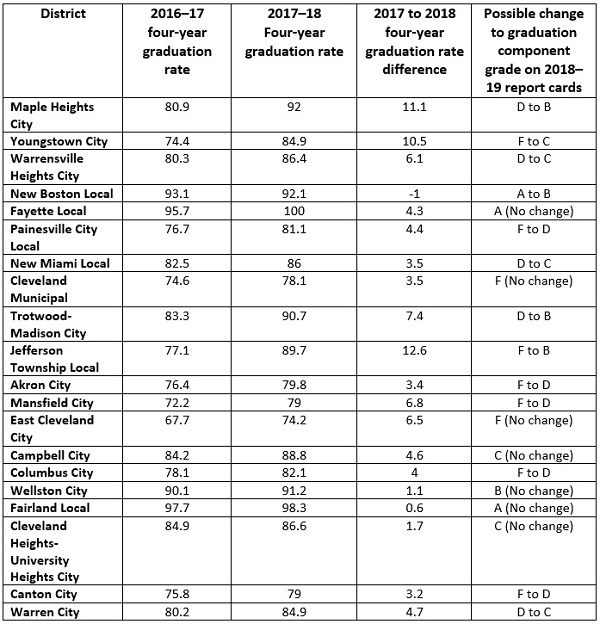
Second, some districts will likely see significant increases to their graduation rates because of the high number of students who took advantage of the weak alternatives. Since the state accountability system calculates grades for the graduation rate component on a one year delay, increases for the class of 2018 would result in improved graduation rate grades on 2018–19 school report cards. Check it out:

Based on these projections, only one of the twenty districts will earn a lower graduation rate component grade in 2018–19: New Boston Local, which may drop from an A to a B. Seven districts will see no change in their grades. But twelve districts could get higher grades this year than they did last year. Seven of those twelve will rise from an F to a passing grade, and at least two districts—Maple Heights and Trotwood-Madison—will jump from a D to a B. Since the graduation rate component counts for 15 percent of a district’s overall grade, a suddenly higher graduation rate grade could mean that some of these districts avoid overall Fs—which could help them sidestep being placed under the authority of an academic distress commission.
The outsized impact of these watered down requirements on school report cards should give lawmakers pause. Several of the districts with dramatically higher graduation numbers have a history of much lower rates, so it will be tempting to celebrate the higher figures as signs of growth. Doing so would be a mistake. The only reason many of these districts will have higher rates is because the state codified much easier graduation pathways into law. Lowering the bar and getting better results is not cause for celebration, and it’s not good policy. The basis of good policy and meaningful school improvement is data that are both honest and timely. So far, Ohioans haven’t been given either.


