Last June, Governor DeWine and the General Assembly enacted important reforms to Ohio’s school report cards in House Bill 82 (HB 82). The revamped framework makes a number of improvements such as reducing the number of ratings in the overall system and streamlining unnecessarily complex components. To their credit, lawmakers made these changes while maintaining the state’s longstanding focus on student academic outcomes and its commitment to transparency for such results.
While the legislature did much of the heavy lifting, it also tasked the State Board of Education to iron out some of the finer details. Most notably, the board must set the “grading scales”—i.e., the performance standards that districts and schools must achieve in order to receive certain ratings. With the new report card rolling out this fall, a State Board committee recently dug into options for setting those standards.
Much like Goldilocks and the “just right” bowl of porridge, policymakers need to implement grading standards that don’t set the bars absurdly high or abysmally low. Fortunately, key members of the board—across the political spectrum—recognized the importance of such a balance by articulating principles that recognize our high aspirations for Ohio schools and students, while also seeking fair and achievable targets.
Now that the board committee’s proposal is out for public review, how did it do? In short, its plan for school grading is on the right track. Let’s take a closer look at its proposals for the five report card components.[1]
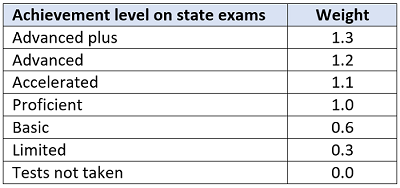
- Achievement: Under the HB 82 reforms, lawmakers made the state’s performance index the sole measure that determines this component rating—thus eliminating the use of proficiency rates in the rating system. That was the right move, as the performance index offers a more comprehensive picture of achievement than straight-up proficiency rates. As the table below displays, the index awards schools additional credit—or weight—when students achieve at higher levels, much akin to a weighted GPA.
 The board committee discussed the possibility of altering these weights, but it commendably resisted the urge to fiddle. Importantly, the “asymmetric” weighting ensures that the extra credit for high achievers doesn’t mask the struggles of other learners in a school. Moreover, maintaining the index’s design is essential to tracking achievement trends over time. In terms of the grading scale, the board committee proposed to keep the one used in the old system, a decision that upholds the state’s historically rigorous standards for its achievement component.
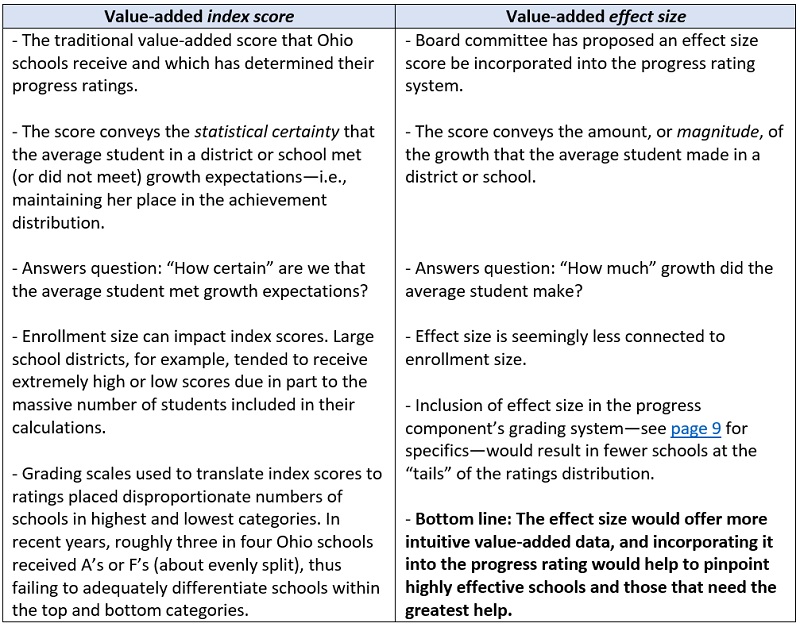
 - Progress: In conjunction with point-in-time snapshots of achievement, academic growth has long been the other key measure on the school report card. Since 2008, Ohio has incorporated into its report card a value-added growth measure, which track changes in individual students’ achievement over time to yield estimates of schools’ contributions to learning, i.e., their educational “effectiveness.” Under the HB 82 reforms, growth will be featured even more prominently on the report card, but lawmakers did make some simplifying changes to the progress component. For one, lawmakers made the district- or school-wide value-added score the sole measure used to determine the progress rating (previously, three subgroup scores also contributed). In addition, legislators tasked the Ohio Department of Education with exploring improvements in the way value-added data are used to formulate school ratings. Based on the department’s work, the board committee proposed an “effect size” measure that would be paired with traditional value-added “index scores” to generate schools’ progress ratings. The table below describes the measurements and discusses how the inclusion of an effect size would affect—and greatly improve—the design of the progress component.

- Gap closing: This component consists of the achievement and growth results for various student groups defined in federal and state law (e.g., economically disadvantaged and students with disabilities). Despite the importance of subgroup accountability, the old system’s gap closing component was far too complicated and it also failed to account for both the growth and achievement of these groups. To their credit, the legislature corrected these flaws by outlining a new gap closing component that should be more transparent and complete. In keeping with legislative intent, the board committee has proposed a straightforward set of indicators based on whether student groups meet growth, achievement, and graduation targets. Also included are indicators based on gifted students’ data, chronic absenteeism, and English learners’ progress on an alternative assessment. To see how results are likely to appear on a report card, see pages 18–20 of this document. Given the overhaul, the committee wisely proposed a brand new grading scale. Under its plan, for instance, a school would need to meet 60 percent of the indicators to achieve a top rating, while those meeting less than 10 percent would receive the lowest rating.
- Early literacy: Much like gap closing, the legislature also overhauled the state’s early literacy component. Previously, this dimension focused solely on grades K–3 students who were off track in reading. Under the new framework, schools’ third grade reading proficiency rates and grade-promotion rates under the Third Grade Reading Guarantee are now included. Those data points were added to address concerns that the component was too narrowly constructed and didn’t award credit when third graders passed reading standards. The new data elements, however, pose a challenge in terms of implementation—how to combine the measures to determine a component rating. Here, the board committee recommended a weighted average across the three data points, a sensible approach that is also used in the graduation component (see below).[2] As for grading scales, the committee proposed setting a fixed scale—a more stable approach than the old system in which the early literacy grading scale changed each year. Schools with a weighted percentage above 92 percent would receive a top rating, for instance, while those with percentages below 63 percent would receive the lowest mark.
- Graduation: The legislature made no major changes to the graduation component, continuing a policy that uses both the four- and five-year graduation rates to produce a component rating. The board committee, not surprisingly, suggested only small changes in this area. Under its plan, the component rating would be based on a weighted four- and five-year graduation rate,[3] rather than the more complicated points system previously used to combine these rates. The committee proposed only minor tweaks to the grading scales.
* * *
To their credit, Ohio lawmakers rolled up their sleeves and made careful revisions to the state’s school report card framework. The full State Board of Education—if it follows the direction being charted by its Performance and Impact Committee—is now poised to follow in the legislature’s footsteps by thoughtfully implementing the technical details. In the end, the school report card is as much art as science, and with any luck, Ohio will soon have a clear, fair, and honest portrait of educational performance across the state.
[1] These five components will appear with ratings in fall 2022. An overall rating that combines the five components will appear in fall 2023, and a sixth component based on college, career, and military readiness data may be added in fall 2025. The board committee, due to the significant revisions in the components’ design and some limitations in the current data, has proposed to reevaluate the grading scales within the next two years to ensure their continuing rigor and fairness.
[2] For instance, a school with a 95 percent promotion rate, an 80 percent proficiency rate, and 70 percent of its off-track readers moving to on track would have a weighted early literacy average of 83 percent. According to statute, the off-/on-track rate receives 25 percent of the component weight; promotion, 35 percent; and proficiency 40 percent.
[3] For instance, a school with an 85 percent four-year and 90 percent five-year rate would have a weighted graduation rate of 87 percent. According to statute, the four-year rate receives 60 percent of the weight and the five-year rate, 40 percent.


