In fashion these days are craft breweries, shabby-chic decor, and farm-to-fork restaurants. But what’ll get you a seat at the cool-kids table in the education world? At the top of the list is dismissing—or is it “dissing”?—standardized test scores. Just consider some of the latest reactions, fresh off the release of Ohio’s 2017–18 school report cards. An unnamed Columbus City Schools official told the Dispatch, “There’s far more to measuring a child’s learning and growth than what’s scored on the state’s annual Local Report Card, which offers only a limited snapshot.” The Zanesville superintendent told his local paper, “When we look at that [report card data], I don't think it accurately reflects the work of our students and teachers.” Up in Northeast Ohio, a local school official told the Akron Beacon Journal, “I’m not panicked because state tests suggest we do poor in a certain area. I don’t necessarily think state tests are valid and reliable.”
It’s true that test scores don’t capture important intangible qualities of schools. And yes, students are “more than test scores”; they also need to develop character traits that enable them to live as responsible adults. But none of this gives us license to wave away test scores. Whether we like them or not, standardized exams in math and English remain important markers of whether students are on-track for success later in life.
Let’s look at the relationship between state test scores—using the performance index, a composite measure of achievement on all state exams—and college completion rates, as reported on Ohio’s 2017–18 report cards. But before diving in, a few caveats. One, the charts below don’t show the test scores and college outcomes of the same students; this requires data that tracks pupils over time. Second, they do not consider districts’ “value added” contributions to test scores or completion rates apart from students’ background (we don’t have data on completion). Since the following charts are not meant to single out districts for their effectiveness or lack thereof, their names are removed. Lastly, the data are correlational—a number of other factors might drive college completion rates.
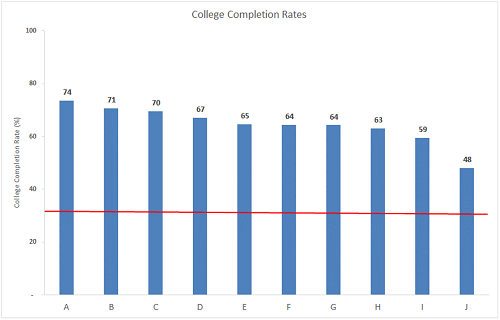
The results, while not scientific proof, point to a positive relationship between student test scores and post-secondary outcomes. Figure 1 shows the ten highest-performing districts on the state’s performance index. All of these high-test-scoring districts have much higher percentages of their alumni complete college than the statewide average of 33 percent (shown in the red bar). Is it a perfect correlation? Well, no. One district, for example, posted sky-high test scores last year but only modestly above average college completion rates.[1] Of course, at a student level we’d invariably find young people who tested well but didn’t complete college, and vice-versa. Still, on balance, graduates of Ohio’s high-achieving districts tend to fare well in terms of completing a college degree—a result that matches most of our intuitions about the relationship between achievement in K–12 and success in college.
Figure 1: College completion rates of the ten highest performing districts on Ohio’s 2017–18 Performance Index
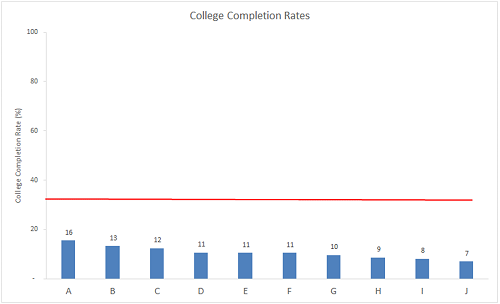
Note: This chart displays the percentage of district graduates in the class of 2011 who completed a two- or four-year college degree six years after finishing high school. The red bar displays the statewide college completion average of 33 percent for this graduating class. The same note applies for figure 2.
Now let’s look at the other end of the spectrum. What are the college-completion rates among districts that have the lowest test scores in the state? Figure 2 shows that a paltry one in ten students who attended these low test scoring districts graduated from college, a rate that is well beneath the statewide average of 33 percent. The lower completion rates reflect in part lower college enrollment rates among students from these districts.
Figure 2: College completion rates of the ten lowest performing districts on Ohio’s 2017–18 Performance Index
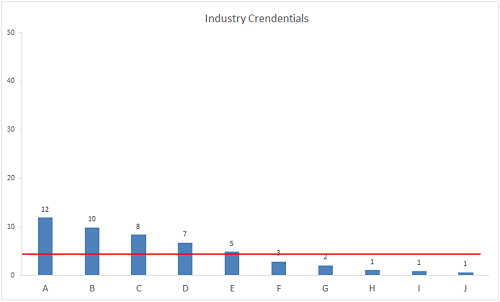
Graduates may be foregoing college and pursuing highly skilled careers right after high school instead. The data on workforce outcomes of young people are unfortunately not readily available (something that should change), so the best indicator we have on hand is whether students earn industry-recognized credentials that can open career doors for students of all backgrounds. Figure 3 shows that small fractions of graduates from low-achieving districts earn industry credentials—though encouragingly, a few of the lowest-achieving districts have higher industry credentialing rates than the statewide average of 4.4 percent.[2] Taken on the whole, however, figures 2 and 3 paint a troubling picture about the college or career outcomes of the vast majority of young people who attend low-test-scoring districts.
Figure 3: Industry credentialing rates of the ten lowest performing districts on Ohio’s 2017–18 Performance Index
Note: This chart displays the percentage of graduates in the classes of 2016 and 2017 who completed an industry-credentialing program before graduation. The red bar displays the statewide industry-credentials-earned average of 4 percent for these graduating classes. These percentages predate the state’s new graduation requirements, which encourage career-and-technical students to pursue credentials.
***
As the editorial board at the Toledo Blade recently did, some will chalk up low-performing districts’ results to poverty. Sadly, there remains a link between students’ achievement and their background characteristics—one that reformers have long sought to break (and some Ohio schools are indeed doing). But the answer isn’t to excuse away test scores or stick our heads in the sand and pretend like they don’t matter. As the figures above suggest, state exam results are important signals about the knowledge and skills students possess—the “human capital” that is critical to success in today’s colleges and workplaces. Standardized tests may never win popularity contests, but that isn’t the point. They offer communities insight into how many students are on a pathway for success after high school, and provide parents with information on whether their own children are keeping pace. In some cases, test results foreshadow good things to come, while in others they show just how far we need to go.
[1] When considering all Ohio districts, the correlation between the performance index and college completion rates is strong (r = +0.78). A correlation of +1.0 would indicate a one-to-one positive relationship between the performance index and completion rates, while 0.0 would indicate no correlation.
[2] Though not displayed here, Ohio’s high-achieving districts also have few students earning credentials (less than 2 percent across the top performing districts on the performance index).


