When Gov. Kasich first introduced his biennial budget for Ohio over a month ago, it was quickly apparent that he and his administration were serious about overhauling the state’s poorest-performing schools. Fordham has long advocated for applying sanctions to not only poorly performing charter schools but chronically troubled district ones as well. In the governor’s budget, and left completely intact in the version reported out by the Ohio House, is a provision that would require districts to reconstitute schools that rank in the bottom five percent of all public district schools statewide (according to Performance Index (PI) scores, weighted averages of a school’s students’ performance on the state’s exams across all tested subjects and grades) for three consecutive years and are rated “D” or “F” by the state.
In similar fashion to the federal School Improvement Grant (SIG) program, districts with such schools could opt to:
- close the school and reassign students to higher performing buildings;
- contract with another district, non-profit, or for-profit entity with a track record of success to operate the school;
- replace the principal and all teaching staff (far more stringent than SIG’s “transformation” option, which would leave half of a school’s teachers in place); or
- re-open the school as a conversion charter school.
Kasich’s budget also imposed other sanctions for chronically underperforming schools, including testing all teachers’ content-area knowledge in such schools (which we caution against) and allowing parents to “trigger” a turnaround (which has since been removed by the House and turned into a small pilot program).
The closure provisions for chronically troubled district schools seem fair and up-to-the-challenge. Yet which schools would be affected by this? How many students would possibly be displaced? Are the schools slated for overhaul according to this provision really the state’s most troubled schools? How many of them are already receiving federal SIG dollars for turnaround?
To answers these questions, we analyzed PI score data of all public district schools in Ohio from the last three school years (2007-08 to 2009-10), as well as school rating and other demographic data. PI scores range from 0-120. (Note: we pulled out those schools receiving a “zero” PI score, as many of them appear to have received that score for some other reason than legitimately scoring zero. For instance, many zero-PI schools previously had scores of above 100 or 90, illustrating that they were actually high-quality schools and not representative of the lowest 5 percent. Re-pulling the data with zero-PI schools would result in a different list of schools.)
District schools slated for turnaround
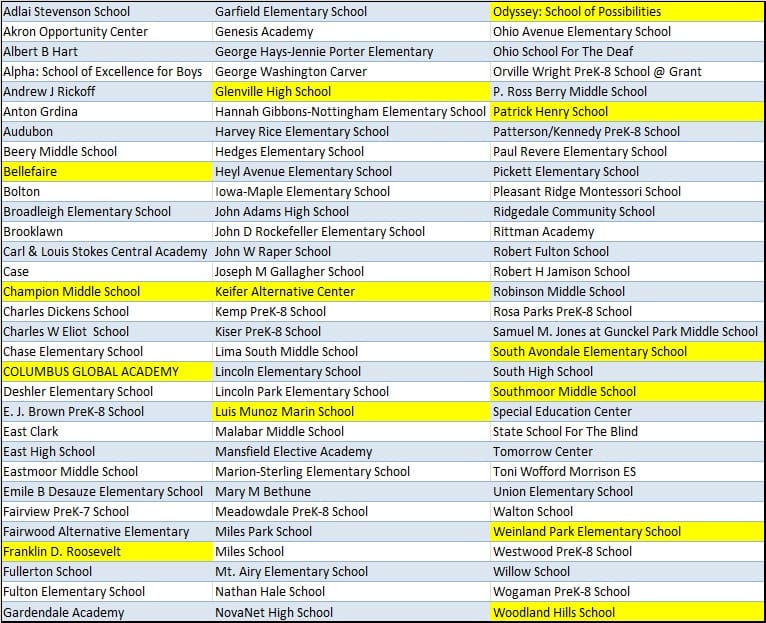
Under the turnaround provision, schools will be closed based on rankings relative to other schools – a metric that some might argue is unfair (why not use an absolute achievement threshold to sanction schools?). However, the list of schools that are in the bottom five percent and rated “D” or “F” is a fairly accurate portrait of the lowest performers in Ohio. The list below includes 93 schools located across 16 different districts, collectively serving 33,695 students. It’s also worth noting that of the 93 schools on the turnaround list, 41 are located in Cleveland, with Columbus coming in second with 13 schools slated for turnaround.
Table 1: Ohio district schools with PI scores in the bottom 5% for the past three years and rated D or F

Source: Ohio Department of Education: Interactive Local Report Card
The average growth in PI over the last three years among these 93 schools is actually negative – overall, the schools slated for turnaround had PI scores fall by 1.4 percent since 2007. In other words, poorly performing schools tend to stay poorly performing or even get worse. Only 39 of the schools experienced positive growth in scores, but except in a few instances, that growth was minimal. Math and reading proficiency averages for these schools are also telling about why they’re in need of a turnaround, with the lowest proficiency rates for third grade reading and math tests at 20.6 percent and 8.7 percent respectively.
Overlap with School Improvement Grants
Of all the schools listed for closure, 13 have been awarded SIG grants totaling $37,546,632 (over three years). Table 1 above highlights the schools (in yellow) that will receive SIG money and that also would be slated for turnaround status under the governor’s new plan. This overlap raises serious questions around how the state’s turnaround proposals and schools’ existing turnaround plans (funded through SIG) would coincide. Would schools using SIG money get a chance to turn themselves around via their current plans (many of which are “transformation” – a less rigorous option not even included in the governor’s turnaround agenda), or would they be forced into immediate action according to the governor’s plan?
In conclusion, the list of district schools slated for turnaround according to Kasich’s budget seems like a fair representation of the state’s truly troubled schools – though obvious questions remain around the interaction of SIG turnaround plans and the options according to this new provision. While the diagnosis of these schools seems right – they are chronically failing and students attending them deserve better – it also begs other policy questions around human capital. Does Ohio have enough teaching and leadership talent willing to take over 93 schools, or charter management groups capable of taking some of them on? Do neighboring schools have space for an influx of students should they be reassigned? These questions merit serious consideration should the state school turnaround provision get passed in the final iteration of the budget.
