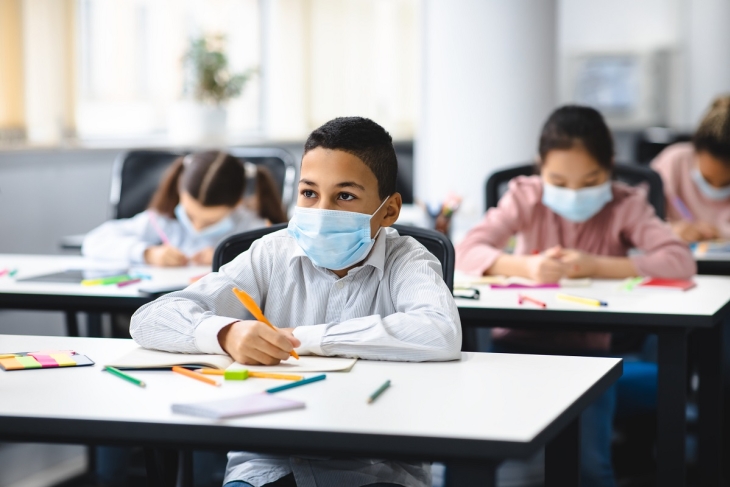
School reopening decisions following emergency pandemic closures have been sources of much parental angst, pundit caterwauling, and political controversy. Now that most of the dust has settled, new research gauges what was really happening in U.S. schools during this turbulent time.
The analysis comes to us from the IZA Institute of Labor Economics and was conducted by two economists from Drexel University and the Université du Québec. They begin with scheduling data from the school-calendar software provider Burbio and link them with the pandemic-era tracker Return2Learn to determine whether public and private schools reported being open for fully in-person or hybrid learning for every individual school day during the 2020–21 school year, which is to say the school year most thoroughly affected from beginning to end by the plague that is still with us. They cover nearly 70,000 traditional district, charter, and private school buildings across the country.
What schools say they are doing and whether students are actually in buildings could be two different things. The analysts thus match anonymized data from more than 40 million cell phones via Safegraph to individuals actually traveling to these school buildings during times they were meant to be open for teaching and learning. “Dwell time” at school sites is used to eliminate people visiting briefly for meals, homework pickup, and the like. The study uses the term “effective in person learning” (EIPL) to denote provision of on-site education that was actually attended by students—with “effective” meaning “being in effect” rather than “being successful at a task”—but it is important to note that this research does not determine the percentage of enrolled students in their building when opened. It is likely to be far less than 100 percent of pre-pandemic numbers.
Although EIPL had dropped below 20 percent of its pre-pandemic level in most places during spring 2020 when Covid first hit, it rose to move than 50 percent on average during the 2020–21 school year. However, large differences were evident. Some of these were regional. For instance, some cities in Florida (such as Jacksonville, Orlando or Tampa) showed EIPL averaging more than 75 percent from September 2020 to May 2021. Conversely, in some western cities (such as Los Angeles, Portland, and Seattle), EIPL remained at an average of 20 percent or less more than a year into the pandemic.
The analysts also find clear cut disparities by school type. Briefly: Public schools provided substantially less EIPL than private schools, with charters ranking below traditional district schools and private nonreligious schools ranking below private religious schools. For both public and private schools, EIPL was lower in more affluent and educated localities with a larger share of dual-headed households, but also for schools with a larger share of non-White students. For public schools, EIPL was negatively related to pre-pandemic school test scores, school size, and school spending per student. Additionally, and perhaps alarmingly, EIPL was negatively related to federal Elementary and Secondary School Emergency Relief (ESSER) funding per student, despite this effort being expressly aimed at helping schools reopen in person learning. The researchers don’t have a plausible explanation for this inverse relationship, although they note that previous research suggested that only a tiny fraction of ESSER funds had been spent on anything as of August 2021. It has also emerged that schools have used Covid-relief money for lots of initiatives that have very little to do with students actually being in their buildings.
In looking at non-school factors that might correlate with EIPL patterns, the analysts found that most of the inverse relation of EIPL with local affluence, education, parental structure, and school funding can be explained by—wait for it—whether the state’s governor was a Republican and the margin by which the local county voted Republican in the 2020 presidential election. Covid vaccination rates also predict higher EIPL (more vaccinations, more in-person learning), while a state’s teacher unionization rate predicts lower EIPL (more union teachers led to less in-person learning, everything else being equal). In contrast, local Covid case and death rates and whether a school is located in a city, suburb, or town/rural area do not have significant predictive power. Explanations for these observations are not offered. The report’s authors are also clear that no causal relationships can be determined with these data. But they do strongly suggest that school reopenings were “driven in large part by policies that align with local political preferences.” Or, more briefly: All the Twitter memes you read or posted were accurate.
SOURCE: André Kurmann and Etienne Lalé, “School Closures and Effective In-Person Learning during COVID-19: When, Where, and for Whom,” IZA Institute of Labor Economics discussion paper (January 2022).


