In the least-anticipated release on record, Ohio published its annual school report cards in mid-September. Due to the cancellation of last spring’s state tests, there’s not much there, though the state did release graduation rates and data about students’ readiness for college and career. Those data reflect the classes of 2018 and 2019, whose high school experiences were unaffected by the health crisis.
With less information available, the news coverage was fairly mundane. (Only “livened up” by another sad statement from the Ohio Education Association implying that poor students can’t learn.) But the sky-high graduation rates of a few districts did catch my eye. Youngstown media, for example, reported that its hometown district posted an impressive 88 percent graduation rate, up from the 85 percent rate of the prior year. Over in Cleveland, CEO Eric Gordon pointed to his district’s 80 percent graduation rate (compared to just 52 percent in 2011) as a sign of rapid improvement.
As figure 1 indicates, the four-year graduation rates in Cleveland and Youngstown—and statewide, too—have indeed been on a tear over the past decade. Given the years of work needed to make a dent in the achievement gap, it’s astonishing to see the disparities between these districts’ graduation rates and the statewide average disappear in the educational equivalent of overnight.
Figure 1. Four-year graduation rates, classes of 2010 to 2019, for Cleveland, Youngstown, and statewide
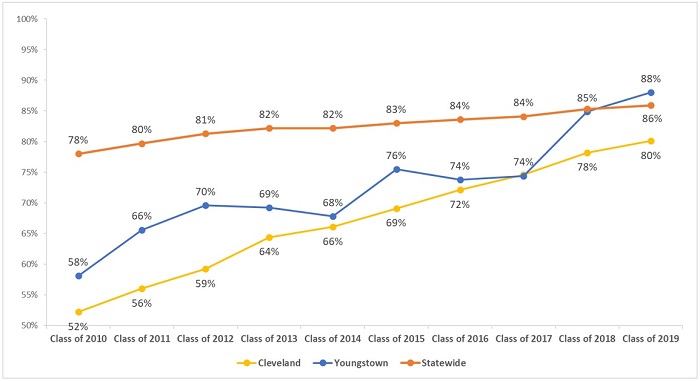
Note: The graduation requirements for the classes of 2010–17 included passage of the Ohio Graduation Tests, the state’s former high school assessments. The requirements for the classes of 2018–19 included achieving one of the following: passing Ohio’s current end-of-course exams, earning remediation-free scores on college entrance exams, meeting career-technical requirements, or meeting alternative requirements based on attendance, volunteer/internships, GPAs, or several other options. Throughout the entire period, students have had to meet state course credit requirements.
But are these rising graduation rates signs of real progress—improvements related to increased achievement and readiness for college and career? Or is something else going on? Pinning down a clear answer isn’t easy with the data on hand, but let’s consider four possibilities.
Possibility 1: It’s higher student achievement. The most straightforward—and hopeful—answer is that the rise in graduation rates reflects higher student proficiency in Cleveland and Youngstown. The results from the Ohio Graduation Tests (OGTs) cast some doubt on this theory. As figures 2 and 3 below indicate, proficiency on the math and reading sections of the OGT did not improve noticeably in either district. Though not displayed below, data from the 2014–15 and 2015–16 end-of-course exams (EOCs)—the years in which most students in the classes of 2018–19 would have been taking these exams—show that proficiency rates in Youngstown and Cleveland continued to fall below the state average.
Figure 2. Proficiency rate on the Ohio Graduation Test in math, 2009–16, for Cleveland, Youngstown, and statewide
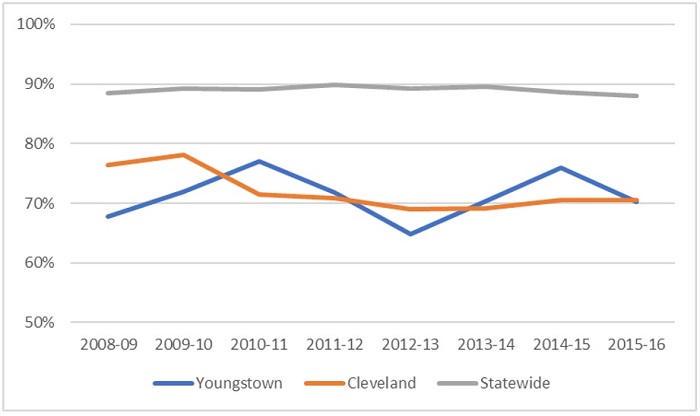
Figure 3. Proficiency rate on the Ohio Graduation Test in reading, 2009–16, for Cleveland, Youngstown, and statewide
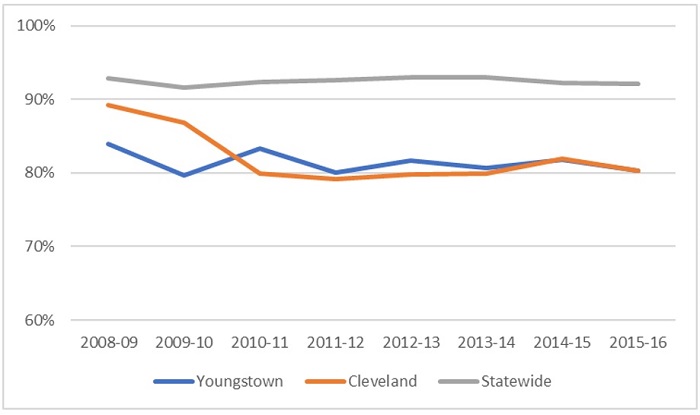
Note: This chart displays cumulative proficiency rates on the OGTs by the end of students’ junior year (students typically took the OGTs for the first time as sophomores). Hence, the 2008–09 proficiency rates generally reflect the results of the class of 2010, while the 2015–16 rates reflect the scores of the class of 2017.
Perhaps the flat high school proficiency rates reflect fewer dropouts. This would be a good thing for students, but it could put downward pressure on proficiency rates, as students who would otherwise dropout stay in school. It’s worth a look, then, at eighth grade proficiency rates: More prepared middle school students might translate into higher graduation rates.
Here, we see some interesting patterns, as shown by figures 4 and 5. First, both districts generally experienced declines in proficiency between 2006–07 to 2008–09, but we see an increase in graduation rates for the corresponding graduating classes (2011 to 2013). Not what you’d expect. Second, after 2008–09, both districts mostly register increasing eighth grade proficiency rates (more so in math), an encouraging pattern that better fits the graduation trend. Third, neither district narrowed the achievement gap relative to the state average in nearly the same way as the graduation gap. By the end of the timeframe shown below (2013–14), eighth grade proficiency rates fell 24 to 36 percentage points below the state average, depending on district and subject, while graduation rates for the class of 2018 matched the state average in Youngstown and fell 7 percentage points below the state average in Cleveland.
Overall, taking the OGT and eighth grade data together, it’s hard to be certain that rising achievement is the predominant factor in the rapid increase in graduation rates.
Figure 4. Eighth grade proficiency rate in math on Ohio end-of-course exams, 2006–14, for Cleveland, Youngstown, and statewide
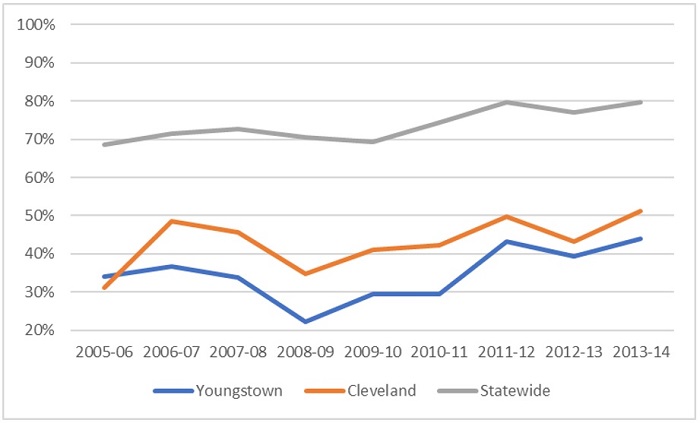
Figure 5. Eighth grade proficiency rate in reading on Ohio end-of-course exams, 2006–14, for Cleveland, Youngstown, and statewide
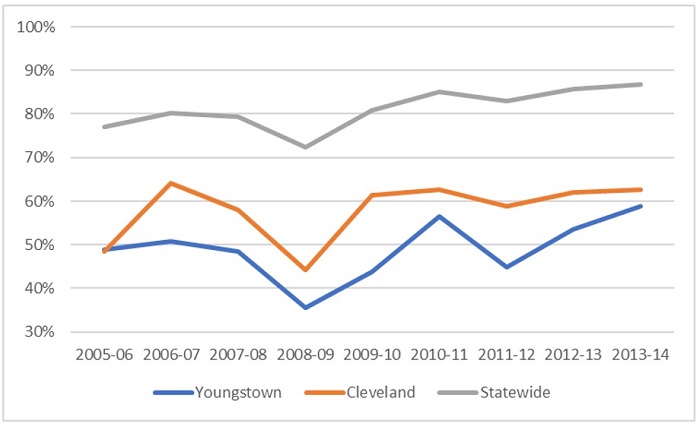
Note: Eighth graders in 2005–06 would have been in the class of 2010 and eighth graders in 2013–14 would have been in the class of 2018. Due to mobility, some eighth graders would not have been in the district’s actual graduating class.
Possibility 2: Students are receiving diplomas based on lower-level alternatives. The most recent jump in graduation rates—particularly noticeable in Youngstown—might reflect the weakened graduation requirements for the classes of 2018 and 2019. Recall that they were allowed to bypass standard requirements and receive diplomas based on less rigorous criteria, such as capstone projects, school attendance, and GPAs. Data from the class of 2018 indicates that the use of alternative routes was prevalent in both Youngstown and Cleveland: 48 and 32 percent of their respective classes received diplomas by virtue of the softer alternatives (detailed data for 2019 are not yet available). While alternatives likely explain much of the jump in graduation rates for the classes of 2018–19, they probably don’t explain the increases for the classes of 2010–17. During that time, the alternative route to graduation was fairly strict.
Possibility 3: Low-achieving students are exiting districts to attend dropout recovery or online charter schools. Another potential factor in the rising graduation rates in Youngstown and Cleveland might be an increasing number of students leaving the district to enroll in dropout-recovery or online schools. If this were happening, districts would see a boost in graduation rates, as they are no longer accountable for the on-time graduation of students who are likely to be credit deficient and academically behind. Both districts are home to a number of dropout-recovery schools and hundreds of students have opted to attend online schools. Both have also experienced larger enrollment declines in high school than other grades. These transfers may have contributed to the rising graduation rates, but it’s hard to gauge their effects without more detailed data.
Possibility 4: Questionable practices that push students to the finish line. The rise in graduation rates might be the result of sketchy credit recovery programs or exemptions for special-education students. The former practice refers to “makeup” courses that are typically offered to students who have previously failed a course. While not necessarily a bad thing, many have questioned the rigor of credit recovery courses. In a 2011 audit of Columbus City Schools, for example, one school employee told auditors that students were covering a year’s worth of material in just a couple days. Other stories from around the nation uncover similar concerns. Although there’s been no evidence of abuse, the civil rights data collection indicates that, as of 2015, roughly 10 to 15 percent of Youngstown and Cleveland high school students participate in credit recovery. As for students with disabilities, Ohio has permitted schools to waive test-score requirements for graduation, even though most special education students have mild disabilities that shouldn’t close the door on their ability to achieve proficiency. Statewide data from 2015–16 show that a sizeable number students with disabilities are indeed excused from meeting standard requirements. Unfortunately, the state doesn’t report data by district on how many special education students are excused.
***
Without more detailed data, we’re left mostly speculating about what rising graduation rates really mean. To help clear things up moving forward, the state should consider greater transparency about high school graduation. Here’s a four ways:
1. Report the percentage of a district’s students who graduate based on each “pathway.” Thankfully, Ohio removed the low-level alternatives given to the classes of 2018 and 2019. Instead, starting with the class of 2023, the state will offer four routes to graduation: 1) achieve competency scores on the algebra I and English II EOCs; 2) earn credit for one math and English dual-enrollment course; 3) meet career-technical requirements; or 4) meet military readiness requirements. Breaking down the data by pathway will allow for a clearer understanding of whether increasing graduation rates are closely tied to improved competency in math and English, or the use of other pathways.
2. Report a modified graduation rate that splits responsibility for transfer students’ graduation based on their time enrolled in each school. The current approach to calculating graduation rates holds a student’s “final” school accountable for graduation (or not). For most students who attend the same high school from freshman to senior year, this calculation works just fine. But this method is problematic when at-risk students transfer, particularly to dropout-recovery or online charter schools. It lets the previous “sending” district off the hook by effectively ignoring any faults that may have led the student to disenroll and seek another option in the first place. It also unfairly penalizes a “receiving” school for failing to remediate years of academic neglect in a short amount of time.
3. Report the percentage of a district’s special-education students who graduate based on an exemption from test-score requirements. Ohio should be more transparent about how special education students receive their diplomas.
4. Report the number of credit-recovery courses students take, and the percentage of required credits that are fulfilled via credit recovery. Including this information would allow policymakers and analysts to flag districts or high schools that rely heavily on credit recovery and look into possible abuses of these programs.
What’s clear right now is that graduation rates are setting records. Far murkier is what’s behind these soaring rates. With more sunlight, we’ll all have a better idea of whether they represent real progress for Ohio students—or are mere illusions.


