Next September, Ohio districts and schools will receive an overall grade on their report cards. While the Buckeye State has generated overall ratings before—using labels such as “effective” or “academic watch”—this will be the first time Ohio assigns an overall A-F grade. Akin to our final GPAs in high school or college, these summative ratings roll up the disparate parts of Ohio’s report cards into a single, user-friendly rating. This letter grade will stand out: Parents, the public, and media will inevitably focus their attention on it.
Because of its prominence, the way Ohio determines these grades is of utmost importance. Ideally, policymakers would create a formula (i.e., weighting system) that strikes a balance between indicators of pupil achievement and growth over time. This ensures that schools are held responsible both for meeting proficiency, graduation, and post-secondary readiness targets—the achievement side of the equation—as well as boosting the year-to-year growth of all students, including those who have not yet met achievement goals or advanced pupils who easily surpass them. Given true differences in school quality, summative ratings should reflect those variations. For instance, a system that assigns D’s or F’s to the vast majority of schools is not helpful to families or taxpayers; the same could be said for a system that hands out all A’s and B’s.
When it comes to the grading formula that Ohio is slated to use next year, questions loom. Does it properly balance achievement and growth? How are the results likely to shake out? Will it effectively separate the wheat from the chaff?
Overall grading formula
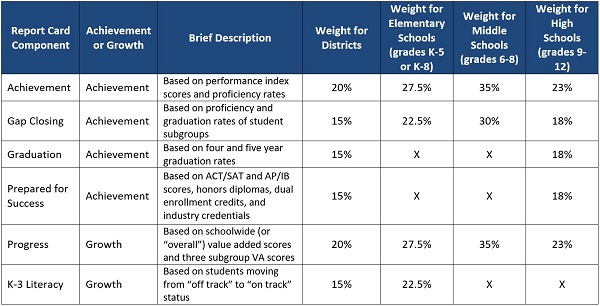
The table below shows the six major components of report cards and the weight they carry in the grading formula that Ohio is set to deploy next year. These weights are applied in a points-based system—schools earn points based on their component ratings—to calculate a weighted average. This average is then translated into the summative grades.
As you can see, the formula for districts, high schools, and middle schools favors achievement-based components relative to growth (65 to 35 percent for districts and middle schools and 77 to 23 percent for high schools). For elementary schools, the weight is split 50-50, though it’s worth noting that K-3 Literacy is not a “growth for all students” measure. Unlike Progress, this component does not capture the learning gains (or losses) of all students; in fact, the growth of vast numbers of pupils are not accounted for, as it simply considers whether lower-achieving students jump from “off track” to “on track” status from one year to the next on diagnostic reading exams. For this reason, K-3 Literacy should be viewed as a crude growth measure with limited usefulness.
Table 1: Ohio’s current components and summative ratings’ weighting system

Source: Ohio Department of Education. More details on each component can be found here.
Forecasting overall ratings in Franklin County
To explore whether this weighting system will yield differentiation in school performance, I analyze data from the 2016-17 school year to predict what the distribution of “overall” grades would have been this year had they been generated. The data examined include only schools in Franklin County—Columbus and its suburbs—an area with a mix of high- and low-poverty schools.
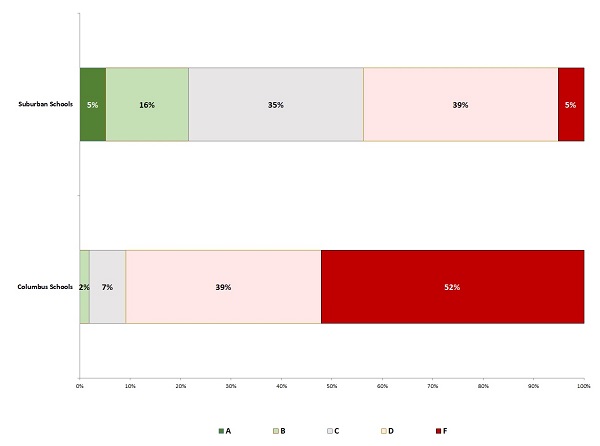
The chart below indicates that higher-poverty schools in Columbus—including both district and charter—are likely to fare poorly under the planned grading formula: About nine in ten Columbus schools receive overall D’s or F’s, results that are similar to what I reported earlier this year, at that time based on 2015-16 data. The systematically poor ratings for high-poverty schools reflects the emphasis of achievement-based measures in the grading formula; as numerous analyses have found, high-poverty schools tend to struggle on measures such as proficiency and graduation rates due in part to factors outside of their control, most notably students’ family incomes. High-growth Columbus schools—including three recently awarded ODE’s coveted Momentum Award—are assigned mediocre to abysmal overall ratings.
Suburban schools fare better in this system relative to city schools—not unexpected given the higher average achievement levels, and higher socio-economic status, of pupils residing in these wealthier communities. As the chart below indicates, roughly one in five suburban schools is likely to receive A’s and B’s, ratings that are virtually non-existent among Columbus schools. But even suburban schools have some reason to worry: Upwards of 40 percent could receive D’s or F’s under Ohio’s current system. This pattern is partly explained by the fact that several of the report-card components are generally harsh on all schools, not just high-poverty ones. For instance, the majority of Ohio districts received D’s or F’s on the Achievement, Gap Closing, and Prepared for Success components in 2016-17 (54, 63, and 68 percent respectively). Of course, there are also pockets of less affluent suburban schools around Columbus that face challenges similar to city schools; they also receive lower ratings under this system.
Chart 1: Predicted distribution of overall grades under Ohio’s current summative rating formula

Note: Columbus schools include district and any Franklin County charter school (almost all are located within the jurisdiction of Columbus); the number of Columbus schools is 163. Suburban schools include those operated by the following districts: Bexley, Canal Winchester, Dublin, Gahanna-Jefferson, Grandview Heights, Groveport-Madison, Hamilton, Hilliard, New Albany, Reynoldsburg, South-Western, Upper Arlington, Westerville, Whitehall, and Worthington. The number of these schools is 176. The same schools and counts apply to Chart 2.
The two major takeaways from this chart are the following. First, the summative rating formula that Ohio is on the verge of implementing won’t differentiate between good and bad high-poverty schools—it lumps almost all of them into the D or F camp. These overall ratings will fail to offer families living in these communities any meaningful way to identify quality schools. Second, it may even lead to ratings for suburban schools that may not be believable to many middle-class families (bear in mind that 40 percent could be rated D’s or F’s, and only 20 percent could get A’s or B’s). This could lead to uproar and mistrust over the report cards themselves, rather than being seen as productive, reliable tools that help to inform decision making.
A different approach
What if legislators implemented a more balanced grading formula? What would the results look like then? Table 2 displays a “back to the basics” version of Ohio’s school report cards that contains the key metrics of academic performance, along with a straightforward set of weights. In a forthcoming Fordham report—stay tuned in early December—I make a case that legislators should adopt this type of report-card framework and formula, save for one difference related to gauging schools’ subgroup performance.[1] This formula would provide 50-50 weighting on growth and achievement for elementary and middle schools; for districts and high schools, the weights would tilt more towards achievement-based metrics, as readiness metrics come to the forefront (75 percent weight).[2]
Table 2: Revised components and summative ratings’ weighting system

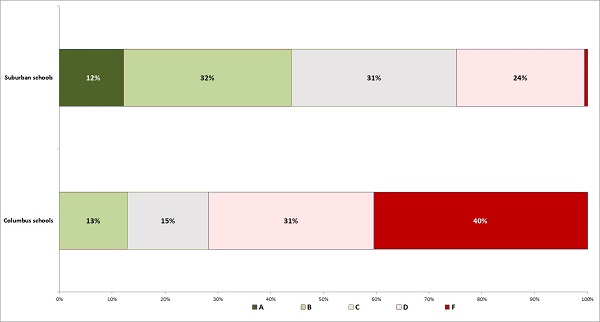
Chart 2 offers a view of how the rating distribution would shift for Franklin County schools under this alternative approach. Notice the greater differentiation among the higher-poverty Columbus schools, largely driven by the increased weight on the Progress component for elementary and middle schools. To be sure, a majority of schools still receive D’s or F’s—they struggle on both achievement and growth metrics—but roughly one in four schools earn B’s or C’s. This formula recognizes that these are schools producing strong growth, though their students still need to make up ground to meet achievement goals. As for suburban schools, they also receive somewhat higher grades. My analysis suggests that about 40 percent could receive A’s or B’s, with roughly a quarter in the two lowest categories. This may be a better reflection of the performance of middle-class schools; most are doing decently to exceptionally well, while a handful are having difficulty spurring student growth.
Chart 2: Predicted distribution of overall grades under a revised summative rating formula

* * *
In the coming months, Ohio legislators should review and make important changes to state law that would result in improved school ratings. A simple, properly balanced report card strengthens public understanding of report cards themselves and produces results that better differentiate school quality—particularly in Ohio’s highest poverty communities. Revamping report cards in this way seems like a win all around for Ohio families, educators, and students.
[1] In the report, I suggest overhauling Gap Closing to create a balanced growth-achievement component based on subgroups’ value added and PI scores. Because this restructuring requires data that are not presently available (e.g., African American students’ value added scores), I do not include this proposed component in these calculations.
[2] With the inclusion of a restructured Gap Closing component, the weight on growth measures for high schools and districts would increase to 30 percent; there would be no difference for middle and elementary schools.
