
CREDO’s latest findings: Virtual charter school students are not learning nearly enough
Dismal news for Ohio policymakers, pundits, taxpayers, and school choice advocates

Dismal news for Ohio policymakers, pundits, taxpayers, and school choice advocates


The Center for Research on Educational Options (CREDO) at Stanford University just released findings from a first-of-its-kind study assessing the impact of online charter schools in seventeen states (including Ohio) and Washington, D.C. The news is dismal—for “virtual” charters nationally, for Ohio, for advocates like Fordham, who argue for e-schools’ rightful place in the school choice landscape but are weary of their quality problems; and most of all, for the students losing dozens (in some cases hundreds) of days of learning by opting into a virtual environment.
CREDO found that virtual charter school students nationally (those enrolled in a public, full-time online school) learned the equivalent of seventy-two fewer days in reading and 180 days in math compared with the traditional public school students to whom they were matched[i]. That’s essentially an entire school year gone to waste in math and almost half a year gone in reading. In Ohio, students in virtual charter schools lost about seventy-nine days in reading and 144 days in math.
It is also striking that—unlike CREDO’s national charter studies, which discovered many states’ charter school sectors handily outperforming traditional public schools—in no state did online charter students outperform their traditional peers in both subjects. Two states’ online charters outpaced traditional public schools in reading; none did in math. Several states did markedly worse than Ohio (e.g., Florida and Louisiana). But this is no consolation. The only silver lining that the Buckeye State might be able to find, and a very faint one at that, is that Ohio’s e-schools were likely a big factor in the state’s overall poor results in the December 2014 Ohio study.
Why are CREDO’s findings on student learning in virtual charters so spectacularly bad, not just in Ohio but across the board? Virtual charter students performed far worse against their traditional public school peers than have brick-and-mortar charter schools (from past CREDO state and national studies). Researchers even analyzed the extent to which the poor performance they observed might be due to “the charter nature of the online schools rather than the online nature”; they found that it was indeed a result of the “online aspect of the schools.”
It’s common to hear defenders of these schools say that the type of student choosing to leave a traditional public school is already losing ground academically, perhaps due to unique barriers that make them fundamentally different from their traditional (and even brick-and-mortar charter) peers. If that is true, and if these fundamental differences are unaccounted for in CREDO’s “virtual twin” matching method, their results could skew in favor of traditional public schools.
E-schools also have high rates of student mobility, a point that CREDO acknowledges: “Mobility rates of students matter because high mobility can be correlated with lower academic growth as well as higher likelihood of dropping out.” The researchers note, “If it were true that students arrive at online schools with academic deficits created by high mobility, we would expect to find online students experienced higher mobility before switching to the online school than the comparison students.” However, they found similar rates of pre-online school mobility among virtual students (9 percent) and the comparison students in the study (8 percent), placing “doubt on the argument that higher pre-online mobility creates widespread, systematic academic deficits” among those opting into virtual charters.
These rationales—that virtual charters underperform because of their uniquely disadvantaged students and high mobility rates—are insufficient to explain the magnitude and consistency of virtual schools’ poor performance. Moreover, CREDO’s findings are consistent with what we’ve learned from Ohio’s report card data. Ohio has twenty-four e-schools, of which half can enroll students from anywhere in the state. (Note that all Ohio virtual schools, even those run by districts, are charter schools.) The Performance Index grades, value-added grades, and four-year graduation rates of Ohio’s statewide virtual schools are listed below (2013–14 data).
[[{"fid":"115002","view_mode":"default","fields":{"format":"default"},"type":"media","link_text":null,"attributes":{"style":"height: 514px; width: 500px;","class":"media-element file-default"}}]]
Source: Ohio’s local report cards and list of e-schools provided by Ohio Department of Education. Ohio’s “dropout prevention and recovery” programs are subject to an alternative accountability framework.
At least in Ohio, state metrics (calculated in a different manner than that used by CREDO) verify CREDO’s findings that virtual charter students have struggled academically. On value added, a measure of how much students between grades four and eight learn in a given year (and a key indicator of student learning for at-risk students), every statewide e-school but one earned an F in 2013–14.[ii]
In sum, CREDO’s latest findings add to the pile of evidence that should elicit grave concern about the quality of online schooling. In Ohio and across America, the 200,000 students attending two hundred virtual charter schools simply are not learning enough. And proponents of school choice are increasingly hard-pressed to defend virtual charters—some of which are run by organizations purported to make an extraordinary profit—when their learning gains fall so far below brick-and-mortar charter schools, let alone their traditional public school counterparts.
It’s true that a significant percentage of virtual charter students are disadvantaged—both in ways we can measure (poverty status, race, special educational status, etc.) and possibly in ways uncaptured by CREDO’s study. Students might attend an online school as a temporary solution during a family member’s cancer treatment, as a way to avoid gang conflict, or to learn during non-standard hours so as to support a family of their own. But until there is a close study of the population that chooses online charters, it remains unclear whether these kinds of scenarios are representative of the overall virtual school population. The unique challenges facing some virtual students must never serve as a justification for their schools’ inability to educate them well. Students fleeing traditional public schools deserve better than a repackaged form of low expectations. CREDO’s findings ought to inspire policy makers and choice advocates to double down on efforts to bolster virtual school quality and ensure that the students who attend them—if they are already disadvantaged—don’t fall further into the cracks.
[i] A note on methodology: Researchers used a virtual control record (VCR) methodology, wherein online charter students are matched to a virtual “twin” from a feeder school (any school losing students to full-time online schools) on the following demographic and academic variables: race/ethnicity, gender, English proficiency, free or reduced price lunch status, special education status, and grade level. Each traditional public school (TPS) student is identical to his/her charter school twin—at least on the observable characteristics controlled for by the study. Then researchers looked at the previous year’s test scores of as many as seven VCR-eligible TPS students, averaging them to create a “virtual control record.” The VCR represents the expected result a charter student would have realized if s/he had attended one of the traditional public feeder schools instead.
[ii] E-school proponents point out that prior to a rule change by the Ohio Department of Education in 2011, e-schools were performing just fine on the value-added metric. But that rule change merely expanded the number of students counted toward the benchmark, making it a more accurate and robust measure. In terms of student mobility—which e-schools have notoriously high rates of—virtual charters are held accountable for students who have been on their rosters for a year. This is the same expectation we hold for brick-and-mortar charter schools and for traditional public schools, some of which also have extraordinarily high mobility rates and don’t receive a free pass.
Creatas Images/Thinkstock

Late last night, results were released from the National Assessment of Educational Progress (NAEP)—an exam that is widely considered the best domestic gauge of student achievement. NAEP is administered in each state, every two years, to a representative sample of fourth and eighth grade students in reading and math. With its rigorous content and stringent standards for meeting proficiency, NAEP provides a clear and honest view of student achievement in Ohio and across the nation.
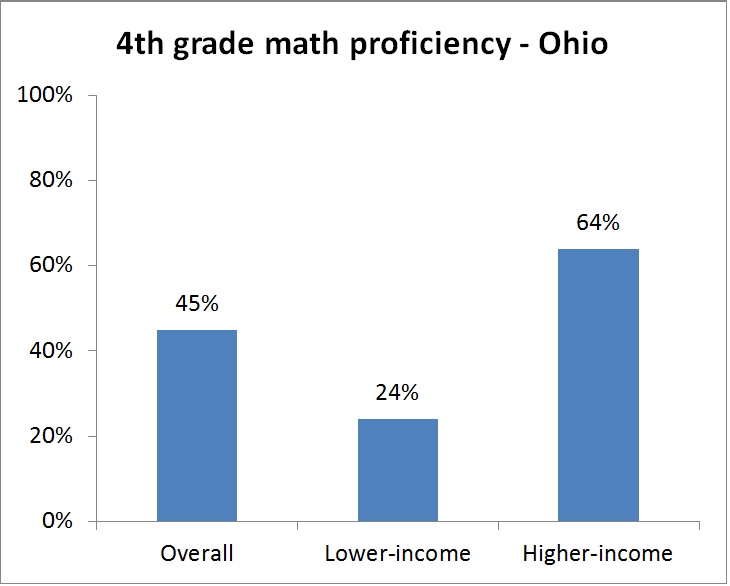
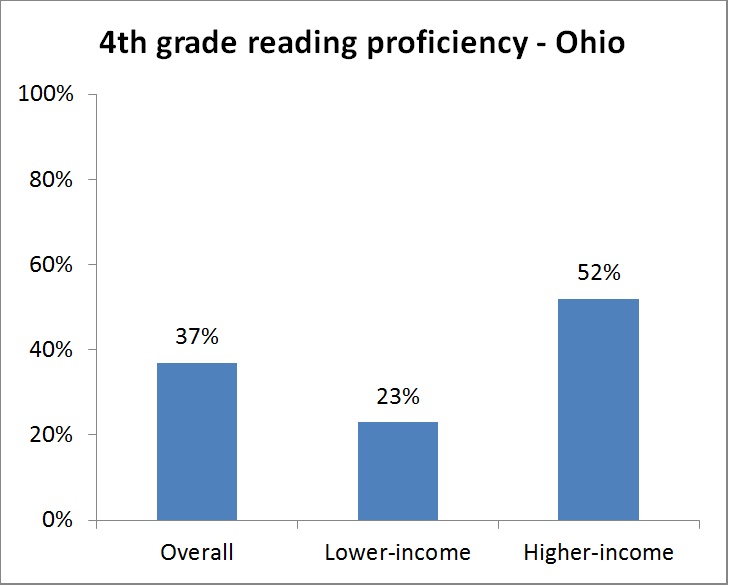
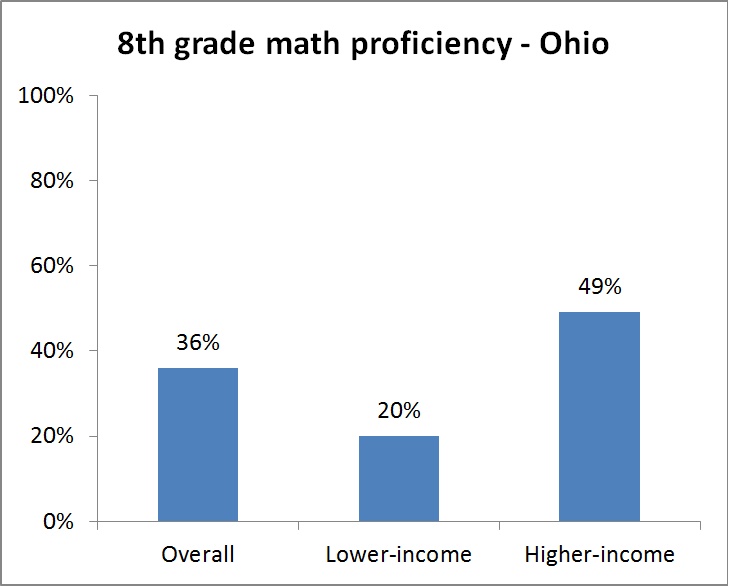
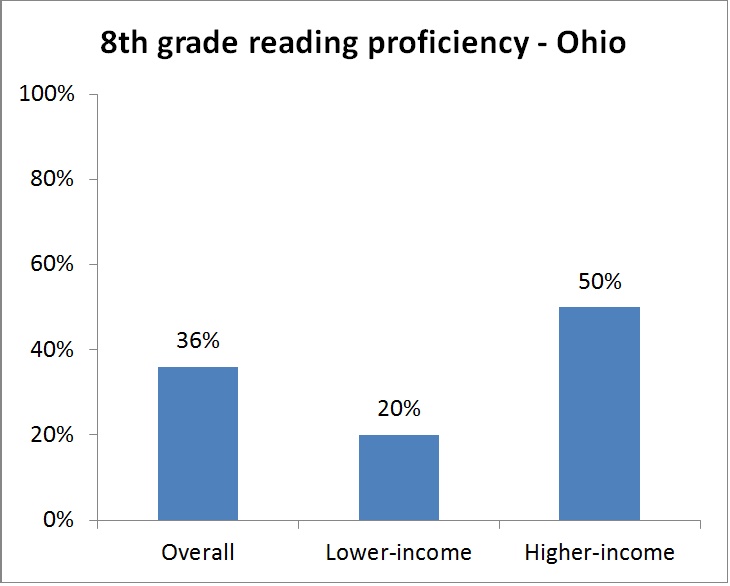
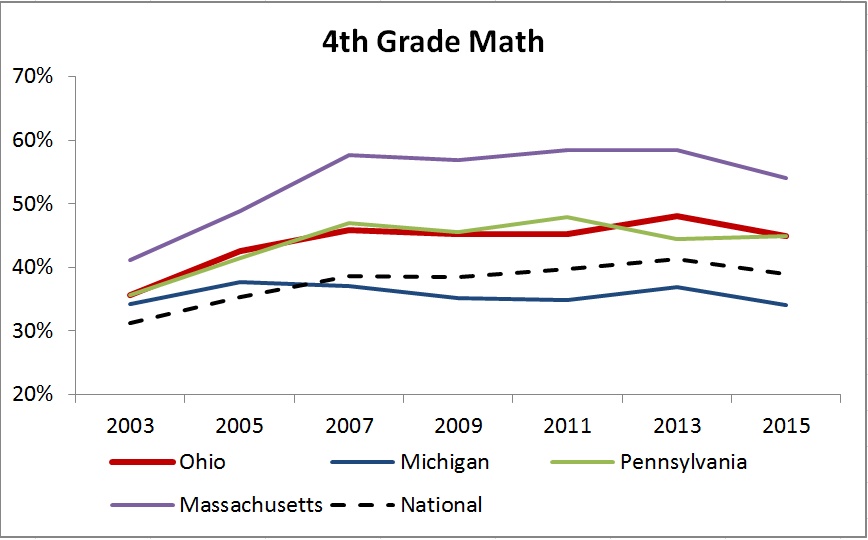
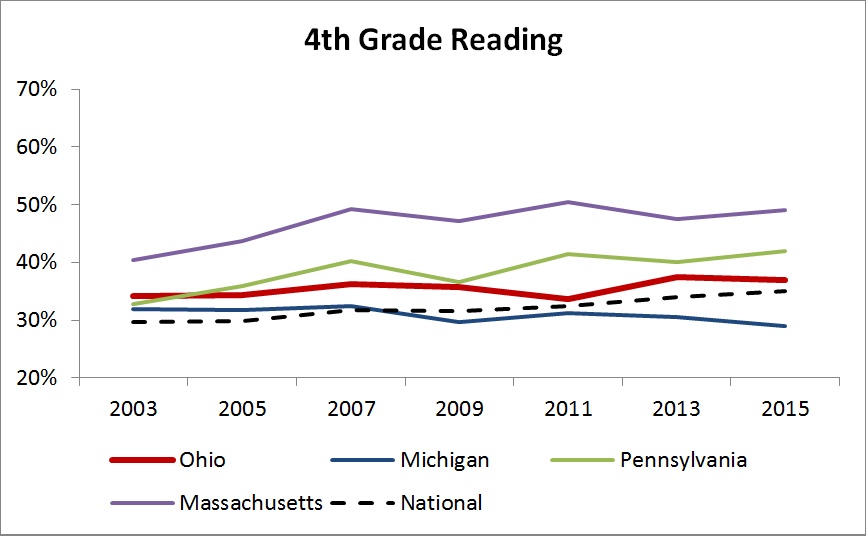
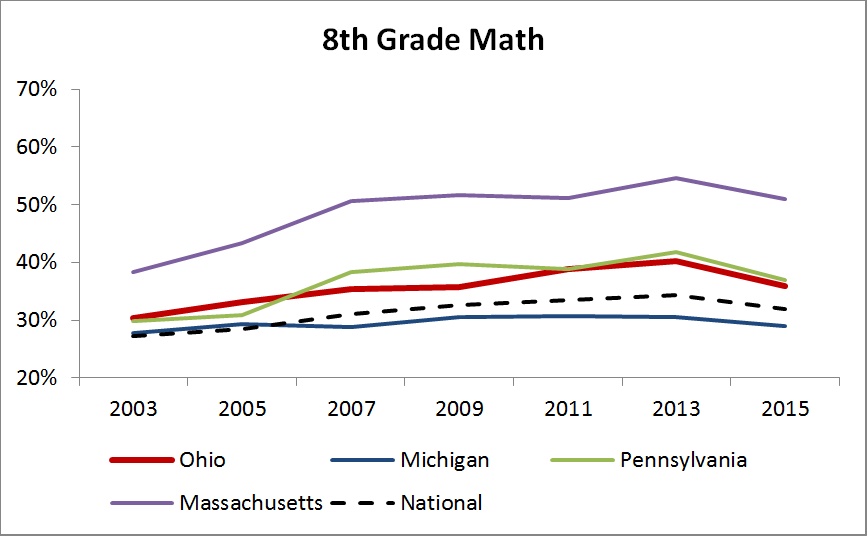
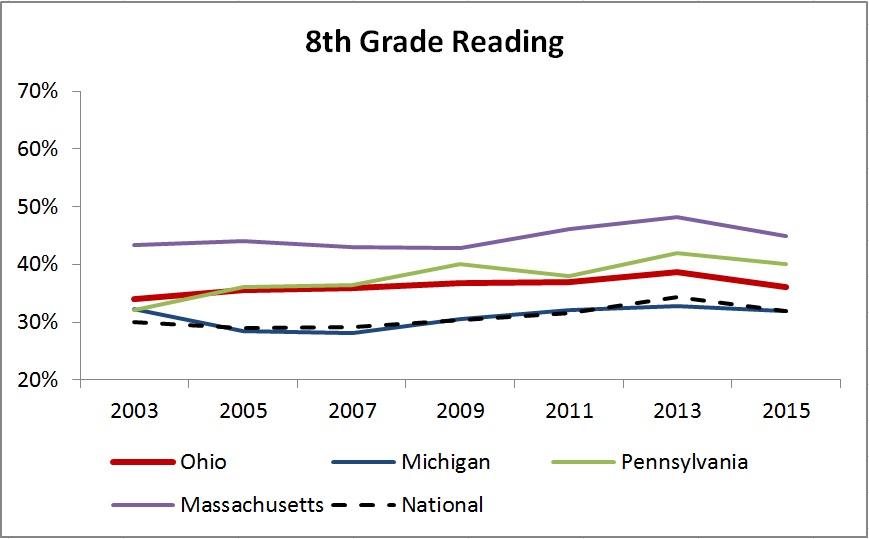
The bottom line from these test results is that too many Buckeye children are struggling to meet rigorous academic goals. The NAEP results for 2015 show just 45 and 37 percent of fourth graders are proficient in math and reading, respectively. In eighth grade, only 36 percent of youngsters are proficient on each of the assessments. Relative to national averages, Ohio students achieve at somewhat higher levels—though some of that is due to its favorable demographics vis-à-vis poorer states. Yet their performance still trails well behind the top-performing states in the nation, such as Massachusetts and New Jersey. Compared to 2013—the last round of NAEP testing in these grades and subjects—student proficiency in Ohio was slightly lower (as were the national averages).
The following sets of charts display in more detail some of the key takeaways from the 2015 release of NAEP. One set provides a point-in-time “snapshot” of achievement within the Buckeye State, while the other takes a look at the longer-term trends in achievement for the nation, Ohio, and a few other states.
Ohio student proficiency, overall and by income status, 2015
The first set of charts displays NAEP proficiency rates for Ohio students, by grade and subject, and also split by their income status. (Lower-income refers to students eligible for free or reduced priced lunch—below 185 percent of federal poverty level or roughly equivalent to $45,000 for a family of four.) As you can see, between 36 and 45 percent of students overall are proficient on NAEP depending on the grade and subject. But students from lower-income families achieve at considerably lower levels than their higher income peers. For instance, in fourth grade math, only 24 percent of lower-income students reached proficiency while 64 percent of their more-affluent peers did so—a gap of 40 percentage points.
Ohio student proficiency, relative to other states and national average, 2003 to 2015
The next set of charts places Ohio student achievement within a national and regional context, and compares results with Massachusetts, a state that since the mid-2000s has consistently topped the nation in NAEP achievement. As you’ll notice, Ohio’s achievement has and continues to exceed the national average; it matches closely with Pennsylvania and is considerably above Michigan. However, Ohio achievement falls significantly short of the national leader, Massachusetts. (Other high-performing states include New Jersey, Minnesota, and New Hampshire.) These charts also display the general downturn in student achievement from 2013 to 2015 that occurred in Ohio and across the nation—except in fourth-grade reading, which showed a slight uptick.
* * * *
So what do these data mean? First, it’s fair to say that too many students in Ohio are struggling to meet rigorous academic goals. The results from NAEP indicate that well under half of Ohio students are reaching an honest definition of proficiency—and sadly less than only one quarter of students from low-income households do so. There is no question that achievement is not where it needs to be in the Buckeye State.
Second, it is disappointing that Ohio couldn’t buck the national downward trend in NAEP proficiency from 2013 to 2015. Ohio has the capacity—and opportunity—to become a national pace-setter in education. Yet the results suggest that the Buckeye State’s performance over time is really no better than the rest of the country.
Third, it’s not clear at this point how these data correlate to the policy reforms currently being implemented in Ohio and elsewhere (e.g., higher academic standards, new assessments, and more). Some may argue that the sluggish results for 2015 are a reason to backtrack on reform. Others may suggest the need to “double down” on policy reform. But in this regard, perhaps state policymakers can learn from Cleveland, which, in the face of statewide and national declines, demonstrated promising gains on its 2015 NAEP-TUDA results. Cleveland’s educational leaders have made a clear commitment to change, and by all appearances, school-level leaders, citizens, and parents are buying in—to the benefit of the city’s students.
Perhaps state leaders should do the same: While the policy framework for success is beginning to solidify, the empowerment of school leaders and parents seems to be lagging behind. Whether the Buckeye State can top the nation in student achievement might just depend on whether its state policymakers are up to their leadership task.

The folks at ReSchool Colorado have big changes in mind for education in the Centennial State. In the works since 2013, this project of the Donnell-Kay Foundation aims to imagine a new education system that “pushes the boundaries of current thought and practice, and better prepares learners to be happy, productive, and healthy people and professionals.” The group has spent the last two years searching for breakthrough innovations through small, discreet projects they call prototypes. The outcomes of these prototypes are meant to inform a redesign of the larger education system in 2016.
A detailed new article gives us a nuts-and-bolts look at one of these prototypes. In this case, the scale was very small: nineteen low-income immigrant families with young children living in Boulder public housing. The objective was to provide everything that these families might need to access high-quality educational enrichment experiences: trips to zoos and museums, swimming lessons, and the like. In short, the kinds of out-of-school activities that rich suburban parents tend to take for granted. The ReSchool team provided, among other things, funding via debit cards (mini-vouchers) to pay for the activities; detailed information guides geared to the knowledge level of the families (meeting them where they are); and readily available multi-lingual assistance (paid advocates) to do advance work, answer questions, and eliminate roadblocks at all points in the process.
The article is not about whether the enrichment activities enhanced the kids’ pre-K education, but about the systemic barriers that had to be overcome. Fees, transportation, information, Spanish-language services, technology flaws, and more all had to be negotiated in various ways to make these opportunities accessible to poor families. The takeaways can then inform a larger and more universal system that would remove those identified speed bumps—and provide more of the previously missing on-ramps—to educational opportunity.
So what were they? First, recruitment and enrollment of participants in a system must be user-centered, and the process must be built on trust among all parties. Second, information and communication must work in all directions in the system (between program leaders, end-users, and advocates) and occur at several points in the process. Third, the supply of activities must be dynamic, especially when demand is being actively courted; a low-quality activity with a vacancy is not an adequate replacement for a high-quality activity with a waiting list. Fourth, easy-to-understand guidelines for spending on activities, real-time tracking of participant expenditures, and user-focused troubleshooters are vital for the proper functioning of the fiscal aspects of the system. And finally, tools and resources for both users and system monitors/advocates must be easily accessible, understandable, and dynamic.
If these conclusions sound familiar, it is because they are similar to the structures some say are needed for successful implementation of initiatives like course choice, education savings accounts, and centralized application and enrollment systems. That ReSchool Colorado has found the same needs in a small-scale, bottom-up program is telling indeed.
SOURCE: Alan Gottlieb, “Opportunity to learn,” Write. Edit. Think. LLC, Denver, CO, October, 2015.

School leaders are responsible for nearly everything that happens in a school—from creating a positive culture to tracking data to evaluating instruction to hiring (or sometimes firing) the teachers who most affect student achievement. Despite this extraordinary amount of responsibility, many policymakers and reformers devote their time to crafting policies that affect teachers rather than principals. In light of this, we at Fordham began thinking over some important questions: Are schools doing an effective job of recruiting, selecting, and retaining great school leaders? Are principals being trained effectively, and is there meaningful ongoing support? Are principals empowered to make decisions and challenge the status quo? What’s the right balance between autonomy and accountability?
At a breakfast event on Tuesday, we hosted presentations and a panel discussion from a few experts in the field. First we talked with Dayton Public Schools (DPS) Superintendent Lori Ward, who shared how difficult it is for a large, urban district like hers to recruit and retain effective principals.
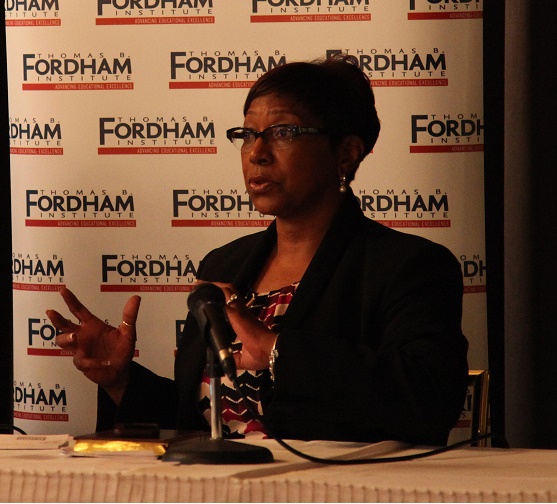
Dayton Public Schools Superintendent Lori Ward
Ward explained that of the 28 buildings in DPS, 20 are led by a principal with three years of experience or less. Seeing this turnover as a detriment to success, DPS began investing in leadership training and recruiting teacher leaders from DPS who were already invested in the district and the community. The hope is to retain great leaders for longer periods of time.
Next, attendees were treated to presentations from two alternative principal training programs, both focusing on large urban school districts. Heather Grant, director of the Aspiring Principals Program in the Cleveland Metropolitan School District, emphasized the importance of ongoing support. Weekly professional development, one-on-one mentoring, real-life practice, and a clear set of expectations and goals are the hallmarks of the Cleveland program, both during training and after placement.
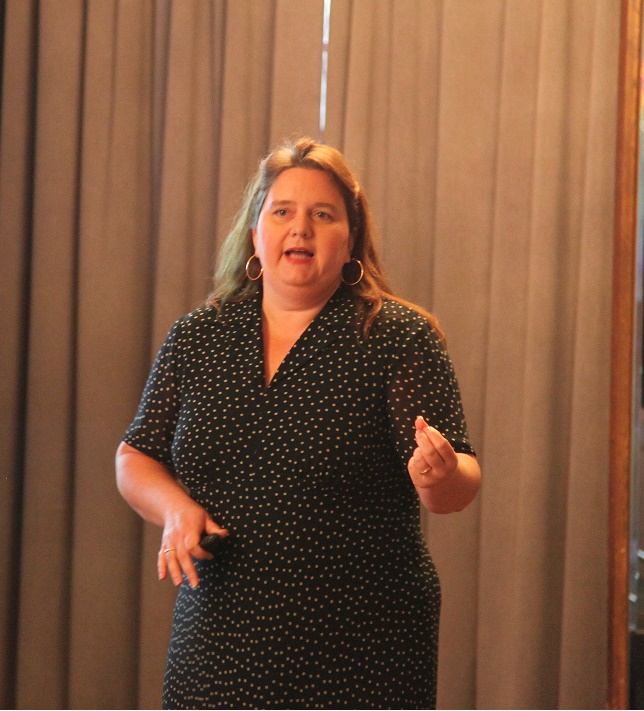
Heather Grant, Director of the Aspiring Principals Program in the Cleveland Metropolitan School District
Also presenting was Ben Lindy, the Executive Director of Teach For America in Southwest Ohio. Lindy’s program focuses heavily on the recruitment and selection of highly qualified candidates—TFA alum in particular. Like the other two programs, candidates with existing buy-in in the city to be served was a high priority.
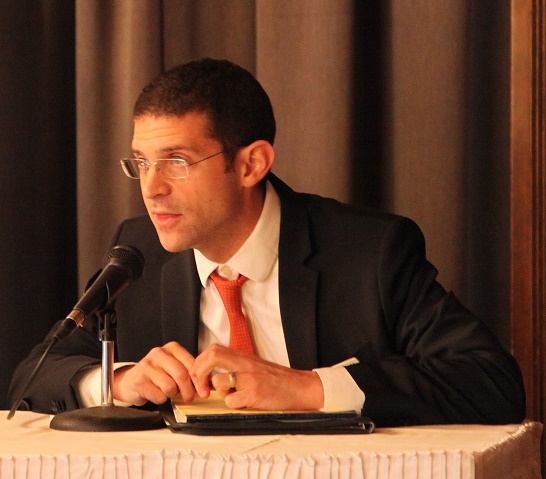
Ben Lindy, Executive Director of Teach For America of Southwest Ohio
Each panelist mentioned that autonomy is an important aspect of successful school leadership, though restrictions like collective bargaining agreements and lack of budget control can hamper even the strongest leader’s efforts.
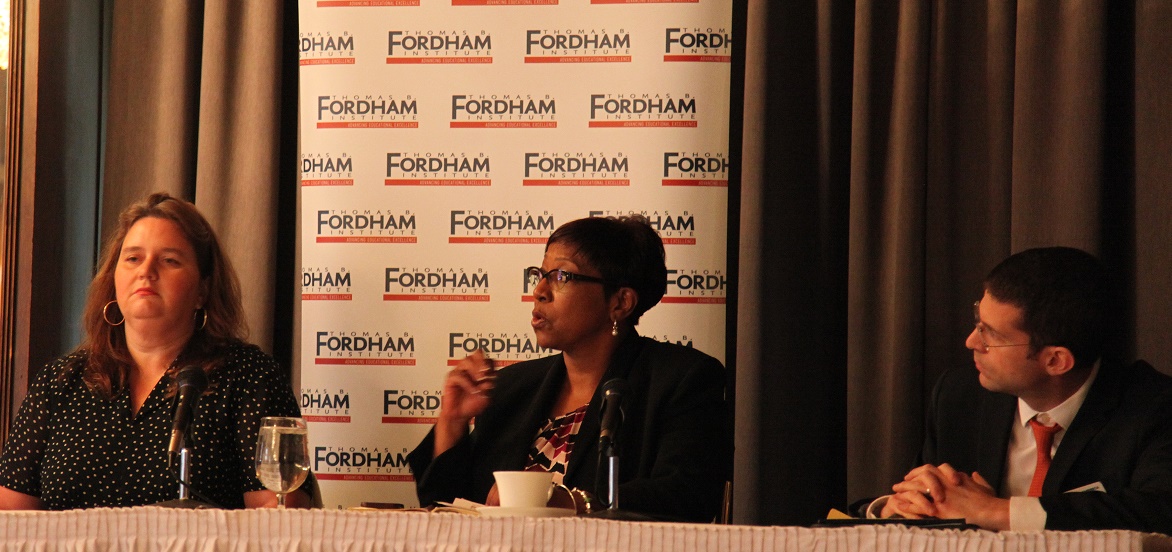
L-R Grant, Ward, Lindy participate in panel discussion
Ultimately, though, each panelist seemed to agree that a great school leader can succeed regardless of restrictions and context—and those are the kinds of leaders that our students deserve.

Five years ago, Ohio established an academic distress commission for Youngstown City Schools that was to oversee wide-scale improvement efforts. Youngstown had slipped into “Academic Emergency” (the equivalent of an F on today’s report cards) and failed to make adequate yearly progress for four consecutive years. It was the first district to sink low enough to activate a statute imposing state intervention.
In 2010, I wrote about Youngstown’s “unfocused, expensive, and misdirected” approach to improving schools, which included spending $2 million on reducing student-teacher ratios, “deploying a comprehensive system of outreach and support” for students that included “a community asset map,” and creating leadership teams whose sole purpose was to foster “collaboration, trust, and communication.” The original improvement plan was riddled with vague and meaningless language. Worse, it demanded no reforms that could actually move the needle on student learning: changes to how teachers teach and are evaluated, how principals make decisions affecting day-to-day operations, or how the district might carve out space for innovations typically stifled by collective bargaining agreements.
Predictably, little has changed since 2010. An update on the district’s recovery plan in March 2013 revealed an alarmingly unfocused approach by the commission, with few results to show for it. Take, for example, their well-intentioned strategy “to embed community partnerships within the structure of the district to ensure that the schools and the community have a culture of high expectations for the students of YCSD.” True, a culture of high expectations is vital for schools to serve impoverished students, and students can benefit from robust partnerships with the community. But consider what the commission wrote in the findings section about whether it delivered on this strategy. They complained about “old language” on the district website, as well as board of education agendas with the “old vision and mission” printed on them. “Even more confusing,” they noted, “when principals and teachers are talking about their schools on a recruitment DVD, they speak about both the old and new vision and mission.” The commission recommended a “part-time contract based person selected from the business community” who would work with the district “to create focused messaging that emphasizes the district’s drive toward excellence.”
This is deeply unserious. Creating a culture of high expectations for the most at-risk students is no easy task, but it won’t happen because a $20,000 part-time staffer updates the district website and recruitment video.
In the 2013 update, the commission also elaborated on its goal to “increase student choice in grades K–9 and 10–12,” but its results here are even more wanting. A committee comprised of parents, teachers, and a principal developed a proposal for a “Discovery school,” a district specialty program that appears to offer extra classes outside of the core curriculum (to which 360 students applied in 2013). The commission reports that “other choices were expanded,” but nowhere in the documents, or in reality, does one observe a meaningful expansion of other forms of choice that would serve the rest of Youngstown’s five thousand students.
As to whether the original academic distress commission has been effective, results speak for themselves. Little progress has been made since 2010. Fourth-grade reading proficiency has eked up three percentage points, while fourth-grade math proficiency has plummeted by ten percentage points. Modest headway has been made in eighth-grade math (fifteen percentage points), but proficiency still remains abysmal—just 44 percent. Eighth-grade reading proficiency is virtually unchanged. Despite small gains across any of the indicators shown in the graph below, the state standard for student proficiency is 80 percent, a benchmark that was missed across the board. The district’s value-added ratings of F in 2012–13 and 2013–14 corroborate the lack of student progress.
[[{"fid":"115020","view_mode":"default","fields":{"format":"default"},"type":"media","link_text":null,"attributes":{"style":"height: 306px; width: 600px;","class":"media-element file-default"}}]]
The graduation rate hasn’t budged much, either.
[[{"fid":"115021","view_mode":"default","fields":{"format":"default"},"type":"media","link_text":null,"attributes":{"style":"height: 356px; width: 600px;","class":"media-element file-default"}}]]
A deeper look at the most recent data (2013–14) continues to paint a bleak picture:
Fast forward to July. Just-signed legislation (HB 70) strengthened the state’s recourse for overhauling Ohio’s worst-performing districts. The bill’s original intent was to expand “community learning centers” or CLCs, a model in Cincinnati wherein schools served as community hubs, linking students and families to outside services. A last-minute amendment (tacked on to the CLC expansion) significantly altered what’s allowed in districts run by academic distress commissions. Some of the most controversial provisions included the powers given to a yet-to-be-hired CEO (i.e., to change union contracts and reconstitute failing schools, including re-opening them as charter schools), allowing the mayor to eventually appoint the governing board if the district fails to improve, and allowing for charter schools to play a bigger role via the creation of a new school “accelerator” that would recruit and promote high-quality schools.
The legislation was immediately condemned by the teachers’ union and protested by some parents and community members. Their opposition fell along predictable fault lines: charter schools, modification of collective bargaining agreements, and letting the mayor appoint the new governing board. In August, the district, along with the Ohio Education Association, Youngstown Education Association and others, sued the State of Ohio, State Superintendent of Public Instruction Richard Ross, and the Ohio Department of Education. The plaintiffs alleged that both the reforms passed in HB 70 and the fast manner in which it passed were unconstitutional. (The state has since filed a motion to dismiss the case.) Youngstown City Schools also asked for an injunction to block the creation of a new academic distress commission and the hiring of the CEO, but that was denied. Unless the district’s appeal proves successful, the new five-member academic distress commission is expected to be appointed by mid-November and the CEO hired before the new year.
Meanwhile, Democrats in each chamber (Senator Schiavoni and Representative Lepore-Hagan) have introduced legislation that would water down HB 70. Among several things, it would make it easier for districts to climb out of academic distress, remove the CEO’s ability to change collective bargaining agreements, require the CEO to have “at least ten years of educational experience and work in impoverished areas that face challenges similar to Youngstown,” and eliminate the law’s provision to permit dissolution of the elected school board.
While legal experts determine whether HB 70 violates the Ohio or U.S. Constitution or if the bill was passed in an appropriate amount of public sunshine (and opponents of the legislation push forward their own plan), Youngstown continues to crumble from within. Since May of this year, the superintendent, deputy superintendent, and assistant superintendent for Human Resources have all resigned, and the district has lost about 20 percent of its staff. The district board president has insinuated publicly that the upcoming $21.2 million renewal levy will be jeopardized by the legislation (namely the part that would allow for more charter schools). Meanwhile the district has spent $62,000 in legal fees during the first two months of the lawsuit.
Luckily, there are still many who support HB 70 as a way to achieve reforms that Youngstown’s original academic distress commission was incapable of delivering. Lawmakers should stay the course on HB 70, remembering that the victims of the Youngstown’s longstanding dysfunction are the five thousand students for whom past reform efforts have failed miserably—and who are still waiting for change.

Although the charter sector has grown rapidly in both size and quality in recent years, there are still myriad issues holding it back from substantially improving public education. Most worrisome is the way charters have begun to resemble the district schools they were designed to differ from. In this new paper, the Mind Trust teams up with Public Impact to shine a light on how the sector can embrace its innovative roots in order to improve. The report outlines three key ideas: The sector must get better (slightly edging out traditional public schools isn’t good enough); the sector must get broader (underserved groups like at-risk students, special education students, English language learners, and students in rural communities still aren’t served effectively by charters); and bigger (approximately one million students are currently on charter waiting lists nationwide). The authors emphasize that creative thinking and innovation are the only ways forward in accomplishing these goals. Trying the same old things on new student groups, working harder instead of smarter, and failing to find more effective and sustainable ways to operate won’t expand the impact of charters. Instead, they will only deepen their similarity to traditional schools.
To achieve break-the-mold results, stakeholders will need break-the-mold innovations. The report offers recommendations and parses them out according to four stakeholder categories: school operators, policy makers, city-based education organizations, and funders. Perhaps unsurprisingly, the recommendations for school operators are the most detailed. The authors advise them to invest in new school models that innovate in the realm of student experience, as well as the use of time, space, and personnel. These new models could come from start-up organizations, existing high-flyers, or collaboration between the two. Operators can also embrace innovation by making ambitious improvements to existing models. The report recommends adjustments to facility use and facility funding; investing in taking over failing schools rather than planting new ones; rethinking startup economics by opening entire schools at once rather than phasing in by grade; backfilling vacant spots; and sharing school functions like administrative and finance work across networks.
For policy makers, supporting innovation includes funding charters equitably, permitting high-performers to expand, and setting (and acting on) high performance expectations. City-based education organizations can advocate for policies that support innovation; facilitate connections between new models, existing schools, and local leaders; offer planning funds; attract talent; and support small-scale pilots. For funders, the recommendation is simple and straightforward: Invest in new and innovative models, even if it means taking a risk.
The risk factor, of course, is what will ultimately determine whether stakeholders heed this report’s mostly solid recommendations. Considering that charters were founded because of a need for something different from traditional schools, one can only hope that stakeholders show greater willingness to innovate. Otherwise, we may end up with a pair of traditional—and struggling—school systems.
SOURCE: “Raising the bar: Why public charter schools must become even more innovative,” The Mind Trust and Public Impact (October 2015).