Ohio has long underfunded charter schools. Back in 2004, we at Fordham published a Dayton-specific study finding that the city’s charters received just two-thirds of the revenue as the local district.
Ohio has long underfunded charter schools. Back in 2004, we at Fordham published a Dayton-specific study finding that the city’s charters received just two-thirds of the revenue as the local district. Ten years later, a report from the University of Arkansas discovered that the situation hadn’t much changed, as charters statewide received on average about 70 percent of district funding. Looking at data through 2017, my analysis published four years ago found similar disparities. In contrast, several other states have done a far better job of ensuring equitable funding: Massachusetts and Texas charters, for example, receive about 85 to 95 percent of their local districts’ funding.
Ohio’s charter funding gap has real-world consequences. Without equitable resources, charter schools often struggle to provide the extra supports—both academic and non-academic—and the enrichment opportunities that help unlock students’ full potential. They have less capacity to work to continually improve their educational programs and expand their reach. They also face challenges in attracting and retaining talented teachers, as their lower funding levels leave them stuck offering lower salaries.
Just as important is the matter of fairness and equity. Children attending charter schools ought to receive the same taxpayer support for their education as their peers attending district schools just down the street. Failing to do so is a violation of basic principles of funding equity—especially given that charter school students are disproportionately low-income and students of color.
To its credit, Ohio took a big step toward narrowing the gap by launching the high-quality charter funding program in 2020. The initiative currently provides up to an extra $1,750 per economically disadvantaged pupil for qualifying schools and $1,000 per non-disadvantaged student. This year, 117 schools—about a third of charters statewide—are receiving the supplemental aid.[1] In his latest budget proposal, Governor DeWine calls for a commendable boost to the program. Under his plan, qualifying schools would receive $3,000 per economically disadvantaged student and $2,250 per non-disadvantaged student.
With this background in mind, it’s worth revisiting Ohio’s charter funding disparity. What does the gap look like today, and how would the governor’s latest proposals help bridge it? How much further does the state need to go to achieve equity for all charter students?
Before turning to the results, it’s important to know how exactly the gaps are calculated. We start with the state’s FY 2022 expenditure per equivalent pupil data which relies on an adjusted, or “weighted,” enrollment of districts and charter schools. (Only brick-and-mortar charters are included in this analysis.) This measure attempts to account for the extra dollars received when they enroll special education students, English learners, and those from economically disadvantaged backgrounds. Hence, the measure creates a more apples-to-apples comparison of spending figures than using the “raw” per-pupil spending data.[2] Charters’ expenditure per equivalent pupil are then compared to the district in which they’re located; from that, average gaps are calculated. To show that state policy is driving the gap, federal dollars are excluded from both charter and district spending; transportation expenditures are also subtracted because districts must transport charter students. The analysis includes all “operational expenditures”—spending on, e.g., instruction and student supports—but excludes capital outlay. If those dollars were included, the gap would actually widen, since districts receive more funds for facilities.
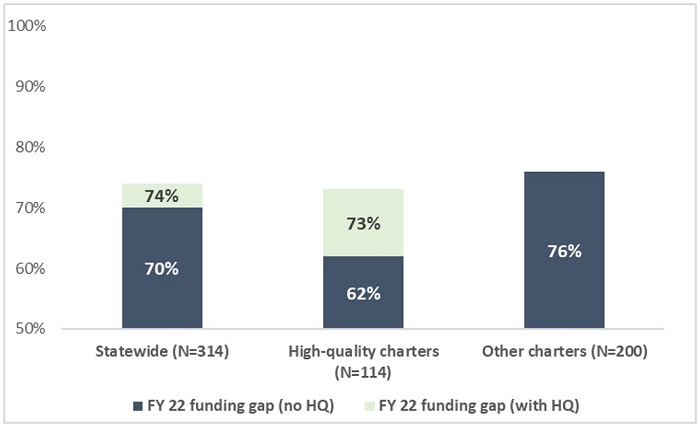
Using this methodology, Figure 1 displays the charter funding gap as of FY 2022. To get a baseline picture, we first display the disparity in charter-district funding without the high-quality supplement. Here we see—as in earlier analyses—that the typical Ohio charter receives about 70 cents on the dollar compared to their local district.[3] This indicates that, apart from the supplement, Ohio has done very little to improve charter funding. When the high-quality supplement is included, the gap narrows slightly, lifting high-quality charter funding to 73 percent of their local district and the statewide average to 74 percent.
Figure 1: Ohio’s current charter funding gaps
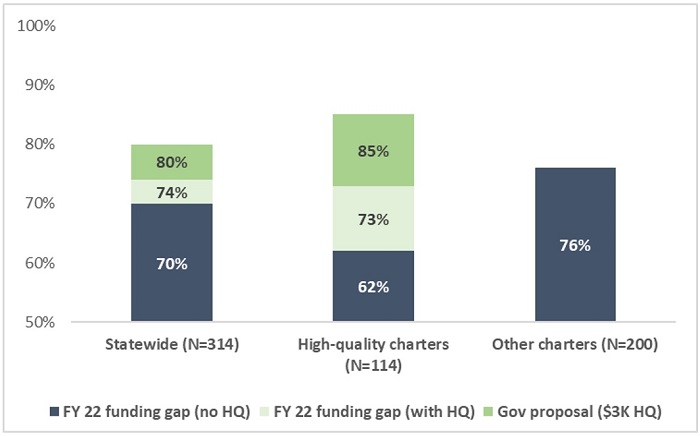
As noted earlier, Governor DeWine has proposed a significant increase to the supplemental aid that high-quality charters would receive. Figure 2 shows the impact of his proposal on the charter funding gap, should it be passed by the legislature. Funding for high-quality charters would be at 85 percent of their local districts; other charter schools would remain at 76 percent. Of note, this doesn’t include the proposed increase in charters’ facility allowance. For the purposes of this analysis, those dollars are excluded because this analysis focuses on operational expenditures (not capital outlay).
Figure 2: Impact of Governor DeWine’s latest budget proposal
As figure 1 and 2 indicate, the high-quality supplement narrows funding gaps for about a third of Ohio charters. But it doesn’t lend any extra support for schools that do not qualify for the performance-based funding. Yet students attending these schools still deserve fair funding. Given that most of them are economically disadvantaged (82 percent) or Black or Hispanic (59 percent), failing to provide sufficient resources raises significant equity concerns.
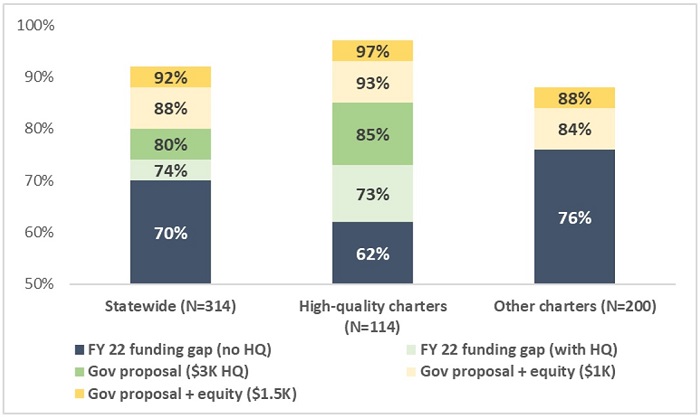
To move Ohio closer to funding parity for all students attending brick-and-mortar charters, legislators should create an “equity supplement” that would complement the high-quality program. There are various ways to design such a program, but the most straightforward approach is to provide a per-pupil supplement for all brick-and-mortar charters (both schools that qualify for the high-quality funds and those that don’t). Figure 3 shows the impact. If Ohio funded the equity supplement at $1,000 per pupil, the charter funding gap statewide narrows to 88 percent of district funding. At $1,500 per pupil, it closes to 92 percent. Under the latter scenario, the average high-quality charter would be funded at near parity with their local district, while other charters would be at 88 percent.
Figure 3: Impact of a charter equity supplement
* * *
For a quarter-century, public charter schools have served hundreds of thousands of Ohio students. Despite their schools’ shoestring budgets, many of them have received an education that opened opportunities inhigher education andthe workforce. But it’s time for the state to stop shortchanging charter students—most of whom are disadvantaged—just because they attend non-district schools. As they are in other states, Ohio charter students deserve to be treated on equal terms as their counterparts. Governor DeWine and state lawmakers have already made inroads in fighting this inequity through the high-quality fund. To complete the work, the legislature should take the additional steps needed to ensure that all charter students have the resources needed to reach their full potential.
[1] To fit the state appropriation for the program, qualifying charter schools are presently receiving $1,416 per economically disadvantaged pupil ($809 per non-disadvantaged pupil).
[2] However, as documented in my prior analysis, the results do not differ substantially depending on the raw or adjusted spending data.
[3] The higher baseline gap for high-quality (HQ) charters vis-à-vis other charters (62 to 76 percent) is explained by lower average spending in HQ schools, after federal revenue and their high-quality supplemental aid is subtracted from their overall expenditures. Because HQ funds are included in a charter’s overall expenditure, they are subtracted to calculate the gap as if the program did not exist.
In 2013, Mississippi passed a comprehensive early literacy policy aimed at ensuring that students can read proficiently by the end of third grade, which research shows is a make-or-break benchmark. Among the reforms is a retention policy that—much like Ohio’s Third Grade Reading Guarantee, which was passed around the same time—requires students who don’t reach a minimum score threshold on state standardized tests to be retained in the third grade and receive additional support and intervention.
A recently published working paper from the Wheelock Educational Policy Center at Boston University offers a closer look at the effects of Mississippi’s test-based promotion policy. Using a regression discontinuity design, Kirsten Slungaard Mumma and Marcus Winters were able to compare the test scores, absences, and special education status of roughly 4,700 students who scored slightly above and below the state’s promotional score threshold. They found that students who were held back via the retention policy scored more than 1 standard deviation higher relative to their barely promoted peers by the end of sixth grade. That’s an enormous effect. It means that students who were retained in third grade scored, on average, around the 62nd percentile in English language arts when they were in sixth grade, compared to students who weren’t held back and scored on average in the 20th percentile. The impact was driven by gains for Black and Hispanic students, as both benefited substantially in ELA if they were retained. Retention had no significant impact on math scores, a student’s subsequent attendance rate, or the likelihood that they would later be classified as having a disability.
What might Ohio observers take away from this data? First and foremost, it should give opponents of Ohio’s retention policy pause. Mississippi’s NAEP results, along with this new report andplentyofotherresearch, make it crystal clear that a strong retention policy should be an important part of any statewide early literacy strategy.
Mississippi is also proof that statewide reading initiatives can be highly effective when they include resources and interventions beyond just retention. Mississippi leaders focused on the “right way” to teach reading, which meant championing the science of reading and ensuring that teachers knew what to teach and how to teach it. Literacy coaches were provided to identified schools and offered varying levels of support. Students who demonstrate a “substantial deficiency in reading” are required by law to receive intensive reading instruction and intervention, which must be documented in a reading plan. In other words, state leaders didn’t just toss out platitudes about the importance of improving early literacy. They passed laws, invested funding, and implemented programs designed to spark improvement—even in the face of significant pushback.
Ohio has already started down this path. The Third Grade Reading Guarantee requires struggling readers to be identified as early as kindergarten and put on reading improvement plans. The parents of struggling readers must be notified when their children are deemed off-track. And, of course, students who don’t meet the state’s promotional standard are retained in the third grade and must receive intensive intervention. Prior to the pandemic, these collective efforts were moving the achievement needle. But these improvements, at least on national assessments, haven’t been as swift or as stark as those in Mississippi. In the wake of Covid learning loss, it’s clear that Ohio’s youngest students need more.
Fortunately, Governor DeWine proposed some big changes aimed at bolstering early literacy in his recently released budget recommendations. They include establishing a state-created list of high-quality curriculum and instructional materials aligned with the science of reading, and requiring all public schools to use only the materials that appear on the list starting with the 2024–25 school year. He’s also pledged to provide funding to every school to pay for curriculum based on the science of reading and to fund coaches that can provide intensive support in low-performing schools.
In education policy, the best path forward isn’t always clear. But when it comes to early literacy, there’s plenty of light shining the way. We have a trove of research and evidence indicating what works, and thanks to states like Mississippi, we have a model for how to make it work. Now all Ohio needs to do is follow the light.
Governor DeWine’s budget recommendations are out, and they tackle a host of education issues. Thus far, his proposals for expanding school choice, improving early literacy, and investing in career and technical education have grabbed most of the headlines. But buried amidst all those provisions is an interesting idea that could help address some of Ohio’s teacher shortage issues.
The governor has charged the state board of education with establishing standards and requirements for a new pre-service teacher permit. Teacher candidates enrolled in Ohio’s educator preparation programs would be required to obtain this permit before they could participate in student teaching or other training experiences that involve students in any grade level at any public or chartered nonpublic school. As part of the permit application process, pre-service teachers would be subject to a criminal records check, which the Ohio Department of Education (ODE) would then use to enroll the applicant into the fingerprint database (just like they do with licensed teachers). Permits are valid for three years, but ODE can extend that duration on a case-by-case basis.
Here’s where it gets interesting. Districts and schools would be allowed to employ anyone who holds one of these permits as a substitute teacher. Permit-holders could teach for up to the equivalent of one full semester, but district superintendents and school administrators could request that their board approve “one or more additional subsequent semester-long periods of teaching.” Teachers who substitute using a pre-service permit can also be paid. In short, this permit would allow candidates in educator preparation programs to serve as substitutes, something that is not permissible under current state law, which requires substitute teachers to have a postsecondary degree (pandemic-driven flexibilities that serve as workarounds to this requirement will expire in 2024). This would, in turn, increase not just the number of substitute teachers that schools can hire, but also the quality.
To understand why this could be a gamechanger, some context is needed. Over the last few years, many Ohio districts and schools have been grappling with a teacher shortage. But despite all the headlines, it’s hard to get a pulse on the full scope of the problem. Teacher staffing concerns are highly localized, and the state doesn’t collect and maintain statewide data on teacher vacancies in a single, easily accessible place. Without this information, it’s hard to understand the breadth and depth of the issue. It’s also difficult to determine the kind of teacher shortage schools are facing. In some places, “teacher shortage” is a term that includes substitutes, who are a crucial part of day-to-day operations even if they aren’t an official part of staff. Teachers might do heroic work, but they aren’t superheroes. They get sick, they have family emergencies, and they burn out. To serve kids well, schools need an effective substitute system with a decent supply of teachers.
Unfortunately, that’s not the case in many schools. In fact, headlines fromthe lastfewyears indicate that Ohio’s most significant teacher shortage might actually be with substitutes, not full-time staff. That shouldn’t come as too much of a surprise, as it’s long been hard to find good substitute teachers. It’s a difficult job that doesn’t pay well, and it’s temporary by nature. The pandemic and the ever-shifting job market have only exacerbated existing problems. Disadvantaged schools have systematically lower substitute coverage rates, which means they’re being hit hardest. And Ohio isn’t a unique case. Last year, a piece in The Atlantic argued that America is desperate for substitute teachers. A few months later, NPR covered a story about schools in Illinois that were holding one-day trainings just to get short-term subs into classrooms.
National coverage like this can be disheartening, but it also means that more people are focused on solving the problem. Last spring, Dan Goldhaber and Sydney Payne published a piece in Education Week that proposed an innovative solution to the substitute teacher crisis that might sound familiar: allowing student teachers to serve as substitutes. They argued that doing so would be a win for everyone involved. Obviously, it would help districts staff classrooms who had absent teachers. But these substitutes wouldn’t just be warm bodies charged with pressing play on movies, assigning busy work, or monitoring students during an impromptu study hall. They would be prospective teachers with some of the knowledge, skills, and training needed to run a classroom. As substitutes, student teachers could “turn idle time into learning time,” which would be beneficial not just for the school, but for students, as well.
The challenge with such an idea, Goldhaber and Payne write, is that state and local bureaucracies get in the way. Well-intentioned rules about who can substitute teach and whether they need to be licensed can keep student teachers out of the classroom. But if Governor DeWine’s version of a pre-service teacher permit becomes law, bureaucratic regulations won’t get in the way. Schools across the state, many of which already have relationships with teacher preparation programs thanks to student teaching requirements, could simply offer teacher candidates the opportunity to get paid and obtain additional classroom experience by substitute teaching.
Obviously, this won’t solve all of Ohio’s substitute teacher staffing woes. But it would help. Schools could immediately bolster their substitute teacher pipelines. In doing so, they could avoid asking teachers to use their planning or lunch periods to cover absent colleagues’ classrooms—a common practice that can contribute to teacher burnout. Student teachers would benefit from the additional experience and income. Students could benefit from a substitute teacher who is familiar with state standards, curricula, and up-to-date instructional strategies. Districts could even collaborate with teacher preparation programs to use pre-service permits as a jumping off point for creating teacher apprenticeship programs, like those in Tennessee. All things considered, there’s a lot to like about this proposal. Here’s hoping that legislators approve it.
This being a budget year, state lawmakers will soon be delving into the minutia of school funding. To help inform these discussions, we’ve begun a series looking at Ohio’s funding system, including a deep-dive into the new formula that lawmakers enacted in 2021 and which Governor DeWine has proposed to maintain. The first essay provided a basic orientation to the state’s funding system and the new formula, known as the Cupp-Patterson or Fair School Funding Plan. The second essay examined the “base cost” model, a set of calculations that yield districts’ base amounts. When used in tandem with the state share mechanism, the base amount drives core state funding allocations for districts, as the figure below indicates.[1]
But what is the state share? Basically, it’s an “equalizing” mechanism that ensures state dollars “level-up” poorer districts. The state picks up—as it should—a larger portion of base funding for poorer districts, while it covers less in wealthier districts that can raise more dollars locally (including a minimum 2 percent, or 20 mill, state-required property tax). While the concept of the state share is straightforward, implementing it remains a complicated task. In this piece, we’ll unpack this element, as well as look at some technical challenges that deserve attention.
Measuring district “capacity” and calculating the state share
The new formula (and its predecessor) relies on property values and resident income to measure districts’ wealth. Property values makes obvious sense, as they directly impact how much districts can generate locally through property taxes. Income is somewhat less intuitive, but the idea is that higher-income districts are more likely to gain voter approval for higher property tax rates, further enhancing their capacity to raise local dollars.
The trickier part is how to use these data in a formula. The pre-2021 version inconsistently used income in the state share calculations, as it only played a role in certain districts whose incomes were low relative to their property values. The new formula is more consistent, applying both factors in all districts’ calculations. Using data for Columbus City Schools, table 1 illustrates how the data are combined to create a composite wealth measure for the district. Two slightly different measures of income are used: 1) the total federal adjusted gross income of a district’s residents, and 2) a district’s median income multiplied by the number of state tax returns filed by its residents.
Table 1: Calculating a composite per-pupil wealth for Columbus City Schools, FY 2023
Things get more complicated after this. Step two of the new methodology calculates a district’s median income relative to the state median. Columbus, a district with below average income, has a “median income index” of 0.85, while a high-income district like Bexley has an index of 2.05. This index is then multiplied by specific numbers[2] to yield a “local capacity percentage.” This appears to be the local tax rate the state assumes districts have the capacity to levy. That said, it’s odd to see assumed tax rates under 2 percent, such as Columbus’s, since Ohio law requires all districts to assess a minimum property tax of that rate. Nonetheless, as table 2 shows, this generates a per-pupil local capacity amount—the portion of the base that the state presumes a district can cover. Note that this amount doesn’t determine districts’ actual local funding; it’s used only for formulaic purposes.
Table 2: Calculating local capacity amounts for three Franklin County districts, FY 2023
In step three, the local capacity per pupil is then subtracted from the base to produce the base state funding allocation. From that, the state share percentage is derived.[3] As Table 3 indicates, the wealthy district of Bexley has a lower state share (and thus receives just $361 per pupil in state aid), while its poorer neighbors receive more state funding.
Table 3: Calculating the state share percentage for three Franklin County districts, FY 2023[4]
How will the state share function over time?
Though obviously complex, the state share does work to identify the state’s neediest districts and steers more aid their way. But how might this mechanism function over time? Here, there seems to be less clarity.
To begin, table 4 reveals a striking pattern in districts’ state share percentages between 2022 and 2023—the first two years for the new model. We notice that nine in ten districts experienced declines in their state shares (meaning they were deemed wealthier under the formula in 2023 than in 2022), while only eighteen of roughly 600 districts registered an increase in state share (meaning they got poorer). Interestingly, nothing like this occurred under the old, pre-2021 formula. There was a greater balance of gains and losses from 2016 to 2019, the last year it was used.
Table 4: Changes in districts’ state share percentages under the new and old formulas
Two factors seem to explain the systemic declines in the state share from 2022 to 2023.[5]
One is inflation, along with the new formula’s stronger emphasis on “absolute” wealth. Nearly all districts registered higher property values and incomes in FY 2023—partly due to inflation—and thus districts systemically looked wealthier. While inflation was tamer then, how did the old system avoid a system-wide decline in state shares due to inflation? One likely explanation is that it took a more “relative” approach to measuring wealth, whereby a district’s income and property values were compared to the state average. Thus, districts that gained wealth—but at a slower clip than the statewide trend—were actually deemed poorer and in need of more aid. Piqua school district, for example, had a 1.3 percent increase in property values from 2016–19, a rate below the statewide median of 8.3 percent. Thus, its state share rose.
One complaint about the relative concept was that trends in other parts of the state could impact a district’s measure of wealth. That was felt to be unfair. Thus, the new system takes a more “absolute” approach, where each district’s wealth is measured on its own terms (see table 1). That, however, creates an issue in which inflation will steadily make every district look wealthier over time, as they all begin to look “rich” by today’s standards.
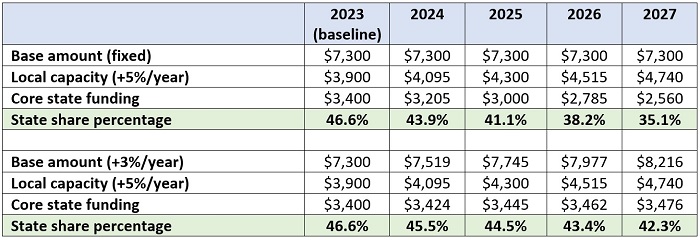
The plot thickens with a second factor—a virtually fixed base amount—also playing a role in the declining state shares. With the exception of enrollment data, the state did not update the “inputs” of the base cost model (e.g., applying more recent teacher salaries). This resulted in very little change in districts’ base amounts from 2022 to 2023. Combined with the increasing local wealth, that led to declines in the state share percentages. The top rows of the table below illustrate how this occurs with hypothetical data. If the base amount remains constant over time, state shares slide as local wealth increases. In such a scenario, the state’s funding obligations under the formula would become less and less, presumably leading to funding reductions or perhaps increased use of “guarantees” to fund districts. However, when the base increases over time, inflationary gains in local capacity put less downward pressure on the state share percentages. The bottom rows of the table illustrate this scenario.
Table 5: Illustrating the interaction between the base amount and state share percentage
Raising the base seems to be critical for long-term functioning of the formula. But here’s the twist. Ohio isn’t actually funding schools at the full base amount of roughly $7,300 per pupil. Instead, it’s currently somewhere around $6,500 per student, reflecting the phase-in of the large, $2 billion-per-year increase in state spending called for under the new formula—additional outlays that the last General Assembly determined there weren’t enough resources to fully fund. Even with a partial phase-in of the spending increase during 2022 and 2023, lawmakers are still going to struggle to get the base to $7,300 per pupil in the forthcoming budget. Going above that amount is even more unlikely. What this means is that state shares could slide yet again in FY 2024 and 2025, leading to questions about how this whole thing will work over the long haul.
* * *
If you’ve gotten this far, you’ve probably concluded that this is all very complicated. You’d be right. The system is intricately designed, with a huge number of variables serving as “inputs.” Will it function and serve Ohio well over the long term? Or will it break down under the weight of its expense and complexity? No one knows the answer for sure, but it’s always possible that Ohio will end up with yet another “patchwork” formula—the very thing the proponents of this iteration desperately sought to fix.
[1] Charters, with minor exceptions in Cleveland, receive no local funding, so the state share does not apply to them.
[2] The calculation here is complicated. For high-income index districts (index above 1.49 in FY 23), the local capacity percentage is simply 2.5 percent. For medium-income districts, the percentage is its {[(median income index – 1) * 0.0025] / (0.49)]} + 0.0225. For low-income index districts (index less than 1.0), the percentage is its median income index * 0.0225.
[3] The state share percentage is used not only in the core funding component, but also in several of the categorical funding streams that also assume a joint state-local responsibility (e.g., special education and CTE).
[4] The formula sets a minimum state share of 5 percent of the base for a district. Without the floor, Bexley would have received $328 per pupil (4.53% x $7,234).
[5] A third factor—declining enrollment—could also play a role. However, the FY 2023 state shares would actually reflect a slight uptick in district enrollment that occurred between 2020–21 and 2021–22.
California is among a handful of states that require the least amount of high school math to earn a diploma—just two courses. That means most students can complete their full complement of high school math education, even the “enhanced” requirements for admission to California State University and University of California campuses, well before their senior year. But is there a benefit to continued coursework beyond a state’s or an individual school’s minimum prescribed course load? A new study digs into the data to investigate the impacts of taking an additional year of math in high school on college enrollment and persistence.
A research team led by Leonard Wainstein of Reed College used longitudinal administrative and survey data from the Los Angeles Unified School District (LAUSD). Their analysis focused on two cohorts of students who were first-time eleventh graders in either 2015–16 or 2016–17 and who remained in the district through the following year. It included over 45,300 students in district high schools and district-affiliated charter schools.
The comparison looked at a group of seniors who took no math at all and three groups who took another a full year of math. While all the senior math non-takers had already completed their high school requirements in that subject, as well as any college preparatory requirements relevant to them, the math-takers fell into six initial groups. They included two groups that needed to take math in twelfth grade to graduate, one group that needed to boost their math grade to meet college admissions requirements, and three groups who opted for additional math courses beyond the requirements. For ease of comparison, Wainstein and his team excluded the two groups finishing high school requirements and the highest-flying optional group—those who took two additional courses above requirements during senior year.
Wainstein found that senior math-takers, overall, enrolled in college at higher rates than otherwise-similar peers who did not take any math in twelfth grade. The effect ranged from a 3.2 percent to a 6.4 percent boost. These positive effects occurred even though math-takers experienced a slight “hit” to their overall GPA—from 3 to 6 hundredths of a point—which their peers did not. Additionally, enrollment in four-year colleges was as much as 5.8 percent higher for math-takers than math non-takers. The strongest effects were seen among those students taking additional math courses above the California college admissions requirements. The researchers also found a 4.5 to 5.8 percent increase in college persistence—returning for a second year of four-year college—for students who took math in their senior year, compared with those who skipped it. Wainstein’s team found similar positive impacts from traditional courses taken in senior year—such as precalculus and algebra 2—and from so-called “alternative” offerings such as Transition to College Mathematics and Statistics or Introduction to Data Science. It seems that the mechanism at work is, especially for college-bound seniors, “keeping one’s hand in” the math game.
LAUSD Superintendent Alberto Carvalho recently announced that he plans to act on the findings in this report, to “explode the information” and make sure principals, teachers, guidance counselors, and parents know of the benefits of taking math in senior year, even for those who have already met state and university requirements. Diversifying the courses offered and increasing access to those options district-wide are also on his to do list. All of this will hopefully combine to help incent more students who will benefit from keeping their skills sharp to take more math in the future even while the state’s requirements remain at rock bottom.
NOTE: Today, the Ohio Senate’s Education Committee heard testimony on SB 1 which would, among other things, make substantial changes to the state’s K-12 education governance. Fordham’s Vice President for Ohio Policy provided proponent testimony before the committee. These are his written remarks.
I am here today to testify in support of Senate Bill 1. This legislation would represent a major restructuring of education governance in Ohio and would move the state toward a more coordinated, coherent approach to K-12 and workforce-development policy implementation.
Why is a change necessary? Ohio students today encounter challenges that they are too often ill-equipped to face. We’ve all heard the data on K-12 education. But since the pandemic, it’s gotten even worse. On Ohio’s state tests only 53 percent of eighth grade students are proficient in English and only 43 percent are on grade level in math. Using the higher—college ready—NAEP standards, Ohio 8th grade proficiency numbers dip to 33 percent in reading and 29 percent in math. Low-income students and students of color post even lower scores. It’s clear that we must find ways to improve student achievement in K-12 education. For those inclined to discount test scores, the long-term data indicates that students struggle after K-12. While around 53 percent of Ohio high school graduates enroll in a college or university, only about 30 percent actually go on to earn two- or four-year degrees. These numbers shouldn’t be surprising given that even with the rise of co-requisite remediation, one in five Ohio students going to college still requires non-credit bearing remedial coursework.
Quite simply, too many students leaving high school today are ready for neither college nor work. Ohio’s economic future and—just as important—the lives and long-term happiness of our citizens demands change.
What’s this have to do with the state board? The board has a host of responsibilities under current law (3301.07 ORC), but probably it’s most important is to “exercise leadership in the improvement of public education in the state.” This duty—always paramount—has become especially crucial in the wake of the pandemic, during which hundreds of thousands of Ohio students fell behind academically. Black and Hispanic students, those with special needs, and children from low-income backgrounds have been hit the hardest.
Unfortunately, on this front, the most important to Ohio’s students—the board has fallen short. Before expounding on this view, I want to make clear the deep respect that I have for members of the state board of education—both past and present. I’ve testified before and interacted with board members and believe they are doing their best to make a difference on behalf of students. In many ways, it’s a thankless job. It’s a board that is designed in a way that—through no fault of its members—prevents it from functioning efficiently and implementing the education laws that the legislature passes. Nineteen voting members—split between appointees and elected members—is a recipe for gridlock, discord, and a lack of accountability. And anyone paying attention over the past few years has seen that and more.
Areas where the board and/or its structure has hurt the state’s efforts to improve public education:
1. Failure to focus on the big things—Entirely too much time in board meetings has been spent discussing parliamentary procedure and political resolutions that are under the purview of the General Assembly not the state board.
2. Lowering expectations for students—On multiple occasions, the state board pushed to lower Ohio’s graduation requirements and urged lawmakers to grant diplomas for things like attendance, capstone projects, and volunteer hours. More recently, the board passed a resolution urging the legislature to drop the retention requirement for third graders who cannot read.
3. Moves too slowly—From hiring a new state superintendent to implementing the ACE ESA program to conducting five-year rule reviews, the state board’s slow committee process and failure to act in a timely manner on these and other issues is detrimental to students and often subverts the intent of the legislature.
4. Lack of accountability—At the end of the day, under Ohio’s current education governance structure neither the governor nor state board has ultimate authority and responsibility for improving educational outcomes. Each can—quite plausibly—stand and point the finger at the other when things don’t work out as hoped. From Academic Distress Commissions to charter school sponsor evaluations, when implementation went awry no one was ever really accountable.
To reiterate, we stand in support of SB 1. It would call upon governors to take on a stronger leadership role in agenda setting, policy design, and the implementation of initiatives aimed at improving readiness for college and career. In the realm of K–12, Ohio has a fragmented system in which governors rightly run for office on how to improve education but an almost anonymous state board of education—with less accountability as a result—actually exerts the most influence over policy implementation. The result has been uninspiring academic achievement which creates hardships for our students. By granting the governor greater leadership over education, we will finally have some semblance of accountability for education outcomes.
SB 1 would also create conditions that allow education and workforce initiatives to be vigorously implemented. The bill’s more unified approach—including creating a deputy director for career and technical education—is critical as data continue to show that too many young people struggle to make transitions from high school to career. The improved alignment of K–12 and career and technical education systems should help to set consistent expectations, align policy development and information systems, and create a culture of shared responsibility for the well-being of young people from elementary school to their first jobs.
Governor DeWine and future governors—regardless of party—should be allowed to oversee a unified state education and workforce agency. SB 1 would significantly improve the likelihood that initiatives are faithfully carried out. This is surely why governors of both parties, including Governors Celeste, Voinovich, Strickland, and Kasich, have at times sought more formal authority in primary-secondary education. Of course, this is not to say that governors should always get what they want: Checks and balances are essential to any governing model. But the check on the governor should come primarily via the legislature and, of course, through the will of the people who ultimately hold him or her accountable at the ballot box.
The time is right to make these changes. Post-pandemic, Ohio students are facing tremendous challenges to get back on track. We need strong, aligned, bold leadership to improve our education system. Unfortunately, our current governance structure for K-12 education has proven not to be up to the task. While restructuring alonemay not deliver the results Ohio needs to secure its future prosperity, the changes proposed in SB1 would create conditions that promise more seamless transitions for students and a renewed accountability around academic achievement.
Thank you again for the opportunity to speak with you today.