
“Social promotion” returns without a state reading requirement
For the better part of the past decade, Ohio has required schools to hold back third graders who do not meet state reading standards.

For the better part of the past decade, Ohio has required schools to hold back third graders who do not meet state reading standards.


For the better part of the past decade, Ohio has required schools to hold back third graders who do not meet state reading standards. This provision, part of the Third Grade Reading Guarantee, seeks to eliminate the discredited practice of “social promotion” and instead ensure that children with reading deficiencies receive the extra time and support needed to read proficiently. Prior to the pandemic, the policy appears to have moved the achievement needle with fewer students struggling on state reading assessments.
Despite its common sense and the evidence of progress, critics have decried retention, and House legislators recently passed a bill that would axe the requirement. In testimony touting the legislation, district administrators assured lawmakers that—even without a requirement—“schools would continue to intervene with these students to help them grow their reading skills.”
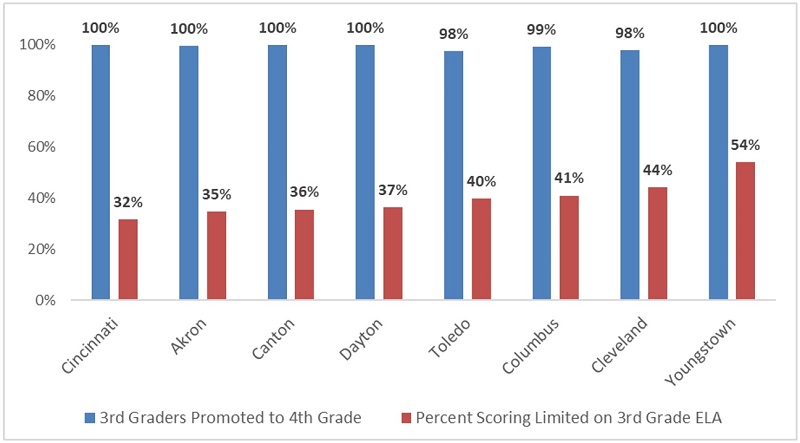
Well, that’s a fantasy. Just consider data from 2021–22, a year in which state lawmakers temporarily relieved schools of the retention requirement due to pandemic-related concerns. What do we see? Last year, nary a third grader was held back in Akron, Dayton, Canton, Cincinnati, and Youngstown. Only miniscule numbers were retained in Toledo, Cleveland, and Columbus. The blanket promotion occurred despite the fact that a whopping 32 to 54 percent of the districts’ students scored at the lowest achievement level—known as “limited”—on their third grade English language arts (ELA) assessment. We must realize that third graders with results this low are truly floundering: They’ve earned less than twelve out of forty-one points on the assessment, and the Ohio Department of Education says they demonstrate “minimal command” of state literacy standards. Without retention and the intensive interventions required under the Guarantee, such students are almost assuredly going to have difficulties as they progress through middle and high school.
Figure 1: Third grade promotion rates and students scoring “limited,” Big Eight districts, 2021–22
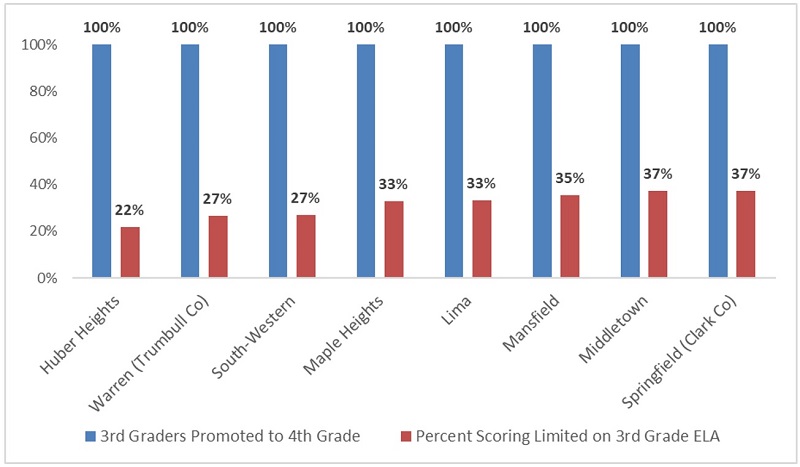
Universal promotion wasn’t merely a big-city phenomenon. Figure 2 shows eight other districts that passed all of their third graders, even though a quarter to a third scored in the limited category. Middletown and Springfield school districts in Southwest Ohio promoted every third grader despite 37 percent having “minimal command” in reading.
Figure 2: Third grade promotion rates and students scoring “limited,” selected districts, 2021–22
Statewide, an astonishing 469 of 605 districts promoted 100 percent of third graders in 2021–22, and 565 districts had sky-high rates above 98 percent. Just five promoted less than 90 percent of third graders. The upshot of this requirement-free year? Ohio schools waved through virtually every third grader last year, even as 19.5 percent of them—just shy of 25,000 children—scored limited on their reading exams. One can only guess how many of them are now in fourth grade, not receiving any extra attention and continuing to struggle academically. We also have no idea how many schools followed temporary law passed for 2021–22 that required consultation with parents of students scoring at this level before promoting them. All this is what happens when state lawmakers remove clear requirements for promotion at this critical juncture in a child’s education.
Promoting children who can’t read sets them up for long-term failure. Make no mistake: If lawmakers give up on the Third Grade Reading Guarantee, social promotion will once again prevail, and thousands of Ohio students will be worse off as a result.

In the summer of 2021, Ohio lawmakers caved to political pressure and created an off-ramp for the three districts under an Academic Distress Commission (ADC): Youngstown, Lorain, and East Cleveland. As part of the deal, each district’s board was tasked with developing an academic improvement plan that contains annual and overall improvement benchmarks. If districts meet a majority of these benchmarks by June 2025, their ADC will be dissolved.
Official implementation of the plans doesn’t begin until the 2022–23 school year, which means the recently released report card results should be the baseline for district improvement. Unfortunately, only one of the three districts (Youngstown) opted to include more than two state test measures in their plan. Even then, the rigor was severely lacking. This is a problem—as is the state’s decision to approve the plans anyway—because state tests are among the best methods for tracking improvement over time, among subgroups, and between districts and the state average. Failing to take these measures into account means that these districts could be among the lowest performing in the state by 2025 but still be free of state oversight just because they met their own self-appointed “improvement” benchmarks.
Fortunately, just because these districts steered clear of state tests doesn’t mean we have to. Here’s a look at how they fared in achievement, progress, and early literacy on the most recent state report cards.
Achievement
Achievement is the only test-based report card indicator that appears on all three district improvement plans. Specifically, the plans focus on performance index (PI) scores, which measure the state test results of every student and award districts points based on the state’s six achievement levels. The higher a student’s achievement, the more points the district earns. For example, a student who scores at the advanced level earns their district 1.2 points, while a student testing at the basic level (just below proficient) earns 0.6 points.
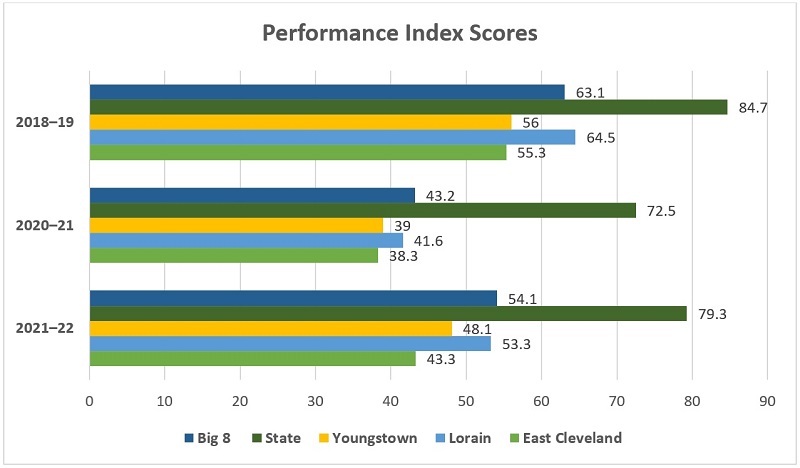
The chart below depicts performance index scores in ADC districts, with averages from the state and the Big Eight districts included for comparison. It’s no surprise that scores statewide and in each district dropped during 2020–21, as that year was dominated by pandemic-related disruptions and school closures. It’s also important to remember that the PI calculations award zeros when students do not participate in state assessments; the number of untested students was significantly higher in 2020–21, and that likely depressed some districts’ PI scores even further. Thus, although the chart shows that PI scores from the most recent school year are moving back toward pre-pandemic levels, it could be a reflection of test participation rates returning to normal rather than an indication of a robust academic recovery. In any case, all three districts’ most recent PI scores still fall well beneath their respective scores from 2018–19.
The 2018–19 results indicate that districts had their work cut out for them long before pandemic learning loss hit, as all three were at least 20 points below the state average. But the 2021–22 results reflect even bigger gaps between the districts and the state average, as the differences grew to 26 points in Lorain, 31 points in Youngstown, and a whopping 36 points in East Cleveland. Compared to Big Eight schools, the ADC districts fare a little better. In fact, the gap between Lorain and the Big Eight on the most recent report cards was less than one point. Youngstown and East Cleveland, on the other hand, have gaps of six and nearly eleven points, respectively. Going forward, these districts should be operating with double the urgency, as they need to catch students up after the pandemic and close the growing gap between students and their peers.
Progress
Ohio’s progress component measures the academic growth students made over the course of a year. This measure is crucial, as it showcases a district’s or school’s contribution to student learning while yielding results that are closer to neutral regarding schools’ demographics. Even in districts where students are far behind in reading and math achievement, the progress component can reveal positive academic growth—which is why it’s a bit of a head scratcher that none of the three districts included it in their plans.
In terms of recent results, Lorain seems to be headed in the right direction: The district earned four stars, which means students made more progress than expected. A consistent five-star rating is likely what the district needs to successfully catch kids up from the pandemic and close existing achievement gaps, but four stars is a solid foundation to build on. Youngstown and East Cleveland, on the other hand, appear to be headed in the opposite direction. Youngstown earned a two-star rating, while East Cleveland earned only one, meaning that, in both districts, students made less progress than expected. Such low ratings should be a huge red flag, as it’s impossible for districts that can’t keep pace with annual growth expectations to close any kind of achievement gap.
Early literacy
In years past, Ohio report cards took early literacy into account by grading schools on an “Improving At-Risk K–3 Readers” indicator that measured how successful schools were at helping struggling early readers. The 2021 report card overhaul, however, established a new early-literacy component that includes three separate measures: proficiency in third grade reading, promotion to fourth grade, and improving K–3 literacy (which, like the original indicator, measures how well schools help struggling readers). The measures are weighted according to state law, and combined to determine an overall early-literacy rating.
These adjustments give parents and the public a more complete picture of early literacy in Ohio schools. But they also make it close to impossible to accurately compare early-literacy ratings on this year’s report cards to those of years past. Nevertheless, we should still consider how the ADC districts fared on this important measure, as this year’s results will be the baseline for the future.
The chart below breaks down the early-literacy results for each district. All three struggled mightily in terms of reading proficiency. East Cleveland fared best compared to its counterparts, with nearly 39 percent of students scoring proficient in reading and nearly 17 percent of students moving from off to on track. Youngstown fared worst in terms of proficiency, with just under 21 percent of students passing the reading portion of the third-grade test. However, it had a slightly better off- to on-track percentage than Lorain, which moved just 11 percent of its students into the on-track category.
It’s important to recognize that all of these numbers—even the best among them—are troublingly low. The ADC districts are moving less than a fifth of their students from off to on track in reading, and roughly two-thirds of their third graders aren’t scoring proficient on the reading subset of the state test. That’s a sharp contrast to the promotion to fourth grade results, which checked in at an eye-popping 100 percent in all three districts. Unfortunately, the districts seem to have taken advantage of pandemic-related legislation that paused the Third Grade Reading Guarantee to pass hundreds of struggling readers on to the next grade.

***
The most recent batch of state report cards reminds us that East Cleveland, Lorain, and Youngstown have a tremendous amount of work ahead. It won’t be easy, but these districts are capable of improving—if they’re willing to be honest. Unfortunately, by submitting academic improvement plans that largely avoided state measures, these districts chose to be less transparent about their progress with families and the public. By rubber-stamping these plans, the state chose to let it happen. That means, going forward, it will be up to local communities to track whether their schools are making real progress—and to hold district leaders accountable for improvements in student achievement. Here’s hoping that objective information from state report cards will help.

Last month, we looked at the recently released state assessment data from the 2021–22 school year. The results are sobering: Student achievement remains depressed in the wake of the pandemic, and gaps between disadvantaged pupils and their peers have widened. The results are especially alarming in Ohio’s cities, where student proficiency has dropped significantly and just one in four children now meet grade-level math and reading standards.
The setbacks on state tests have been less severe in Ohio’s wealthier suburban communities. That’s little surprise given the more abundant at-home resources that allowed students to better weather the storm. But educational damage occurred in suburbia, too. We just have to look elsewhere for its effects: college-readiness data.
This article focuses on the percentage of high school students who achieve college-remediation-free scores on their ACT or SAT exams. It’s a high bar, as it requires students to achieve solid marks on both the English and math components of their college-admissions tests. Yet achieving this target is an important indicator of post-secondary readiness (and a point of pride for many suburban districts), as achieving these benchmarks predicts success in freshman coursework.
Sure enough, the news on this front is glum. Statewide, just 22 percent of Ohio’s class of 2021 met this rigorous standard, down from 25 percent for the (pre-pandemic) class of 2019. In percentage terms, that’s a decline of 12 percent. But that’s nothing compared to the drops experienced by many suburban districts.
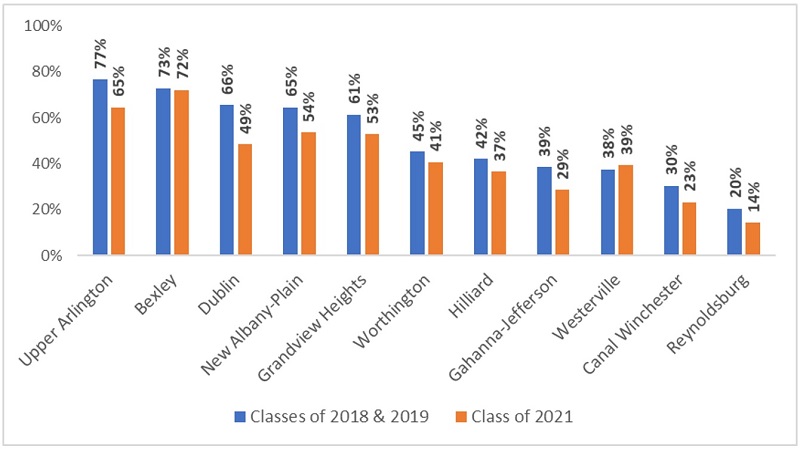
Figure 1 displays the readiness rates of suburban Columbus districts. In Upper Arlington, for example, 77 percent of its graduating classes of 2018 and 2019 met college-ready standards but its rate fell to 65 percent for its class of 2021. Notable declines are also evident in Dublin (-17 points), Gahanna-Jefferson (-10 points), New-Albany Plain (-9 points), and Grandview Heights (-8 points). Of these districts, Westerville is the only one to register an increase.
Figure 1: College readiness rates, Columbus-area suburban districts
A similar decline in college readiness is seen across suburban Cincinnati districts. Three Rivers posted the largest decline (-13 points), with substantial dips as well in Mariemont (-10 points), Forest Hills, Loveland, and Oak Hills (-8 points each), and Wyoming (-6 points).
Figure 2: College readiness rates, Cincinnati-area districts
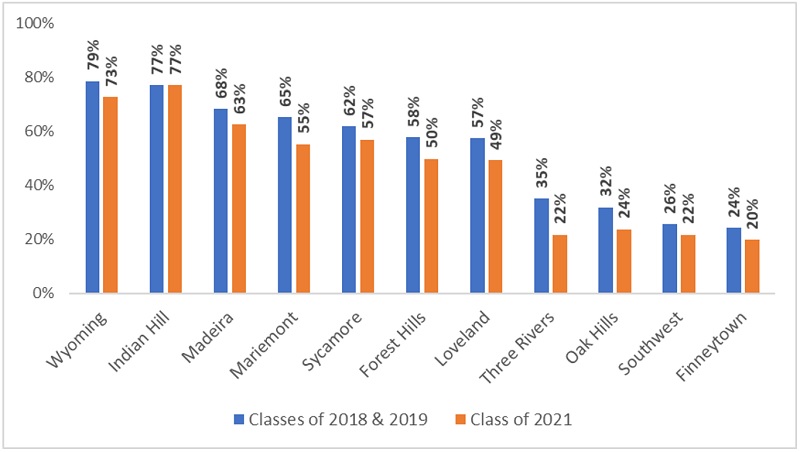
The slide in college readiness indicates that the pandemic also took a toll on learning in wealthier communities, too. It disrupted the tail end of the class of 2021’s junior years, and their senior years were likely chaotic, as well. Some students who were previously on pace for college may have lost their edge as they struggled through remote learning or lengthy quarantines. Schools may have also weakened their focus on rigorous academics and been more reluctant to push their best and brightest to excel in the midst of turmoil. Lower-than-usual test participation rates could be a factor, too. That said, the vast majority of these suburban districts recorded 90-plus percent ACT or SAT participation rates for the class of 2021, and non-participants were probably less likely to meet the college-ready benchmark in the first place. One final possible explanation is colleges’ decision to make scores optional during the pandemic; that may have discouraged some students from studying hard for these exams.
Students everywhere have suffered over the past couple years. All Ohio schools, even traditionally high-performing suburban ones, need to work quickly to reverse the slippage. Without it, fewer students will be ready to tackle college coursework, and more are likely to drop out. The future of Ohio lies in the hands of today’s students. For those with college aspirations, let’s make sure they have the academic foundation needed for higher education.

Is it possible that attending a high-performing school may help young people live healthier lives? An intriguing new paper from the American Medical Association’s JAMA Network open access journal says yes, though with some important caveats. A research team lead by Dr. Mitchell Wong from UCLA followed more than 1,000 students for six years—through high school and beyond—and surveyed them annually on issues such as substance use, delinquency, and physical and mental health. Those who attended a high-performing charter school generally reported far fewer injurious behaviors and negative health outcomes than similar peers, with one major exception.
Dr. Wong and his team leveraged the natural experiment created by lottery-only admission at five charter schools in Los Angeles. These schools were chosen because they were among the thirty highest-performing high schools in the city, served predominantly low-income students, and reported at least fifty more applicants than available spots at the start of the project in October 2012. The initial treatment group consisted of 694 students who won spots via lottery to start ninth grade at one of the five schools; the control group consisted of 576 students who were not offered spots. (Students who were admitted on the basis of sibling preference and those who moved out of Los Angeles County were excluded.) Slightly more than half the sample was female, and nearly 90 percent was Hispanic. Treatment and control groups were nearly identical at the start, including eighth grade GPA (approximately 70 percent in each group had earned a C or better), eighth grade test scores (more than half of each group scored proficient in math and English), and family structure (more than 83 percent reported two-parent families and an “average” parenting style—somewhere between “authoritative” and “neglectful”).
Students in the study were surveyed annually between March 2013 and November 2021. That is, from the end of eighth grade through high school completion and up to age twenty-one. Surveys prior to graduation were conducted in person; subsequent surveys were conducted in person or over the phone. The outcomes of interest were self-reported and included patterns of alcohol and cannabis use, physical and mental health, delinquent behaviors, and body mass index (BMI).
Participants who attended a high-performing charter school had a 53.3 percent lower rate of hazardous or dependent alcohol use disorder at age twenty-one, compared with those in the control group. Among male participants, the intervention group had a 42.1 percent lower rate of self-reported fair or poor physical health at age twenty-one and a 32.9 percent lower rate of obesity or overweight status as measured via BMI. Among female participants, however, the results were opposite. Girls who attended a high-performing charter reported a 16.8 higher rate of fair or poor physical health at age twenty-one than their non-charter peers, and a 19.3 percent higher rate of overweight or obesity status.
Differences in cannabis misuse were significantly lower for both males and females in the treatment group in the early years of the survey, but showed no statistical difference by twenty-one. The proportion of participants who reported engaging in one or more delinquent behaviors (such as graffiti, damaging property, shoplifting or stealing, driving a car without the owner’s permission, burglary, selling illicit drugs, or gang activity) was significantly lower for treatment group students at ages twenty and twenty-one than for their comparison peers; however, the two groups were generally similar in reported delinquent behaviors in all earlier surveys. Few differences in mental health outcomes were reported at any point. Adjusting for educational outcomes—such as actual graduation versus dropping out—did not significantly change the findings. The research team notes the limitations of self-reported data and the potential for social-desirability bias in students’ responses, although they are able to partially compensate in their modeling and by comparing other relevant research that does not use self-reported responses.
Overall, the news is good. Lowering the rates of delinquent behaviors and misuse of alcohol and cannabis among young people is hugely positive, especially in low-income communities. And the positive influence of a high-performing school on young men’s physical health is a welcome addition.
Dr. Wong and his team speculate as to the mechanisms by which attendance at a high-performing charter school would lead to these results—more adult monitoring of student behavior due to smaller school size, favorable staffing configuration, exposure to peers focused on academics and not risky behaviors, but also with the possibility of higher academic stressors detracting from young women’s physical health—but do not have data to really lock anything down. Family structure could be part of the equation, as well. While schools cannot and should not be charged with solving all societal ills, it is possible that simply engaging in more and more rigorous academic work during high school can help students focus on learning and the future while ignoring some of the more pernicious negative influences around them.
SOURCE: Mitchell D. Wong, MD, et al., “Association of Attending a High-Performing High School With Substance Use Disorder Rate and Health Outcomes in Young Adults,” JAMA Network Open (October 2022).

Everyone knows that teachers are the most important in-school factor affecting student achievement, so getting the best ones in front of the neediest students is critical. Recent research, however, questions the desirability of inducing strong teachers to move to lower-performing schools by investigating whether negative impacts may accrue to students in the schools they leave behind, and whether those effects might outweigh any benefits in destination schools.
A team led by USC researcher Adam Kho looks at data from Tennessee’s Innovation Zone (iZone) schools. A turnaround effort for the state’s lowest-performing schools, the iZone was one of several interventions that Tennessee implemented as part of its successful Race to the Top application in 2010 and its No Child Left Behind waiver in 2011. Local iZones are networks of low-performing schools that remain part of their district but are managed separately. Most are in the Volunteer State’s three major urban areas: Nashville, Chattanooga, and Memphis. Along with hiring new leaders and extending learning time for students, one of the highest priorities for iZone schools was to recruit high-quality teachers. The state provided up to $7,000 bonuses for those willing to teach in the iZone—the better the teacher, the higher the bonus—and districts added more to the bonus pool as their budgets allowed. Data show that the efforts bore fruit in terms of improvement in the teaching corps and in student achievement. But little attention has been paid to the outcomes of students in nearby non-iZone schools, many of which were the source of those high-quality teachers who were induced to move away.
Kho and his team focus on the 2011–12 to 2014–15 school years. Student data include demographics, school assignments, and test scores on statewide end-of-year exams in reading, math, and science for grades three through eight. Teacher data include race/ethnicity, education level, years of experience, school and grade level assignments, and teacher quality as measured by their annual TVAAS scores. TVAAS specifically measures “the influence of a district, school, or teacher on the academic progress (growth rates) of individual students or groups of students from year to year” and shows “the impact that the teacher, school and school district have on the educational progress of students” regardless of starting point. The researchers use a series of value-added equations to estimate achievement gains or losses. Their preferred model utilizes school-by-year fixed effects, which makes comparisons between buildings easier. They also compare schools that did not experience turnover as part of this effort.
During the study period, more than 650 teachers transferred into iZone schools. Ninety-two of them came from buildings in the same district as their receiving school. Seventy-one percent of transferring teachers had master’s degrees, far above the 56 percent of teachers who transferred to non-iZone schools over the same period. The average iZone transferee had 7.9 years of teaching experience, slightly less than their non-iZone peers. Sixty percent of transferees had earned an effective TVAAS rating in the previous year, higher than non-iZone transferees (54 percent) but lower than a comparison group of teachers who stayed put (67 percent).
Sending schools had fewer non-white and economically disadvantaged students than receiving schools, but greater percentages of both groups than the average school in iZone districts—reflecting the stark racial and economic divide between certain schools in districts like Memphis—and much greater than the average school in the state. Similarly, sending schools were higher performing on state tests than receiving schools but worse than the average school in iZone districts. Student achievement impacts were determined using a smaller sample size, however, because just 238 iZone transferees taught in tested grades.
The team’s preferred model showed that students in grades that lost (and had to replace) 100 percent of their reading teachers to the iZone scored 0.10 standard deviations lower on reading assessments than grades that lost none of their reading teachers. Thus, they multiply 0.10 by the percentage of teachers lost/replaced in a grade to calculate the average effect on sending schools. The same process is followed in math and science. On average, grades in sending schools that lost reading, math, and science teachers to the iZone replaced 53, 62, and 65 percent of their grade-level teachers in those subjects, respectively. Students in all tested subjects in all grades at sending schools recorded lower test scores in the year following teacher departures for the iZone. Controlling for the percentage of teachers lost, most decreases were small—from 0.04 to 0.12 standard deviations, with the largest seen in science—and not statistically significant. The more teachers a grade level sent, and the higher the TVAAS score of those teachers prior to departure, the larger and more significant the negative effect.
The researchers take these modest negative effects in sending schools and combine with the positive effects in receiving schools (as observed by a team from the Tennessee Education Research Alliance in 2017), and they find an overall positive impact of the recruitment effort. In short, when higher-quality teachers moved schools, positive student outcomes followed them. The kids they left behind did worse, and the kids they taught instead did better, despite previous years of underperforming. TVAAS scores did not fully explain the differences between student outcomes—suggesting additional unobserved mechanisms related to teacher turnover—but the bottom line seems pretty clear: Teachers matter, and boosting the number of highly-effective teachers matters even more.
SOURCE: Adam Kho et. al, “Spillover Effects of Recruiting Teachers for School Turnaround: Evidence from Tennessee,” AERA Journal (August 2022).

Children who start strong in reading are more likely to succeed academically as they progress through middle school, high school, and beyond. Conversely, those who struggle to read in the early grades often falter as they encounter more challenging material; many become frustrated with school and drop out.
Ohio lawmakers have long recognized the importance of foundational reading skills to long-term student success. Passed in 2012, the state’s Third Grade Reading Guarantee laid a strong policy foundation for early literacy. But much more needs to be done to truly “guarantee” that all Buckeye children acquire the reading capabilities needed for a successful future.
Our new policy brief, fourth in a series, recommends several ways that legislators can build on Ohio’s early literacy initiative to truly ensure that every child acquires the reading skills they need to succeed.