
Teen surveys find interest in CTE, but opportunities still lacking
Recently released NAEP results confirm a harsh reality already indicated by state tests and report cards: Ohio students suffered

Recently released NAEP results confirm a harsh reality already indicated by state tests and report cards: Ohio students suffered


Recently released NAEP results confirm a harsh reality already indicated by state tests and report cards: Ohio students suffered massive learning losses during the pandemic. Although the NAEP results in fourth grade should set off plenty of warning bells, the damage in eighth grade is particularly troubling: Between 2019 and 2022, Ohio’s eighth grade proficiency rate fell from 38 to 29 percent in math and from 38 to 33 percent in reading.
The eighth graders who sat for these assessments have now moved on to ninth grade. And while the first year of high school is typically viewed as a fresh start, the academic impacts of Covid are likely to follow this cohort of students. (That’s certainly been the case for recent graduates, who were dubbed “Generation Covid” by a Newsweek article.) In fact, although many signs point to a long road ahead for all students, the task is particularly tall for high schoolers, who are poised to enter college or the workforce in just a few short years.
Political leaders and educators are scrambling for solutions. Fortunately, the same students they’re trying to help could also be the source of some promising ideas. Over the last two years, Question the Quo (QTQ), a campaign that aims to empower high school students to consider a variety of post-secondary education options, partnered with VICE Media to conduct five nationally representative surveys of high school students. The results cover a range of topics, including teens’ views on higher education and its cost, as well as the effects of Covid on their education. But there are three takeaways in particular worth noting.
First, although high schoolers are ready and willing to explore in-demand job pathways, they seem to lack opportunities to do so. Sixty-three percent of teens report wishing that their high schools provided more information about the variety of post-secondary options available to them. And although 74 percent said it’s important to have a career in mind before they graduate from high school, only 39 percent reported taking classes or participating in programs that allowed them to explore careers.
Second, students’ lack of knowledge appears to extend to career-and-technical education (CTE). According to the QTQ surveys, more than half of students don’t understand what career-and-technical education is or how it could help them. That’s a big problem, as most of the career paths students are interested in have CTE on-ramps. In fact, QTQ found that although many of the jobs teens are interested in have CTE pathways associated with them, only 20 percent of high schoolers believed that CTE could lead to the career they want. As a result, most students “are not aware that the careers they want have on-ramps other than a four-year degree.”
And third, despite their apparent lack of knowledge about CTE, many students seem to view it positively. Half of those surveyed said that they knew someone who had enrolled in CTE. Of those, 41 percent said that knowing that person had a positive impact on their opinion of CTE, and 44 percent were more open to following a CTE pathway as a result. Furthermore, approximately one-third of teens reported that they would consider attending a CTE post-secondary school if it were viewed as just as valuable to employers as a four-year degree, if there was a stronger guarantee of a job after graduation, or if there was a guarantee that they would develop stronger career skills.
So what does all this mean for Ohio? At the most basic level, it’s a reminder for policymakers that it’s important to listen to all their constituents. Most teens can’t vote, but they are capable of assessing problems and proposing solutions. The QTQ surveys reveal that they want more information about post-secondary options and more opportunities to explore career pathways, and that those who are even partially aware of CTE view it as a promising tool to help them achieve their life-after-graduation goals. Lawmakers should listen. They could do so in two ways:
1. Increase awareness about CTE and existing programs.
In recent years, Ohio has prioritized strengthening education-to-workforce pathways. But there’s still more work to be done, and spreading awareness about opportunities that exist should be at the top of the to-do list. As the QTQ survey results indicate, there are thousands of students who don’t realize that CTE programs could help them get their foot in the door in a wide range of career fields. Ohio should remedy this by establishing a statewide informational campaign that focuses on reaching out to students and families and ensuring that they know about all the options available to them.
2. Ensure all students have plenty of opportunities to explore in-demand jobs.
In the words of QTQ, it’s vitally important to “actively disseminate information and resources while connecting students to the help they need to understand and pursue their desired path.” The statewide informational campaign proposed above could help actively disseminate information. But supporting students during their exploration and connecting them with opportunities is just as vital. Ohio could accomplish this in several ways:
***
As state leaders craft a plan for how to address the troubling learning losses revealed by NAEP and state assessments, CTE should be part of the discussion. Career exploration can help students pinpoint what they want to do after high school graduation, and rigorous CTE pathways can help them get there. Obviously, these opportunities don’t absolve schools of their responsibility to do whatever it takes to catch students up to pre-pandemic achievement levels. But they can help schools ensure that the next cohort of “Generation Covid” is set up for success.

Every two years, the National Assessment of Educational Progress (NAEP) checks the pulse of students’ math and reading achievement across the United States. After a one-year hiatus, the U.S. Department of Education released its latest data from tests given to a representative sample of students in early 2022. Though state assessment data and results from diagnostic testing vendors have already documented massive learning losses in the wake of the pandemic, this is the most comprehensive look at post-pandemic achievement across the entire country. In contrast to state exams, which provide a critical “in-state” look at student performance, NAEP offers insight into how Ohio stacks up nationally and against other states.
As widely reported, the national results are dismal, revealing once again the severe academic toll of the pandemic. U.S. Secretary of Education Miguel Cardona characterized the results as “appalling and unacceptable” and former Secretary Betsy DeVos called the achievement losses “a national crisis.”
But did Ohio students buck the trend? Unfortunately, the answer is no—the Buckeye State struggled just as much as others. In fact, given the relatively modest proportion of Ohio students in remote learning in 2020–21, the state’s learning losses were steeper than one might expect. What’s worse is that the NAEP data indicate that historically disadvantaged students in Ohio lost even more ground than their national counterparts during the pandemic.
We begin with the overall results in the four tested grades and subjects. In fourth grade reading and math, Ohio’s scores slid by three points in both subjects, losses that track the national decline in reading but are slightly smaller in math. Eighth grade scores in Ohio fell by five points in reading and plunged a whopping ten points in math—declines that exceeded the national losses in both subjects. To put these declines into some perspective, Ohio’s 2022 score in three of the four assessments is now at its lowest point since 2003. And some analysts consider ten point gains or losses on the NAEP scale roughly equivalent to one grade level or a year’s worth of learning. The good news—if one might call it that—is that achievement in Ohio still remains slightly above the national average on all four tests.
Figures 1-4: Trends in NAEP scores from 2003 to 2022, Ohio and national
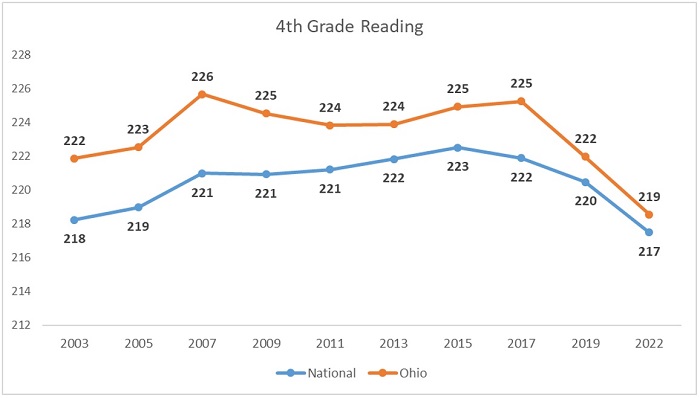
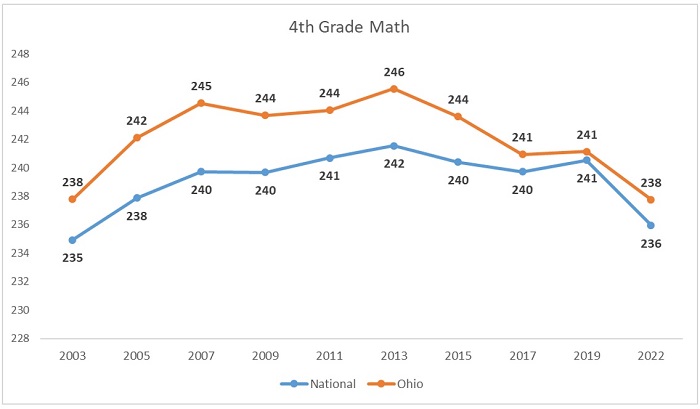
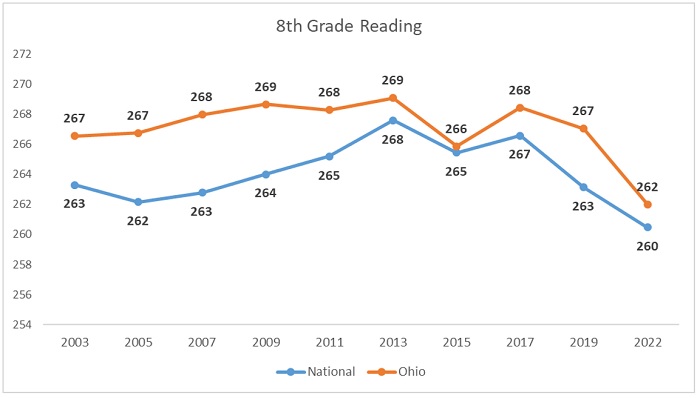
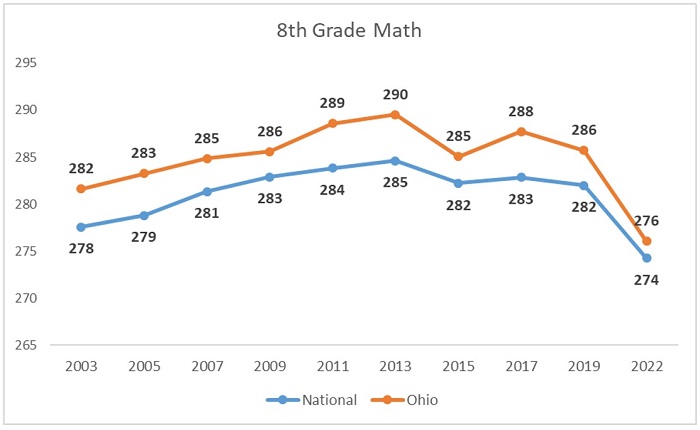
When we examine data broken out by student groups, the results are even more troubling. They indicate that Ohio’s Black and Hispanic students fared worse during the pandemic than the average Black and Hispanic student in the United States. Low-income students in Ohio also suffered larger learning losses than their national peers but only in fourth grade.
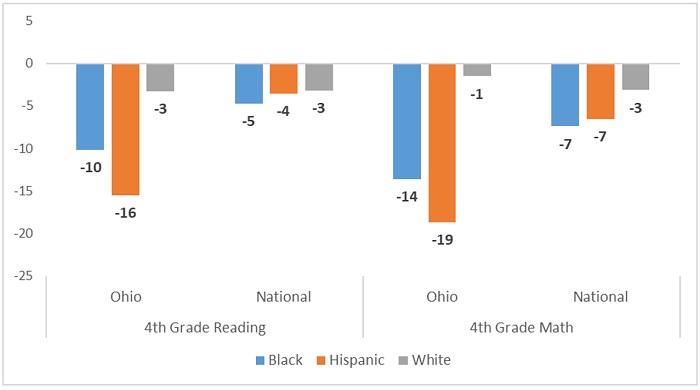
Figure 5 shows that in fourth grade, Ohio’s Hispanic students’ reading and math scores fell by 16 and 19 points, respectively, between 2019 and 2022, far exceeding the national declines for Hispanic students. These declines are so severe that Ohio now has the third lowest achievement in the nation for Hispanic students in fourth grade math and is the sixth lowest state in fourth grade reading. Meanwhile, the learning losses among Ohio’s Black fourth graders were double those of their national counterparts. Ohio’s Black students’ scores are now the sixth and seventh lowest in the nation in fourth grade math and reading, respectively. While state rankings for specific student groups are somewhat inexact due to smallish samples, it’s apparent that Ohio’s Black and Hispanic students are having greater academic difficulties than their peers in most other states.
Figure 5: Changes in fourth grade NAEP scores from 2019 to 2022 by major race/ethnic group, Ohio and national
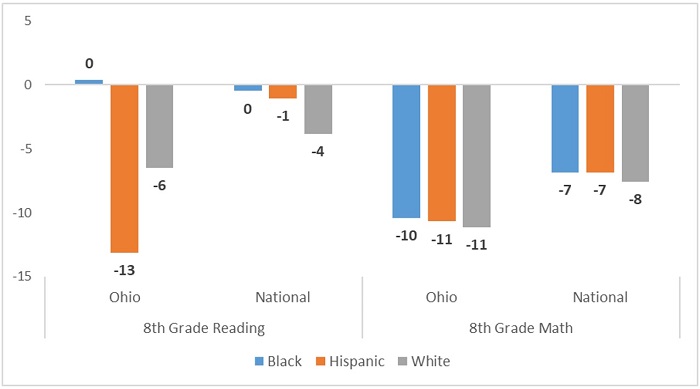
Turning to eighth grade, Hispanic students in Ohio also registered double-digit declines in both subjects, losses that exceeded those of their national counterparts. Interestingly, Black student achievement in both Ohio and across the nation held steady in eighth grade reading. But in math, Ohio’s Black eighth graders lost more ground than their national peers. Though Ohio’s state rankings for Black and Hispanic eighth grade students aren’t nearly as low as in fourth grade, their scores also fall below the national average (save for eighth grade math for Hispanic students). Figure 6 also reveals larger learning losses among Ohio’s White students than the average White student in the U.S., which helps explain the larger overall dip that the state experienced in eighth grade.
Figure 6: Changes in eighth grade NAEP scores from 2019 to 2022 by major race/ethnic group, Ohio and national
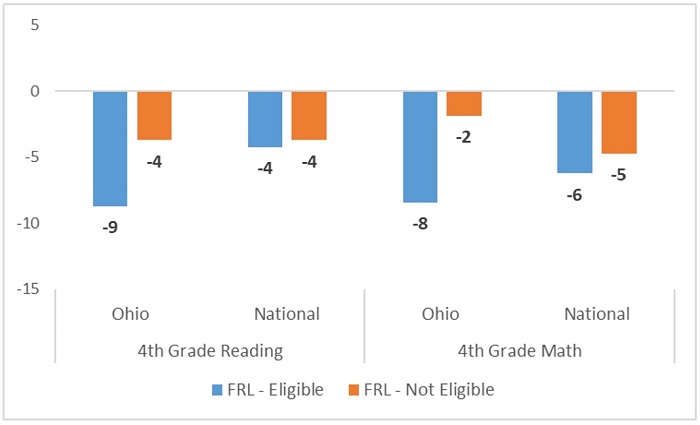
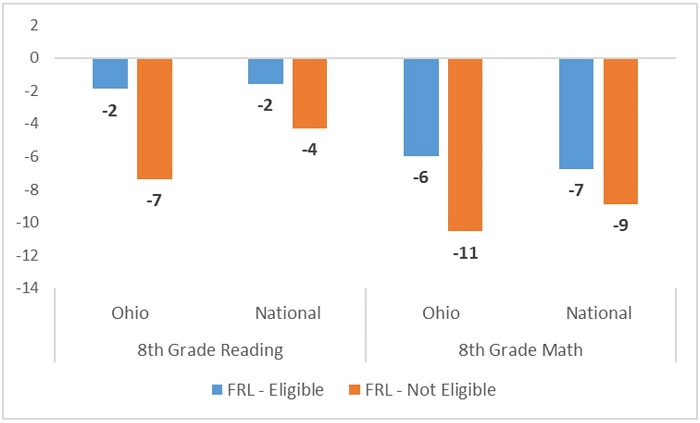
Finally, we look at results by student eligibility for federal free-and-reduced-priced lunch (FRPL), a proxy for low-income status. In fourth grade, we see larger learning losses for Ohio’s FRPL-eligible students compared to the average FRPL-eligible student nationally. The picture changes significantly in eighth grade. Somewhat surprisingly, in both Ohio and nationally, FRPL-eligible students posted noticeably smaller losses than their non-eligible (wealthier) peers. In this grade, the losses of Ohio’s FRPL-eligible students tracked more closely with those of their peers nationally.
Figures 7-8: Changes in fourth (top) and eighth (bottom) grade NAEP scores from 2019 to 2022 by FRPL-eligibility, Ohio and national
NAEP results always force us to pause and reflect on the state of education in Ohio and nationally. That’s true this year as well, but given the learning losses over the past couple years, they ought to compel us to action. The data are clear: Ohio students are suffering academically. Regrettably, Ohio’s top political leaders have barely said anything about the academic crisis at hand. That needs to change. Without a swift and effective policy response from state leadership, more young people will exit high school without the math and reading skills needed to succeed in life. That would be a tragedy not only for the state as a whole but for tens of thousands of future adult Ohioans.

Research is clear that a more diverse teaching force can improve a wide range of student outcomes. For students of color, such outcomes include the increased likelihood of enrolling in advanced math courses, higher attendance and course grades, lower dropout rates, improved social-emotional learning, and a decrease in the likelihood of exclusionary discipline. In Ohio, where students of color make up nearly 33 percent of the public school population, having a diverse teaching force that reflects student demographics is crucial. Unfortunately, that’s not the case: Over 90 percent of Ohio’s public school teachers are White.
To its credit, Ohio has taken a few steps in the right direction. The state’s ESSA plan, which was revised in early 2018, identifies diversifying the teacher workforce as a priority. During the fall of that same year, the state established a Diversifying the Education Profession in Ohio (DEPO) taskforce, and charged its approximately forty members with determining the root causes of diversity gaps and identifying several strategies to address them. And in August 2021, the state announced awardees for Diversifying the Education Profession grants, which will help over a dozen districts across the state diversify their staff.
But Ohio can and should do more, especially in light of the significant learning loss and teacher shortage concerns brought about by the pandemic. Thanks to the DEPO taskforce, which published a brief outlining several recommendations, state leaders already have several stakeholder-approved strategies from which to choose. This piece examines one of those ideas: providing scholarships and loan forgiveness to attract and retain teachers of color. (And no, the Biden Administration’s loan forgiveness policies don’t make that recommendation moot; more on that below.)
Although the DEPO taskforce report doesn’t delve too deeply into the research that backs this recommendation, there is plenty. For example, in 2018, the Brookings Institution examined whether districts offering a variety of financial incentives to teachers had greater diversity among their staff. Although the analysts cautioned that their findings didn’t identify causal relationships, they found “strong associations” between diversity and four incentives: providing funds to assist with relocation expenses, student loan forgiveness, bonuses for demonstrating excellence in teaching, and bonuses for teaching in schools that were located in “less desirable” locations.
The Brookings analysis reported that relocation assistance appeared to be the strongest predictor of a more diverse teaching force, followed by loan forgiveness, performance bonuses, and bonuses for teaching in certain locations. Analysts also pointed out that these incentives may have an “underlying rationale” that makes them particularly attractive to teachers of color. For example, data indicates that Black college students are more likely to take on student debt, that the disparity in student loan debt between Black and White students more than triples after graduation, and that Black and Latino students who train to become teachers are more likely to borrow federal student loans compared to their White peers. Research also reveals that debt can motivate graduates to choose substantially higher-salary jobs and, as a result, reduce the likelihood that they will choose to work in “low-paid, public interest” jobs like education.
A recent RAND study produced similar findings. After analyzing results from the 2022 State of the American Teacher survey, the study’s authors found that teachers of color identified increased pay and loan forgiveness as their top recommendations for recruiting and retaining more teachers of color. Researchers, policymakers, and practitioners who participated in a related panel discussion recommended these strategies, as well. And the study also noted that many interviewed teachers mentioned that reducing the cost of educator preparation overall—whether through scholarships, loan forgiveness, or lowered licensure exam fees—would attract more teachers of color to the profession.
In short, the DEPO taskforce recommendation seems spot on: Providing scholarships and loan forgiveness is a solid strategy, backed by research and anecdotal evidence, for attracting and retaining teachers of color. So far, though, Ohio hasn’t done much with it. The upcoming budget cycle is the perfect opportunity to change that. Here are two specific ideas:
If Ohio isn’t interested in investing in teacher candidates, they could provide financial relief to teachers by forgiving outstanding student loan debt. There are several states that offer a variety of loan forgiveness options that Ohio could use as models. But as is the case with scholarships, using state funds to forgive student loans might be controversial and politically difficult—especially since the federal government already offers loan forgiveness programs for teachers.
Political difficulty doesn’t mean there’s nothing to be done, though. A 2018 report from the federal Government Accountability Office noted that many borrowers don’t seem to understand or be aware of the requirements of the Public Service Loan Forgiveness (PSLF) program. PSLF and other federal debt relief programs (like TEACH grants) also have a troubling track record. Even in light of a recent overhaul, their lingering negative reputation might be enough to make prospective teachers assume loan forgiveness is out of reach. And while the student loan debt relief plan and changes to income-based repayment programs recently unveiled by the Biden administration should help both current and future borrowers, the average high school and college student might not understand all the ins and outs. The upshot? There are lots of debt relief options for teachers already in place, but complex rules, bad reputations, and a lack of knowledge could be limiting their reach and steering students of color away from the education field.
That’s where the state could step in. Ohio could establish a student loan ombudsman to help teachers navigate the complexity of loan forgiveness options. Requiring colleges to ensure that their students—especially teacher candidates, and especially candidates of color—have accurate, up-to-date, and concise information about student loan forgiveness options could be a gamechanger. Engaging with nonprofits and organizations that support college students and teachers of color and making sure that they, too, have access to information and resources is also critical. If Ohio can create and support a network that helps demystify loan forgiveness options for teachers, and then couple it with state-funded scholarships and grants that lessen the amount of debt teachers have in the first place, that could have a monumental impact on the pipeline and the current workforce.
Of course, as Brookings points out, scholarships and student loan forgiveness aren’t the only financial incentives that the state could consider. Relocation assistance could help bring talented out-of-state teachers to Ohio, but lawmakers would likely need to make some adjustments to licensure laws—adjustments I outlined in this brief—for that to work. Allowing districts to pay teachers more flexibly, creating a refundable tax-credit for teachers who choose to teach in high-need districts, and reforming Ohio’s pension system (all of which are also covered in the aforementioned brief) could also help make teaching more attractive, especially for candidates of color.
The bottom line is that if Ohio wants to strengthen the teacher pipeline and boost student academic outcomes, it needs to take steps to diversify the profession. As the DEPO taskforce report indicates, there are many ways to do that. But financial incentives—especially the scholarship and student loan forgiveness options outlined above—could be a great place to start.

The grouping of students into smaller, more homogeneous cohorts is a widespread instructional strategy utilized in elementary classrooms across the country. It is intended to boost the academic outcomes of all students through instruction targeted at an appropriate level, be that remedial or advanced or somewhere in between. As a research paper recently published in Educational Practice and Theory demonstrates, the manner in which groups are formed and the selection criteria for them has the potential to impact outcomes almost as much as the instruction given to them. The researchers posit that Instructional Grouping Theory (IGT) can optimize the grouping process for maximum student benefit and set out to prove it.
Maximization via IGT requires that students are ranked based on a particular attribute or set of attributes prior to grouping—specifically, facets closely related to the outcome desired. For elementary school students learning to read, for example, the easiest options would be prior grade performance and/or standardized test scores. Accurate and consistent measurement metrics matter, as well.
To create a mathematical version of how grouping works in a teaching context, the researchers assume a simply-scaled single attribute measurable for all individuals. We can call it prior test score or reading level or whatever. They also utilize a number of assumptions, including a set of twenty individuals to be broken into two smaller groups of equal size, an even attribute gap of 1 point between each ranked individual (e.g., the lowest-ranked individual has an attribute skill level of 1, the highest-ranked individual has a skill level of 20, and all others in between are separated from each other by just one point), an optimal learning environment is one in which individuals are taught at a level as close as possible to their skill level, an optimized grouping system is that which maximizes the collective benefit for all students, etc. Some of these assumptions appear geared mainly for simplicity of calculation rather than to try and reflect any part of real life in mathematical form. Seriously, why not a bell curve for skill distribution?
They first run their model for a cross-sectional grouping, in which the resulting groups are equal in the attribute of interest but contain both high-ranked and low-ranked individuals. That is, Group 1 comprises those individuals ranked 1, 3, 5, 7, 9, 11, 13, 15, 17, and 19 in, say, prior test scores, and Group 2 comprises those ranked 2, 4, 6, 8, 10, 12, 14, 16, 18, and 20. Thus while each group has the same combined rankings, there is a wide gap between the top and bottom performers in each. Even by setting a similar instructional level for each group at the mean attribute ranking of 10, the result is that half of each group would be instructed at a level above their demonstrated skill level and half would be instructed below their skill level. Those at the top and bottom of the ranking in each group would receive instruction nine levels away from their skill level. The teaching level can be adjusted up or down, of course, but to do so in this scenario would mean that more than half of the members of each group would be either lost or bored during instruction, depending upon which end of the spectrum you chose to focus, and that the distance between the instructor’s level the student at the farthest end of the skill distribution would be even larger than before.
Next the researchers run the model for a like-skilled grouping, in which Group 1 comprises the bottom half of the attribute ranking (1–10) and Group 2 the top half of the ranking (11–20). While the two groups are not equal to each other in terms of prior test scores (or reading level or whatever attribute is germane to the outcome), the gap between the top- and bottom-ranked individuals in each group is the same and is smaller than the gaps in the cross-sectional groups. Each of the like-skilled groups have a different mean attribute level, but setting the instruction level to the respective mean in either group results in a maximum gap between instruction and skill of 8.25. Changing the skill level in this model results in a similar dilemma as in the previous model.
Changing the model to create four equal groups rather than two reduces all measured gaps between instruction and student skill level in both types of grouping. However, the gaps are still smallest in the like-skilled grouping example.
In the end, the researchers cleanly streamline what with humans is an often messy grouping process that contains the possibility of extraneous and irrelevant attributes creeping in. Additionally, individual students will not line up in neat single-digit rankings. That being said, the theory is sound and the math doesn’t lie. If ability grouping is meant to boost all individuals toward higher outcomes, smaller groups of similarly-skilled individuals maximize whatever benefits grouping provides and run less risk of negative impacts through excessive over- or under-teaching.
SOURCE: Peter D. Wiens, Christine Zizzi, and Chad Heatwole, “Instructional Grouping Theory: Optimizing Classrooms and the Placement of Ranked Students,” Educational Practice and Theory (October 2022).

When and why families stop using school choice programs might be just as important to understand as why they opt into them in the first place. While supporters and researchers typically focus on issues of school quality, educational fit, and student needs, new data from Michigan suggest there is much more at play. Access to educational options is meant to decouple schooling from zip code, but utilizing those choices year after year—even free public options—often requires sacrifices of time and money from families. Residential moves and changing commute times add another set of variables to an already complicated equation.
Researchers Danielle Sanderson Edwards and Joshua Cowen examine the relationships between residential mobility and the use of charter schools and inter-district choice. They track a cohort of over 75,000 Michigan students who began kindergarten in 2012–13, had a normal grade progression (no retention or skipped grades), and were present in the data for all years through fifth grade. Only students who attended general education, public, brick-and-mortar schools were included.
Students are compared to one another in three groups: those attending a charter school, those utilizing inter-district choice, and those attending a school in their district of residence (called “resident students”). Overall, a higher percentage of students using both charters and inter-district choice programs come from disadvantaged backgrounds and have lower average achievement compared to resident students. A higher percentage of inter-district choice students live in rural areas, whereas the majority of charter school students live in cities, have low levels of achievement, and are Black and economically disadvantaged.
Absent data on the relative quality of assigned schools versus chosen schools, Edwards and Cowen track students’ school choice utilization over each of the six years along with their residential moves during the same period and find some interesting connections. Almost half of all students observed in kindergarten moved at least once before the end of fifth grade. Of those using inter-district choice, 49 percent moved at least once; 75 percent of those movers ended up exiting inter-district choice by the end of fifth grade, as did 13 percent of non-movers. Fifty-six percent of students who began in charter schools moved at least once; 55 percent of those movers exited charter schools, as did 27 percent of non-movers. By comparison, a slightly smaller number of kindergarten resident students (43 percent) moved at least once in the same period. Edwards and Cowen focus mainly on school choice exiters throughout, but it feels important to note that 15 percent of resident students who move after kindergarten opt into one of the two choice camps when they do. More on this below.
Distance between home and school also appear linked with exits from choice, with five minutes of driving time being a strong dividing line. The farther from home a choice school was in kindergarten, especially over the five-minute line, the more likely a family was to exit that choice program at some point in the next six years. This observation was more pronounced in inter-district choice than in charter families. Research shows families will travel far for a good choice, but that there is a limit beyond which quality must take a backseat.
Interestingly, nearly half of families who exited inter-district choice did so by moving into the district where they had chosen to enroll, allowing their children to become resident students there. A further 28 percent of inter-district exiters moved into a third district to become residents there. Additionally, 37 percent of students who exited resident student status remained in their original school after moving to another district, thereby becoming “school choice” families due to the need to move rather than in an effort to find a better school.
What does all this mean? At base, it means that school choice programs are not just about school quality or fit. The best laid educational plans of families can go astray for many non-educational reasons. Nearly half of all the Michigan families in the study were mobile between 2012 and 2018, likely for understandable and pragmatic reasons such as finding more affordable rent, moving closer to family or employment, living in a safer area, needing a larger house or apartment, etc. If you’ve organized your family life around a school of choice and that life is uprooted, sometimes even the best school becomes untenable and the search must begin again among a new set of options.
But largely unexplored here is the fact that school choice can also help mobile families. Moving across district boundaries but using inter-district choice to keep kids in the same school is one such positive aspect; virtual schools (not included in Edwards and Cowen’s analysis at all) fully and completely decouple address from school enrollment. Gamechanger. Unlike Ohio, Michigan doesn’t have vouchers to expand lower-cost options or state-mandated busing to help kids to get to school. But that is not to say that the info presented here is not worth reading. Those who support school choice would do well to acknowledge the intersecting family needs illuminated by this report. But one can only imagine what the same research would reveal in the Buckeye State!
SOURCE: Danielle Sanderson Edwards and Joshua Cowen, “The Roles of Residential Mobility and Distance in Participation in Public School Choice,” National Center for Research on Education Access and Choice (October 2022).