For nearly two decades, Ohio’s EdChoice program has unlocked private school options for tens of thousands of students by offering state-funded scholarships. Students slated to attend low-performing schools have long been eligible for the financial assistance, and over the last decade, depending on their grade level, low- and middle-income students have become eligible, as well. In this year’s state budget bill, lawmakers expanded eligibility to include every student in the state, regardless of their assigned school or household income, with poorer families receiving larger scholarships than more affluent ones. In part because the program now covers private school students who hadn’t previously received state support, universal eligibility is expected to increase state expenditures on all scholarship programs from about $600 million in FY23 to $1.1 billion by FY25.
All this has further intensified the incessant complaining from private school critics, who are already suing the state over EdChoice. They continue to portray school funding as a zero-sum game, with the growth in scholarship support being framed as depleting the resources available to public schools. Dan Heintz, a school board member of Cleveland Heights-University Heights—a district that spent a whopping $23,000 per pupil in FY22—griped, “A billion dollars a year is being diverted to families using private schools.” Union boss Scott DiMauro of the Ohio Education Association muttered, “A dollar more for private school vouchers is a dollar less for public schools.” Tanisha Pruitt of the liberal, union-backed Policy Matters Ohio grumbled, “We're putting too much money into one system (private) while we're neglecting the other.”
The facts, however, simply don’t square with the rhetoric. Students in public schools continue to receive far more taxpayer support than scholarship students, and funding for the public school system has never been higher in Ohio. Moreover, state outlays for districts will continue to rise this school year and next. Hardly the “neglect” or “diversion” that is regularly alleged. But don’t just take my word for it—here are the data.
Fact 1: School district funding easily outpaces scholarship amounts
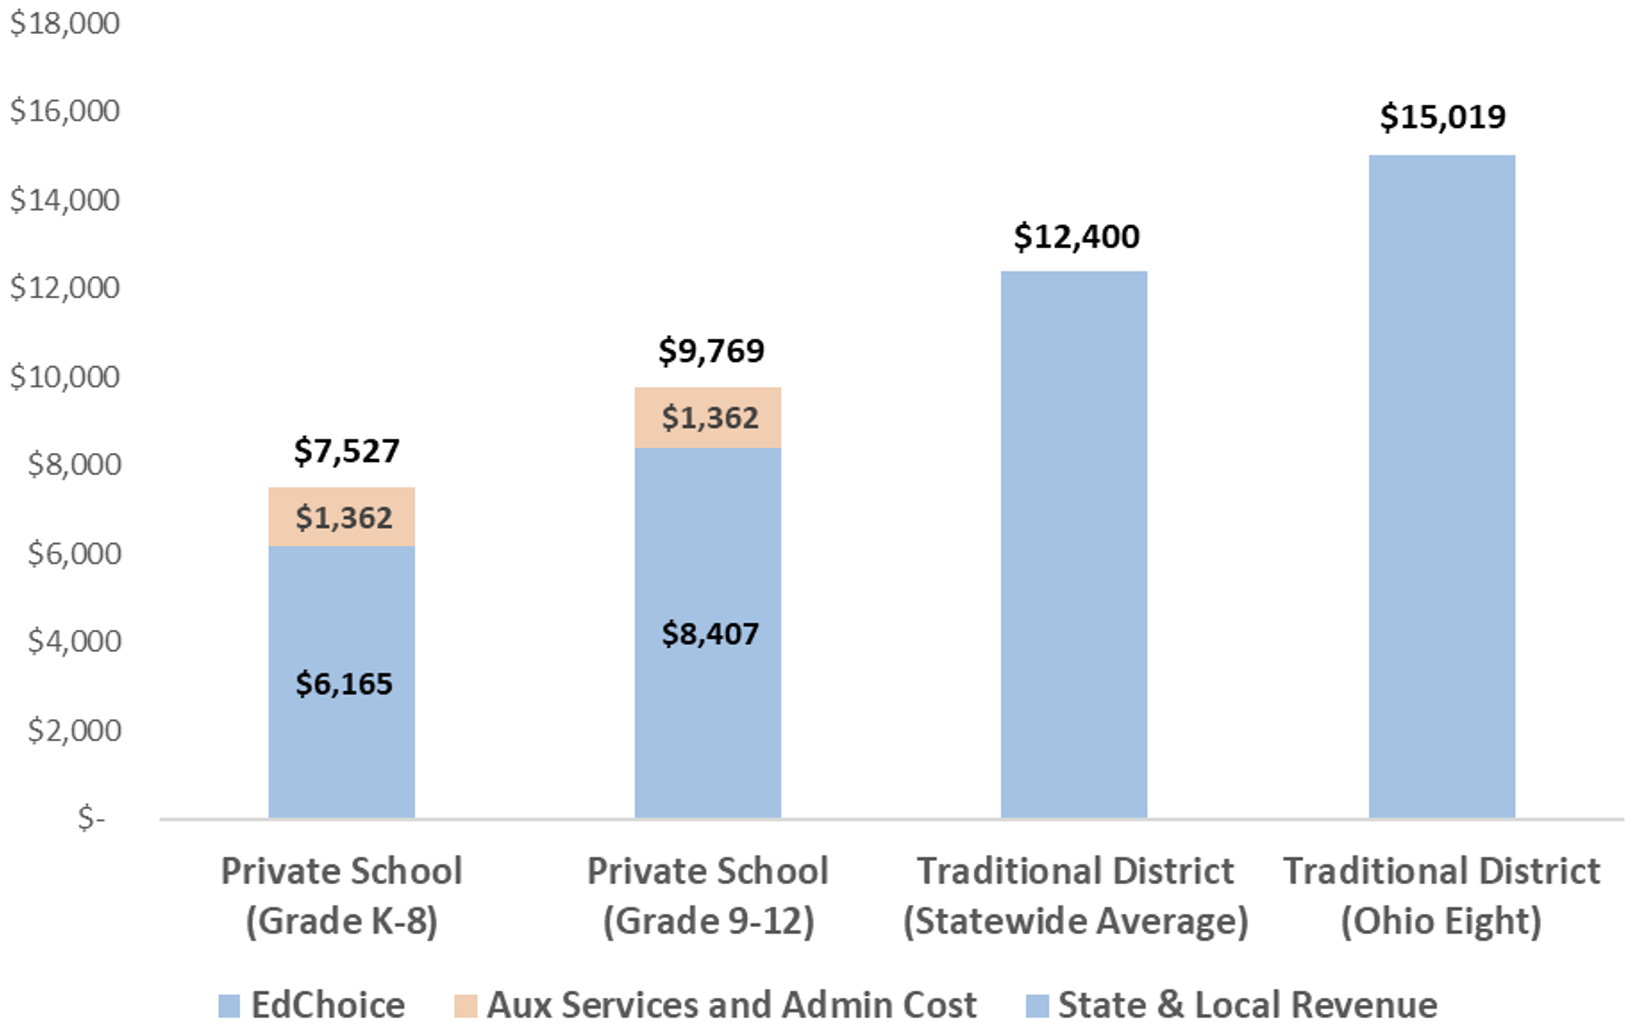
When examining the totality of taxpayer support for Ohio districts, it’s hard to say with a straight face that they are being shortchanged. Figure 1 shows overall taxpayer funding for districts statewide, as well as for the Ohio Eight districts—the places that have historically had the largest numbers of students using an EdChoice scholarship (the largest of the eight, Columbus, is also a plaintiff in the lawsuit). The district numbers include state and local taxpayer revenue,[1] the latter of which includes a minimum 20 mill (or 2 percent) state-required property tax. That baseline tax is accounted for in the state’s funding formula, thus explaining the relatively modest “direct” state aid that wealthier districts usually receive. The chart also displays the public subsidy for private-school students’ education, inclusive of both the current full EdChoice scholarship amounts and two small state funding streams that private schools receive (auxiliary services and administrative cost).
On average, districts statewide received $12,400 per pupil in state and local funding in FY22, well above the amounts for scholarship students who receive roughly $7,500 and $9,800 in public support depending on grade level. The Ohio Eight districts receive even higher funding than the average district (just over $15,000 per pupil). Thus, the funding differentials in Ohio’s big cities are quite large, with scholarship students—most of whom are likely from low-income households—getting the short end of the stick.
Figure 1: Private school (full scholarship amount) versus statewide district and Ohio Eight district per-pupil funding

Notes: The year of data used for this chart vary depending on data availability. EdChoice scholarship amounts are for FY24, while auxiliary services and administrative cost reimbursement totals are for FY23. The state and local revenue totals for traditional districts are from FY22, the most recent year of complete fiscal data (the differentials would be larger if more recent data were used). Average statewide and Ohio Eight transportation expenditures per pupil from FY22 are subtracted from district revenues, as they are responsible for providing transportation to private school students. The Ohio Eight districts are Akron, Canton, Cincinnati, Cleveland, Columbus, Dayton, Toledo, and Youngstown.
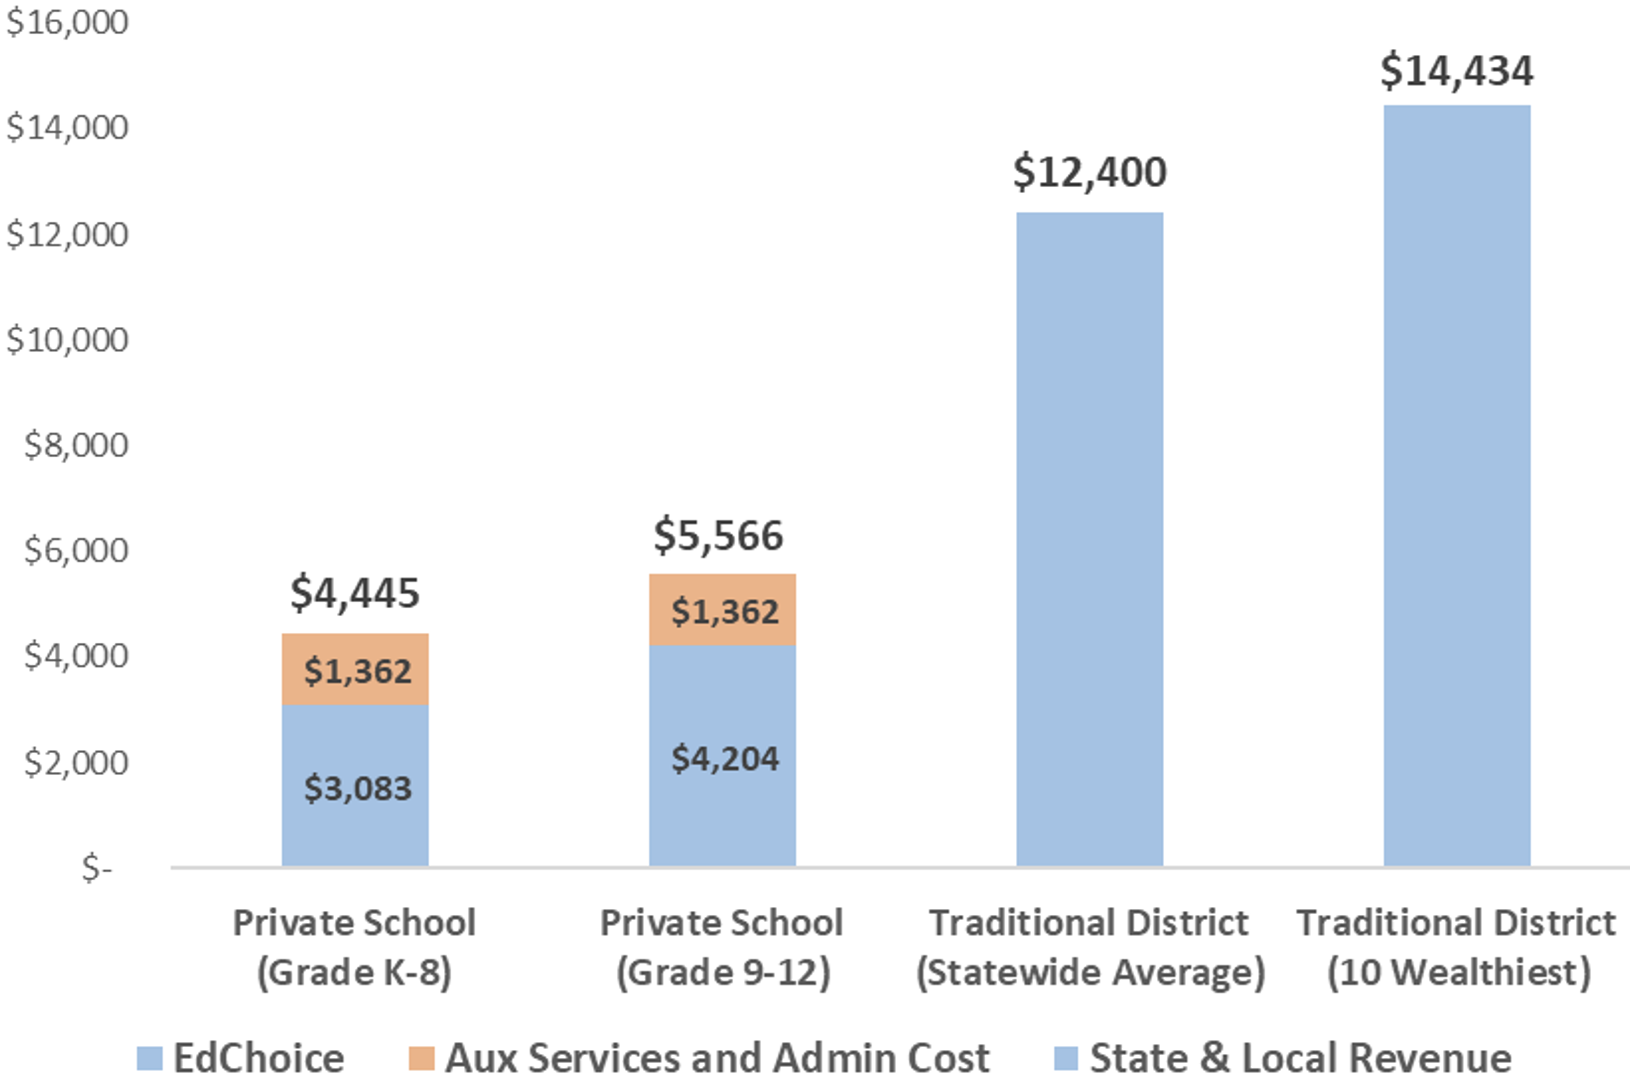
The funding differences tend to be even wider for wealthier students whose EdChoice scholarships are reduced via the sliding scale that lawmakers put in place as they expanded eligibility to all. For a student receiving a “half scholarship”—which would apply to families of four earning $165,000—their total public subsidy is about $4,500 for K–8 and $5,500 for high school. As figure 2 indicates, students attending one of the state’s wealthiest school districts receive more than $14,000 in taxpayer support. Arguably, it’s less critical to make up the gap for wealthier private school students, but the fact remains that state and local taxpayers far more heavily subsidize their public school counterparts’ education.
Figure 2: Private school (half scholarship amount) versus statewide district and wealthiest district per-pupil funding

Note: The ten wealthiest districts had the lowest percentages of economically disadvantaged students in FY22.
Fact 2. District funding continues to rise
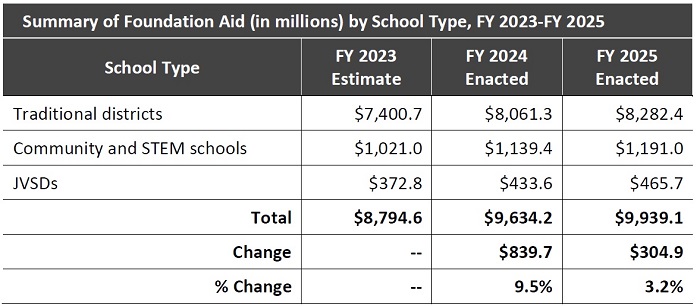
As noted above, some of the recent criticism of EdChoice centers on the increase in state outlays that helps fund universal eligibility, with the suggestion that districts’ funding was also somehow cut (“a dollar less for public schools”). But that’s nonsense. The table below appears in the Ohio Legislative Service Commission’s analysis of the enacted budget. It shows the aggregate “foundation aid”—the main pot of state money that is allocated to K–12 education—that school districts, public charter schools, and joint-vocational school districts (career-technical providers) receive this year and next.
It’s clear that district funding increases significantly over the biennium—from $7.4 billion in FY23 to $8.3 billion by FY25, amounting to a $882 million, or 12 percent, increase in state aid. If joint-vocational districts are added, the increase reaches $975 million over the biennium.[2] Bear in mind, too, that this total doesn’t even include the additional $170 million in state funding dedicated to early literacy initiatives and some $250 million more in career-technical education spending—all of which is non-foundation funding. The vast majority of those set-asides will go to traditional districts, leaving their total increase north of $1 billion. At the end of the day, state lawmakers grew the size of the pie for all types of Ohio schools. That’s something to cheer—not disparage.
Table 1: Increase in state spending for traditional districts in FY24–25

Source: Ohio Legislative Service Commission.
Fact 3. Ohio is spending record amounts on public schools
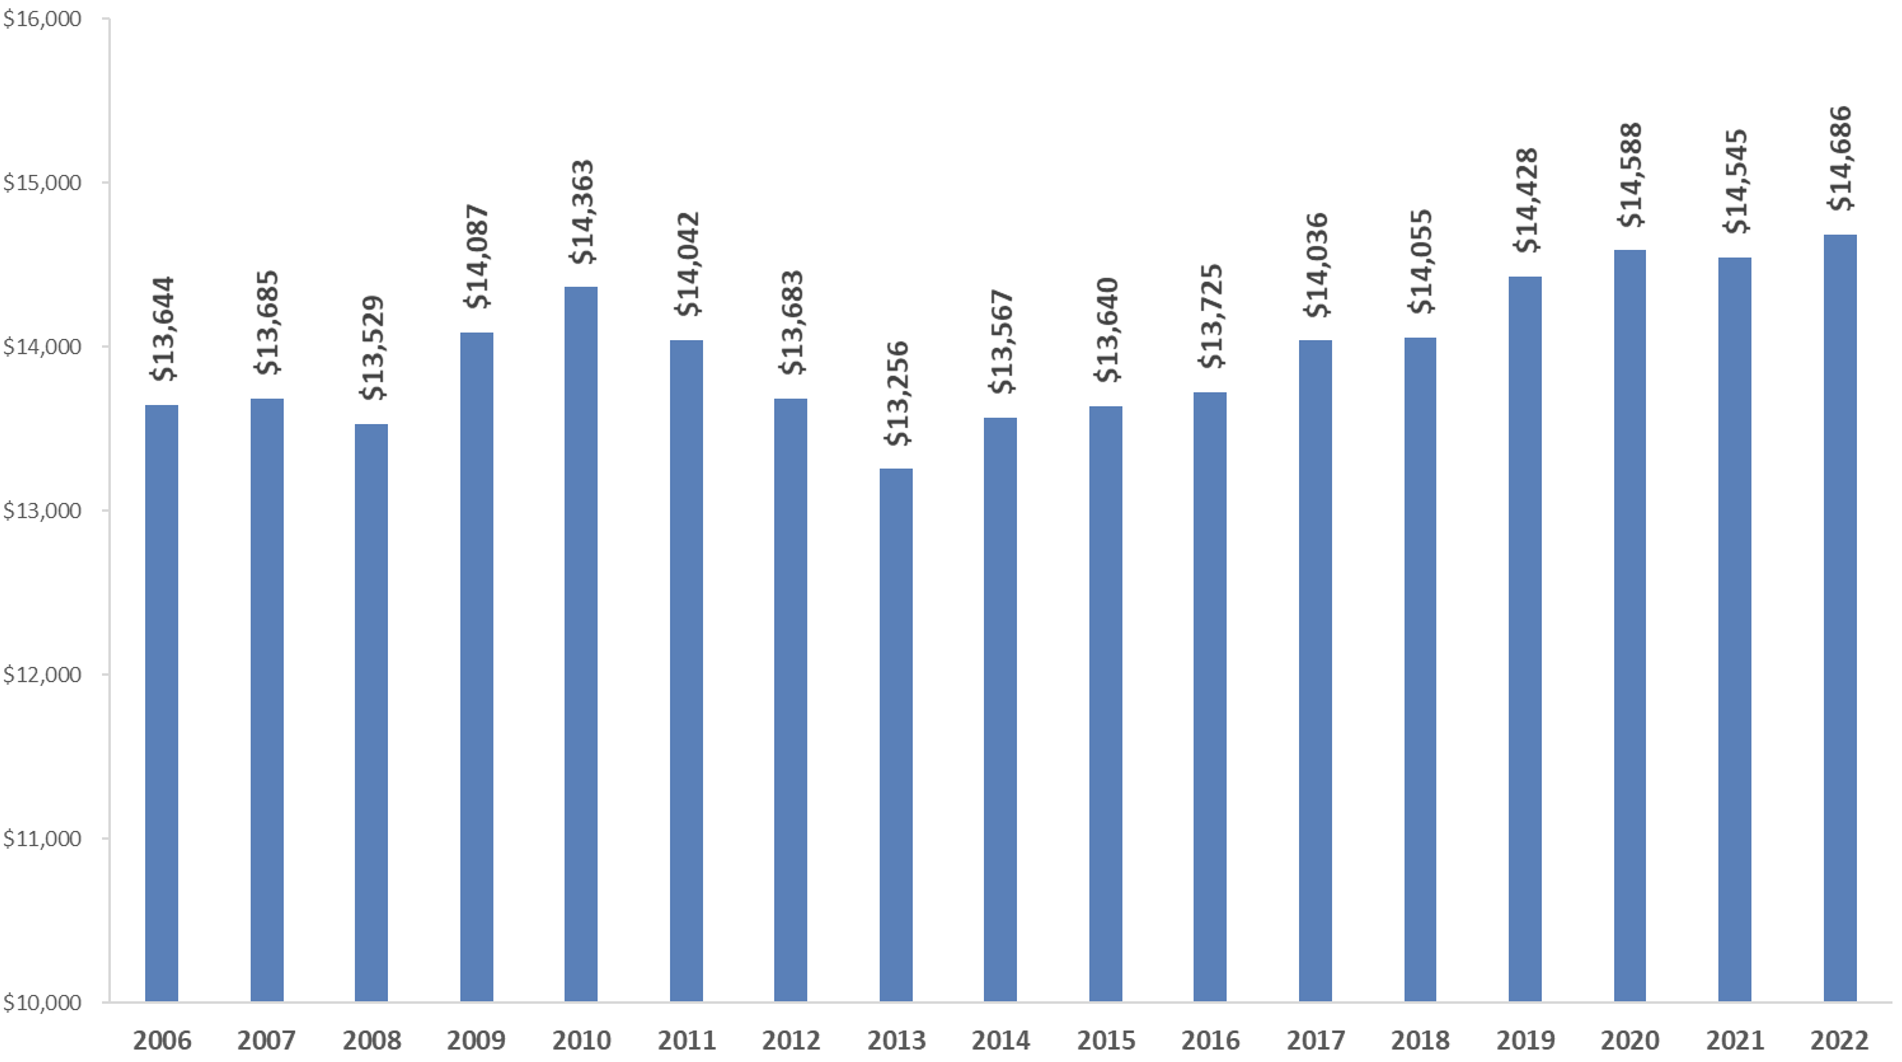
What is almost never said by private school opponents is the simple fact that Ohio spends more now—even adjusted for inflation—than it ever has on public schools. In FY22, average district spending reached $14,686 per pupil, the highest on record since 2006. My report from a couple years ago has spending data stretching further back—to 1990—and there is no year during the 1990s and early 2000s when spending was higher than in recent years. The long-term trend of increased public school spending is yet another indicator that public schools are not being systematically “defunded” as educational choice expands in Ohio. As additional evidence, a rigorous analysis of EdChoice’s fiscal impacts from its launch in 2006 to 2019 determined that growth in scholarship participation had no impact on districts’ per-pupil spending. Bottom line: Traditional districts now have more resources than ever to create the type of learning environments that help students succeed.
Figure 3: Per-pupil expenditures, Ohio public schools, 2006–2022

Note: Spending data from 2006–2021 are adjusted for inflation (to 2022 dollars) using the consumer price index. This chart relies on expenditure data (while figures 1 and 2 use revenue data) because, historically—until FY22—Ohio reported inflated per-pupil revenue data for some districts due to the former use of a “pass through” method to fund charters and most private school scholarships. Now that choice programs are “direct funded” from the state, districts’ per-pupil revenues are accurately reported as of FY22.
Celebrated free-market economist Thomas Sowell was recently asked what changed his mind about Marxism, and he promptly replied, “Facts. If you pay attention to them, you realize that they don’t square with what’s being said.” In our small corner of education policy in Ohio, some people are saying lots of things about school choice programs and their alleged impact on public school funding. But when we look more closely at the basic facts, their claims amount to nothing more than tall tales.
[1] I exclude districts’ federal revenues, which account on average for about 10 percent of total funding, as well as non-tax revenues (e.g., fees and sales of assets), to ensure a clearer picture of Ohio taxpayer contributions to education.


