
NAEP 2017: America's "Lost Decade" of educational progress
By Michael J. Petrilli

By Michael J. Petrilli


As feared, the new results from the National Assessment of Educational Progress show that national trends are mostly flat. Coming on the heels of some modest declines in 2015, the 2017 scores amount to more bleak news. It’s now been almost a decade since we’ve seen strong growth in either reading or math, with the slight exception of eighth grade reading. There’s no way to sugarcoat these scores; they are extremely disappointing.
Figure 1. Average scale scores, reading, grade 4
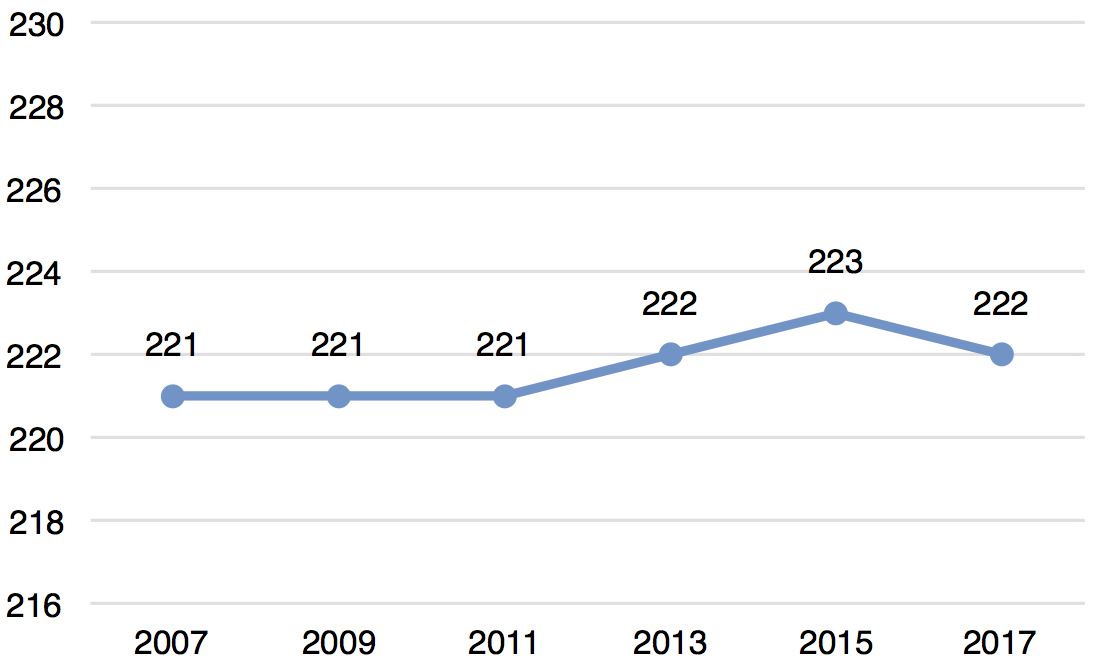
Figure 2. Average scale scores, math, grade 4
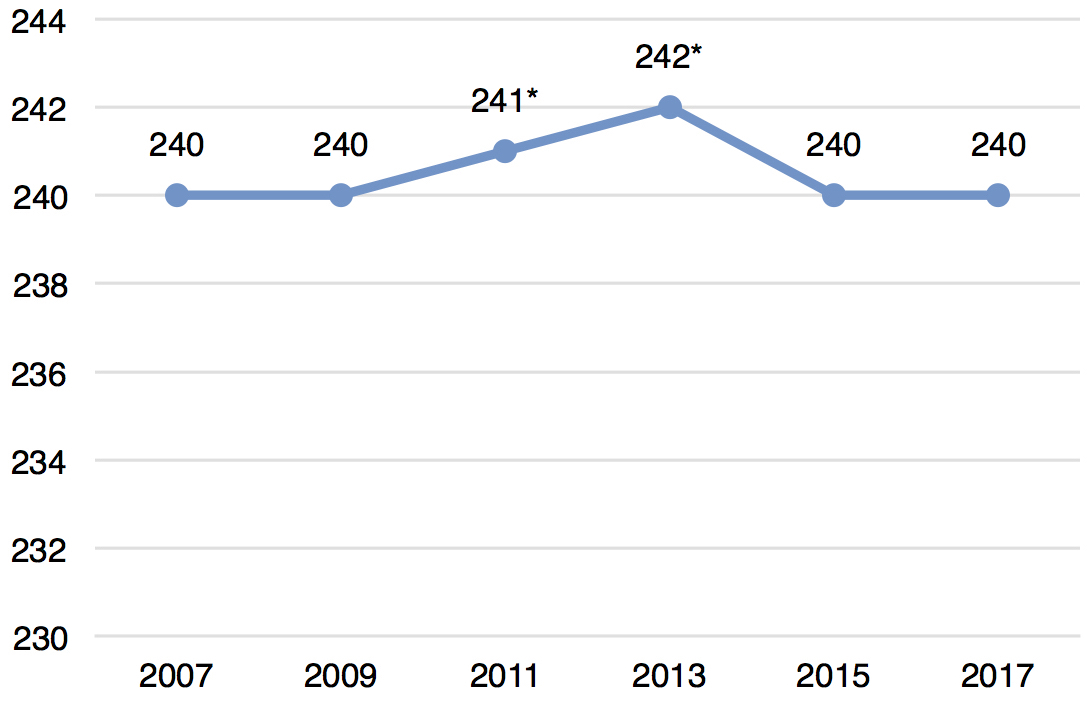
Figure 3. Average scale scores, reading, grade 8
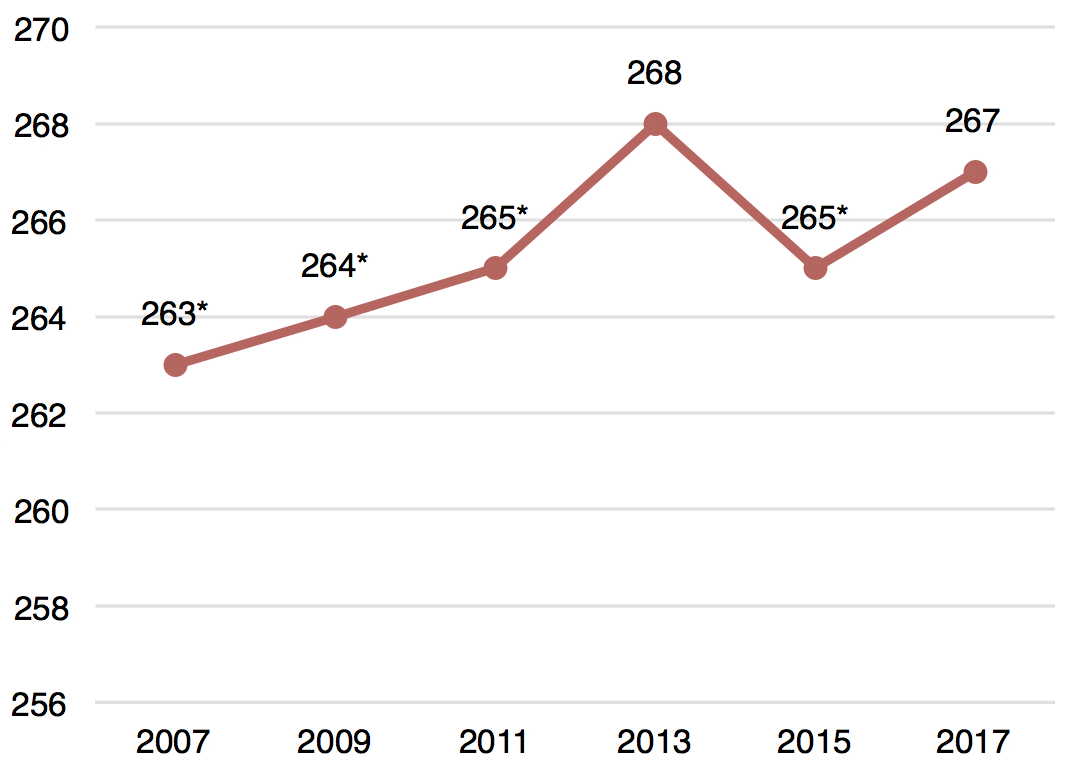
Figure 4. Average scale scores, math, grade 8
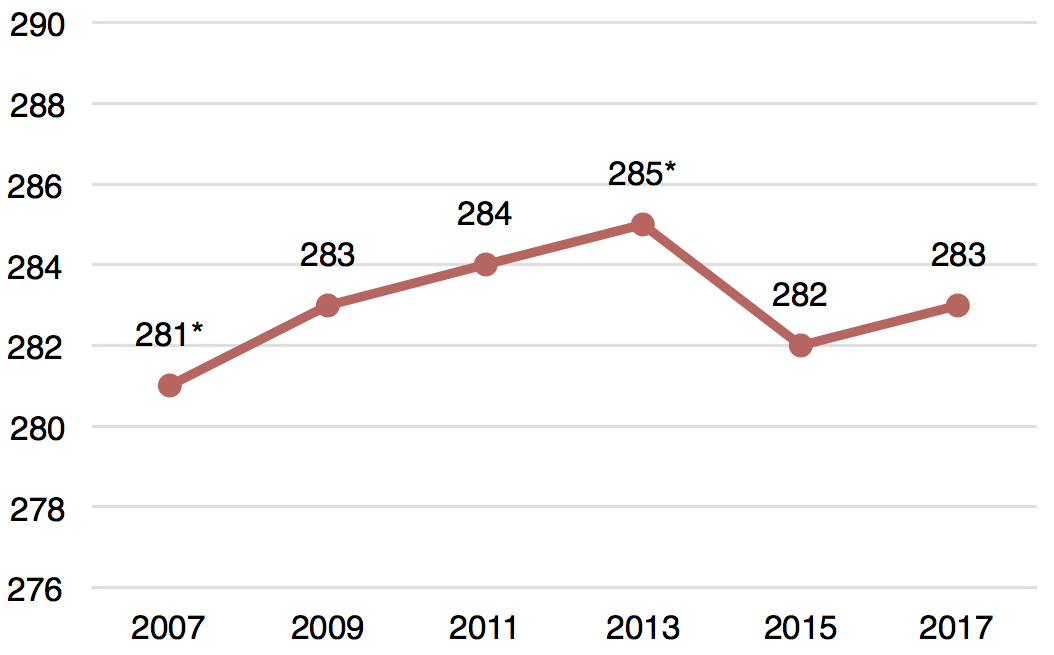
(In figures 1–4, an asterisk signifies a score that’s significantly different (p<.05) from 2017.)
The obvious question is why, and that’s something that NAEP can’t tell us. (Indeed, it’s NAEP’s job to give us the facts, not the underpinning explanations.) We can certainly identify hypotheses, but it’s going to take some time for scholars to gain access to restricted-use data and crunch the numbers to determine which hunches, conjectures, and justifications may hold water. Among the possibilities that make the most sense to me: the Great Recession, which negatively impacted school spending and also the home lives of a number of children; the backing away from test-based accountability, what with NCLB waivers followed by an “accountability pause” in many states as we transitioned to the Every Student Succeeds Act.
But let’s not get ahead of ourselves. Before we get to the “why,” let’s look at the “what”; let’s dig into the seven story lines I suggested last week. As I’ve been arguing for a while now, we should look at results over at least four years; examine subgroups and not just averages; and check for statistically significant changes at the national, state, and local levels.
Table 1: Statistically significant changes in national results from 2013–17

Table 2: Statistically significant changes for each state from 2013–17
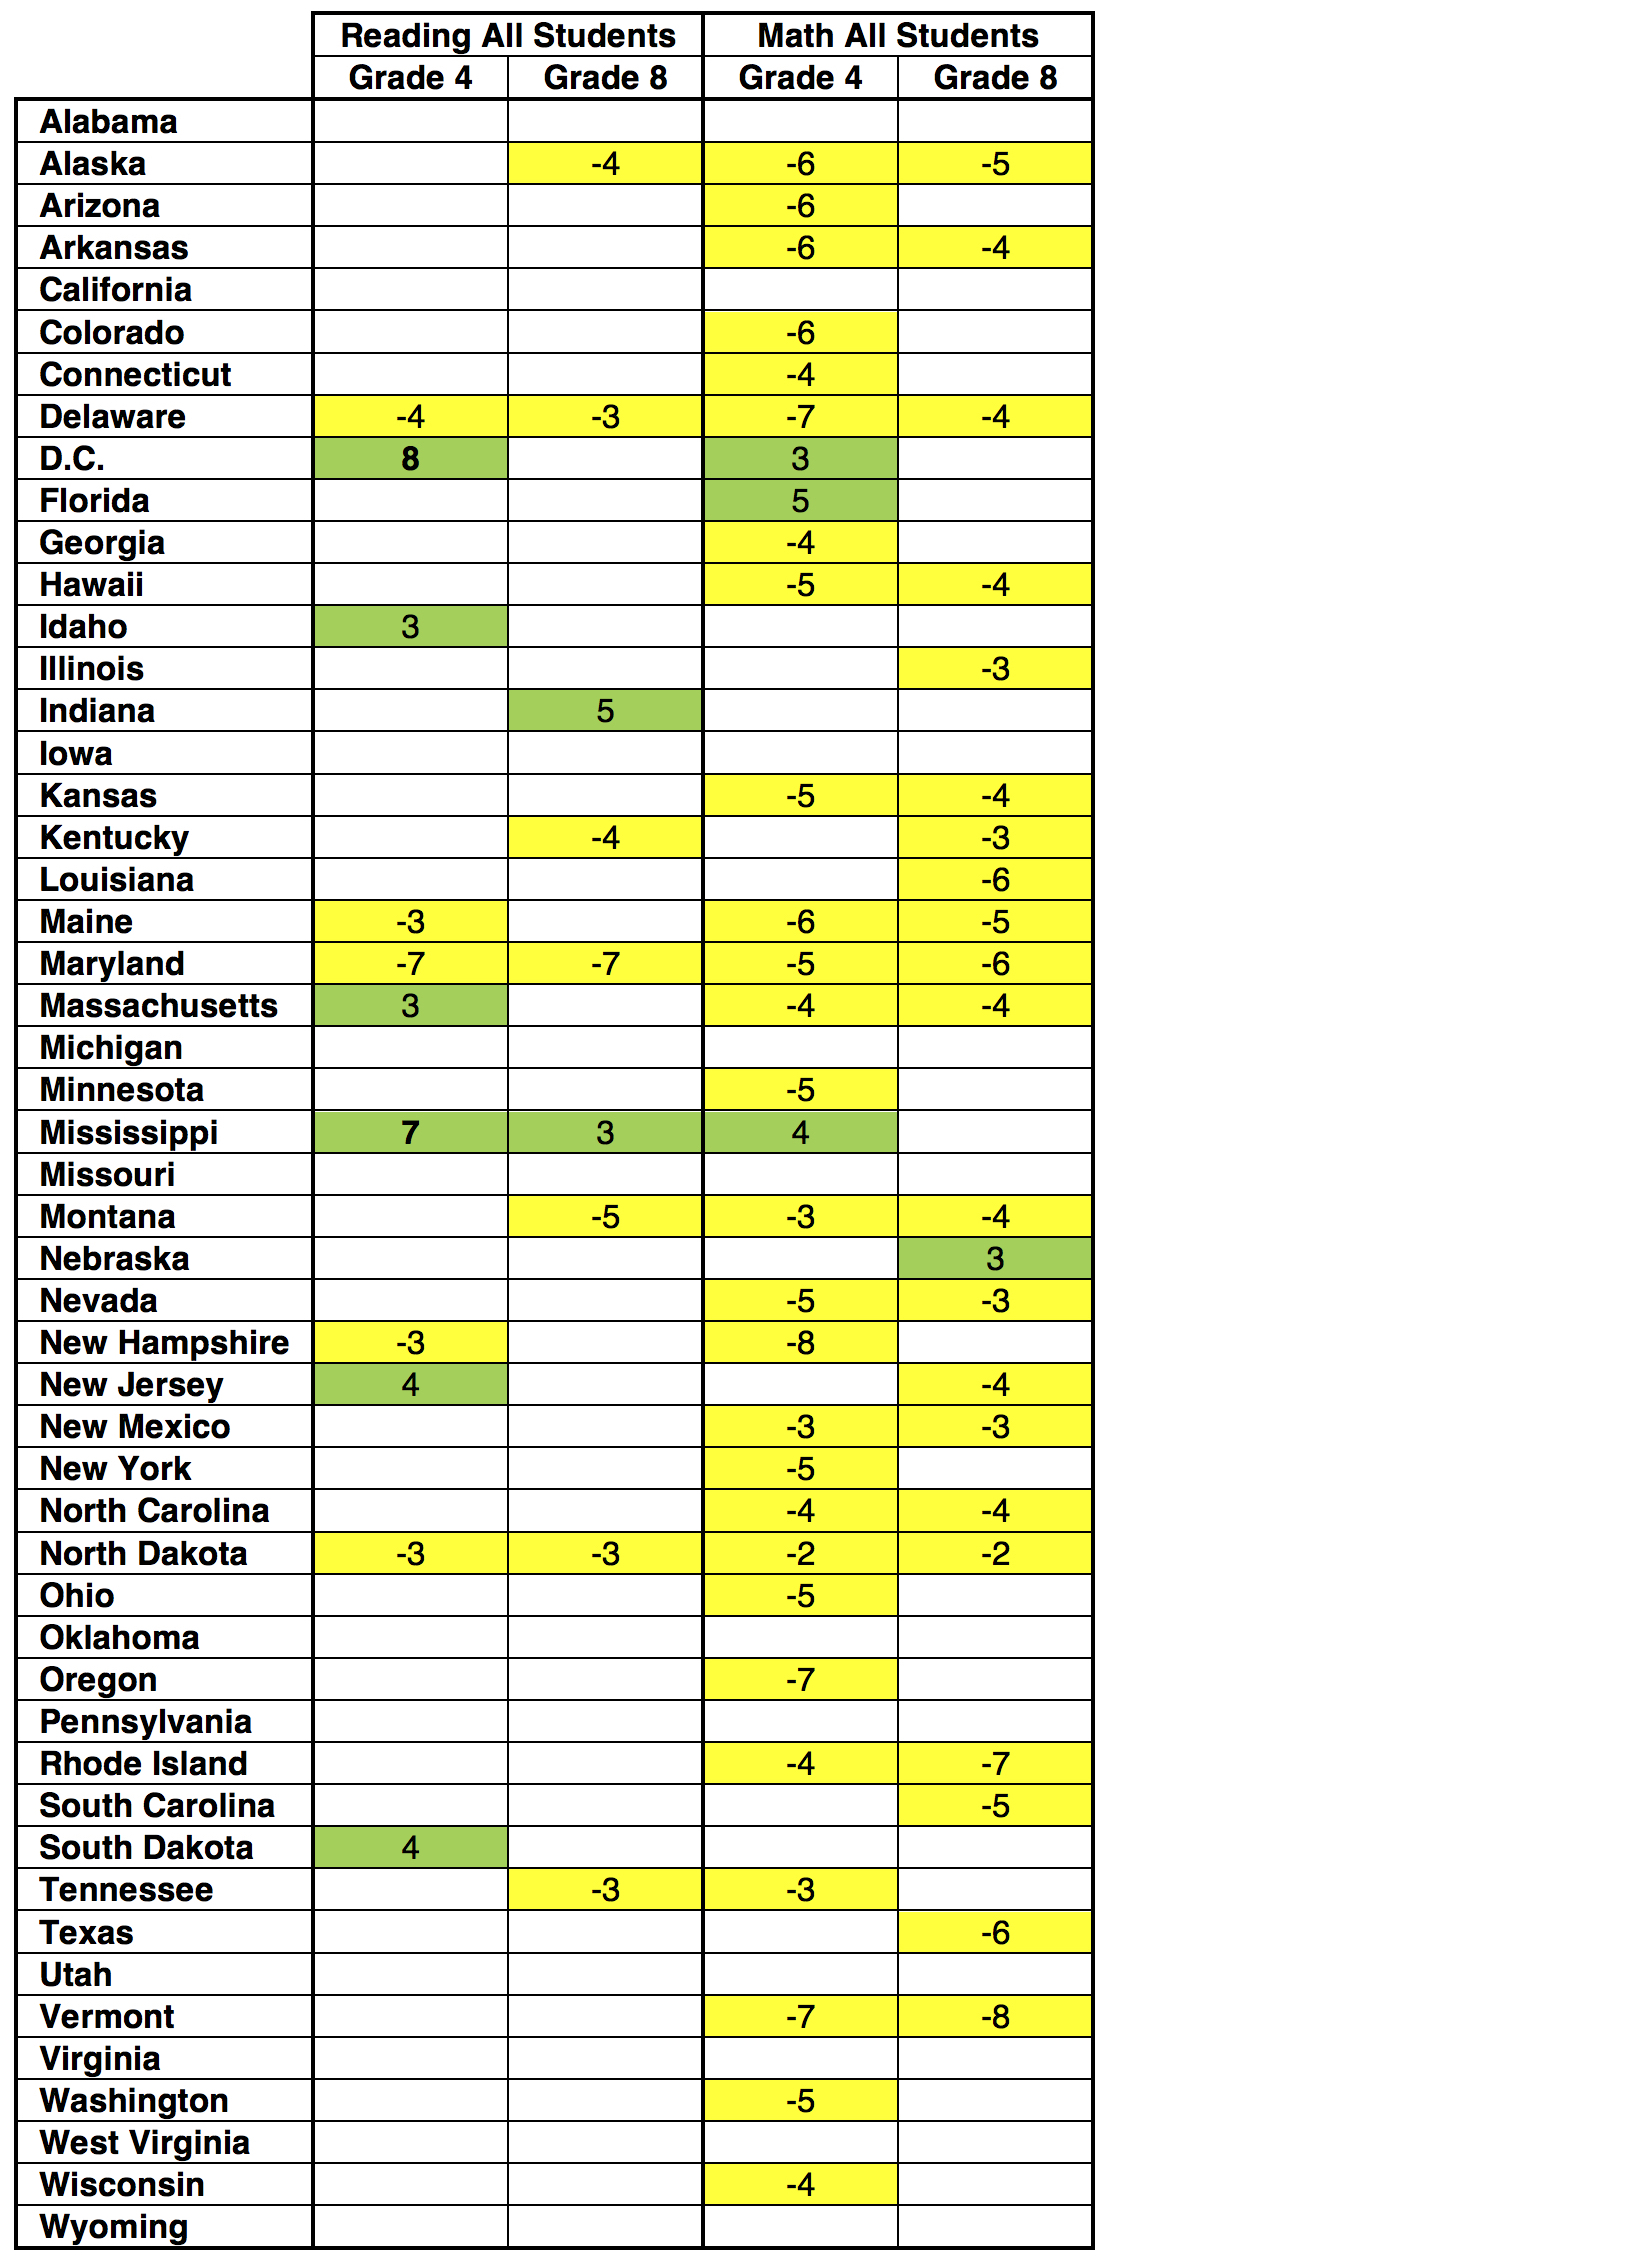
That’s not a particularly pretty picture, especially in math. Some highlights:
Now let’s examine subgroups for each state:
Table 3: Statistically significant changes for each state and subgroup from 2013–17
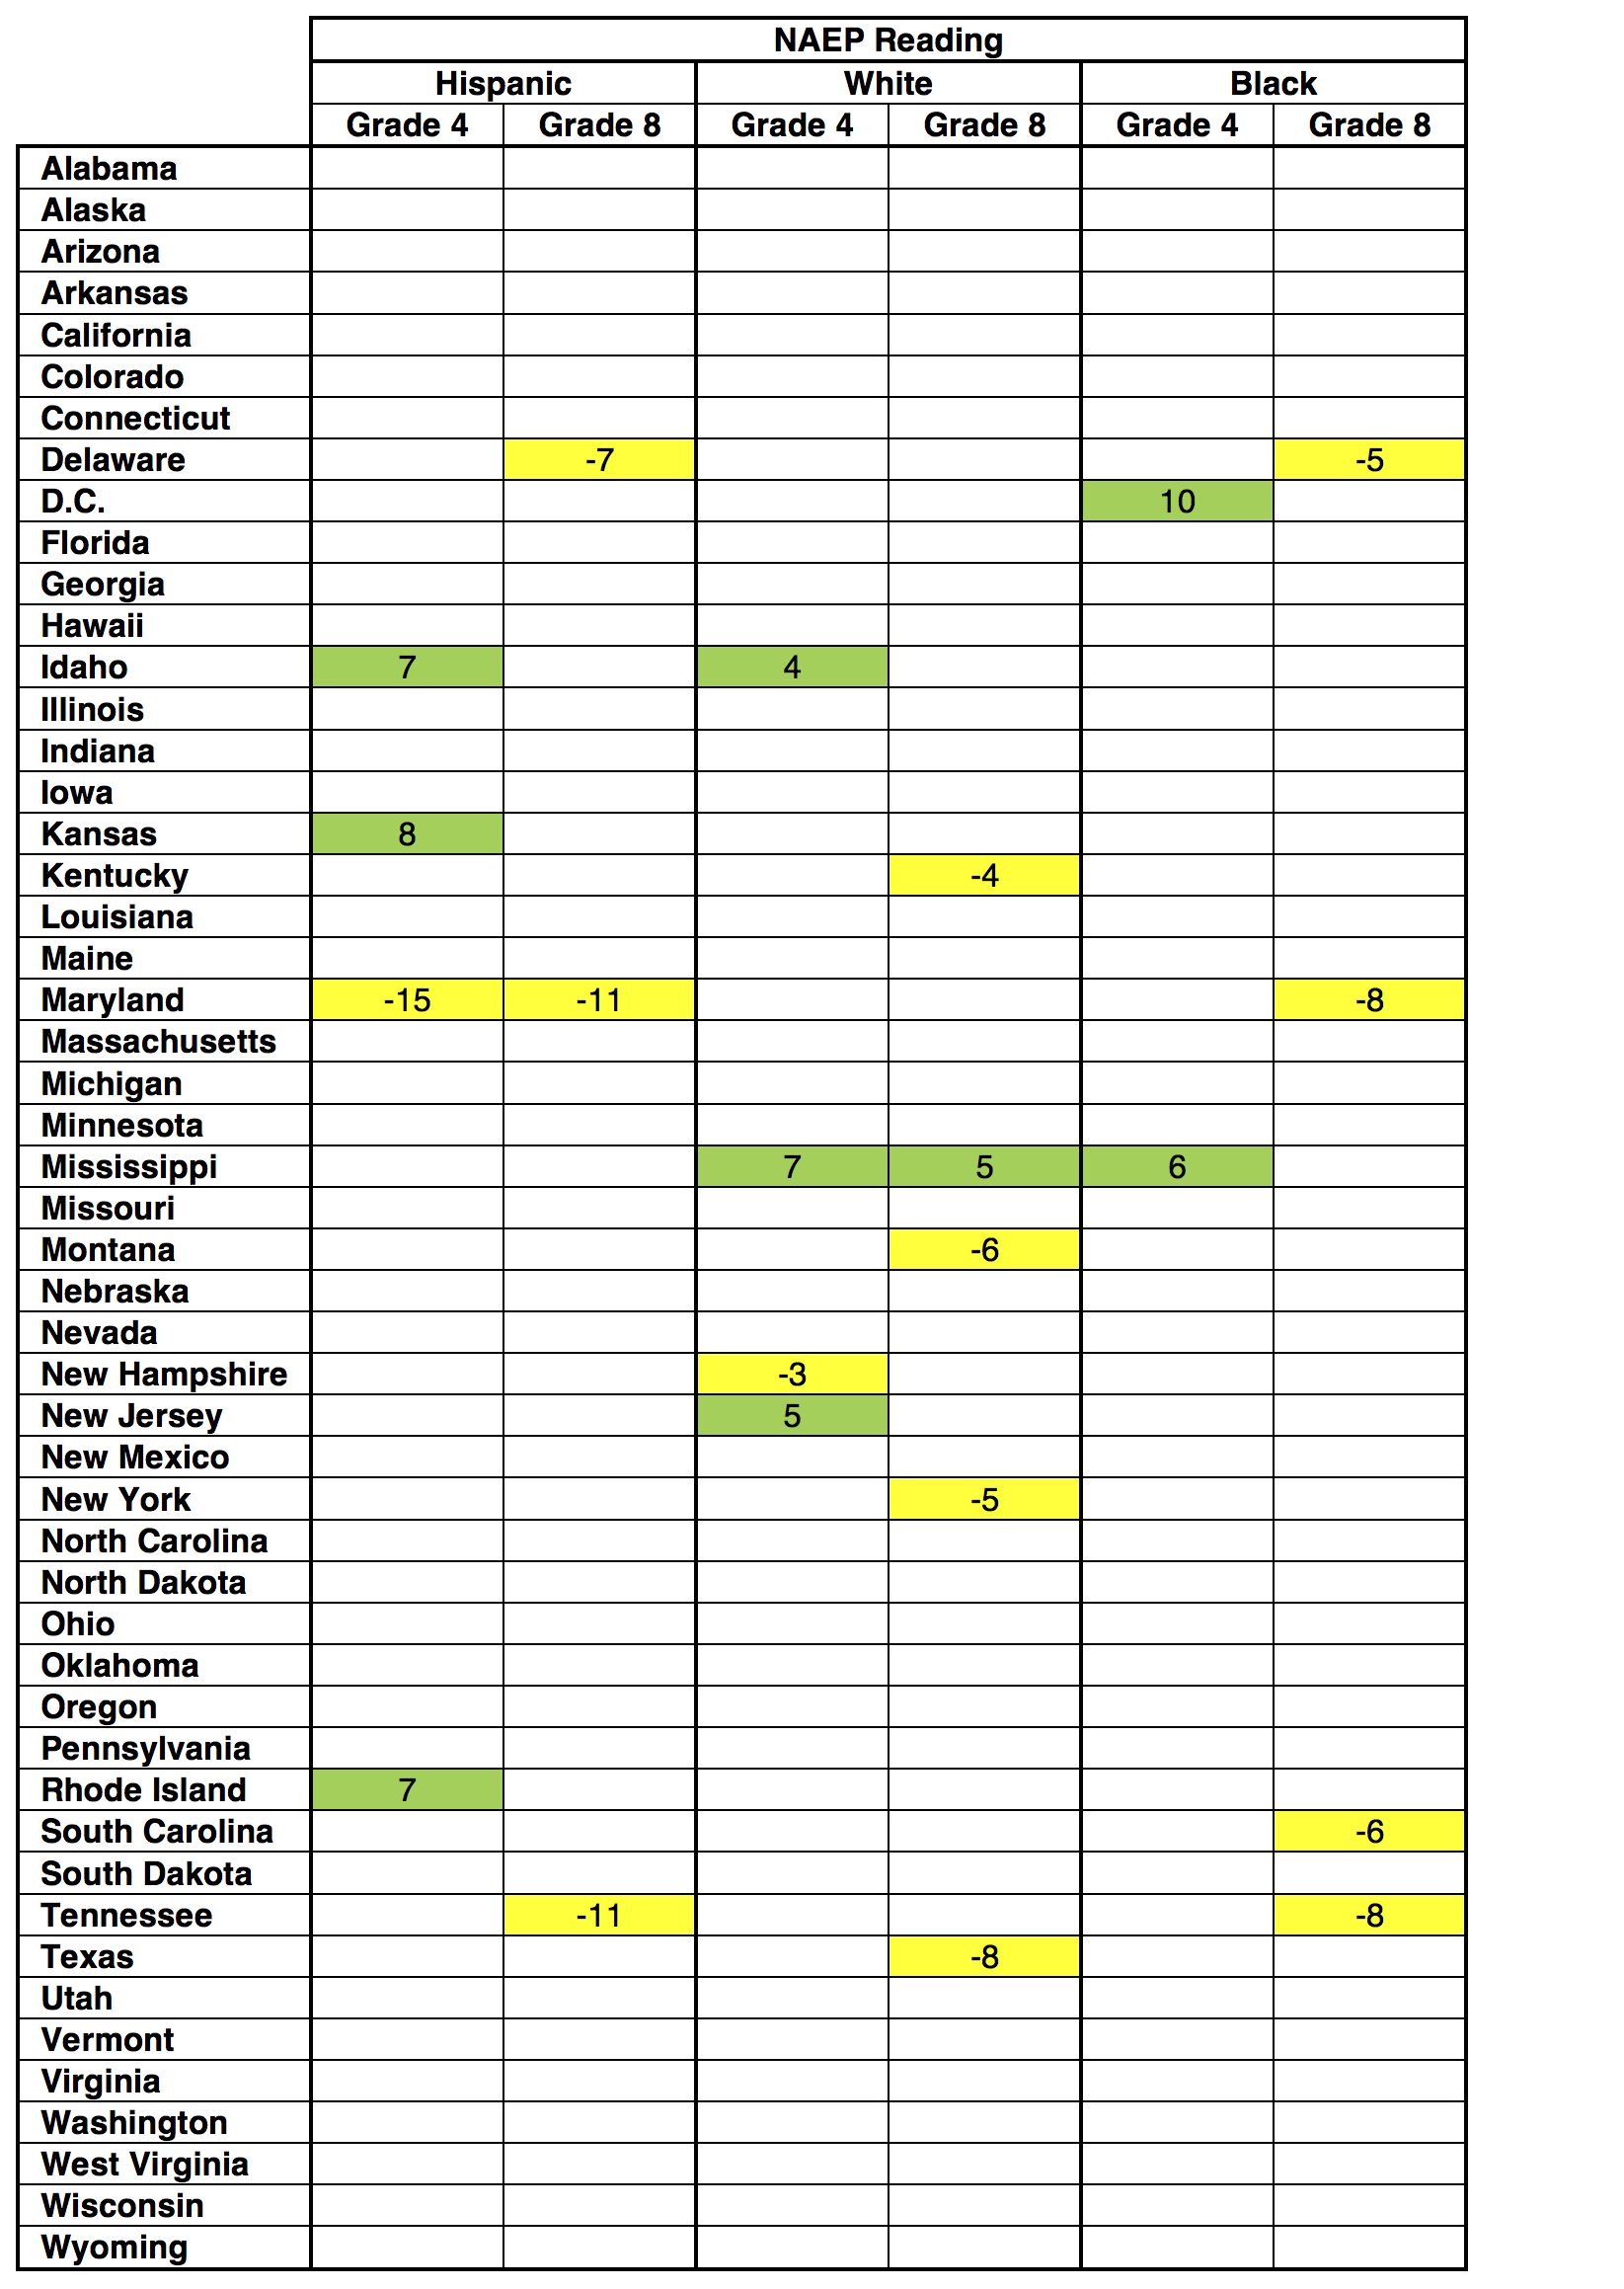
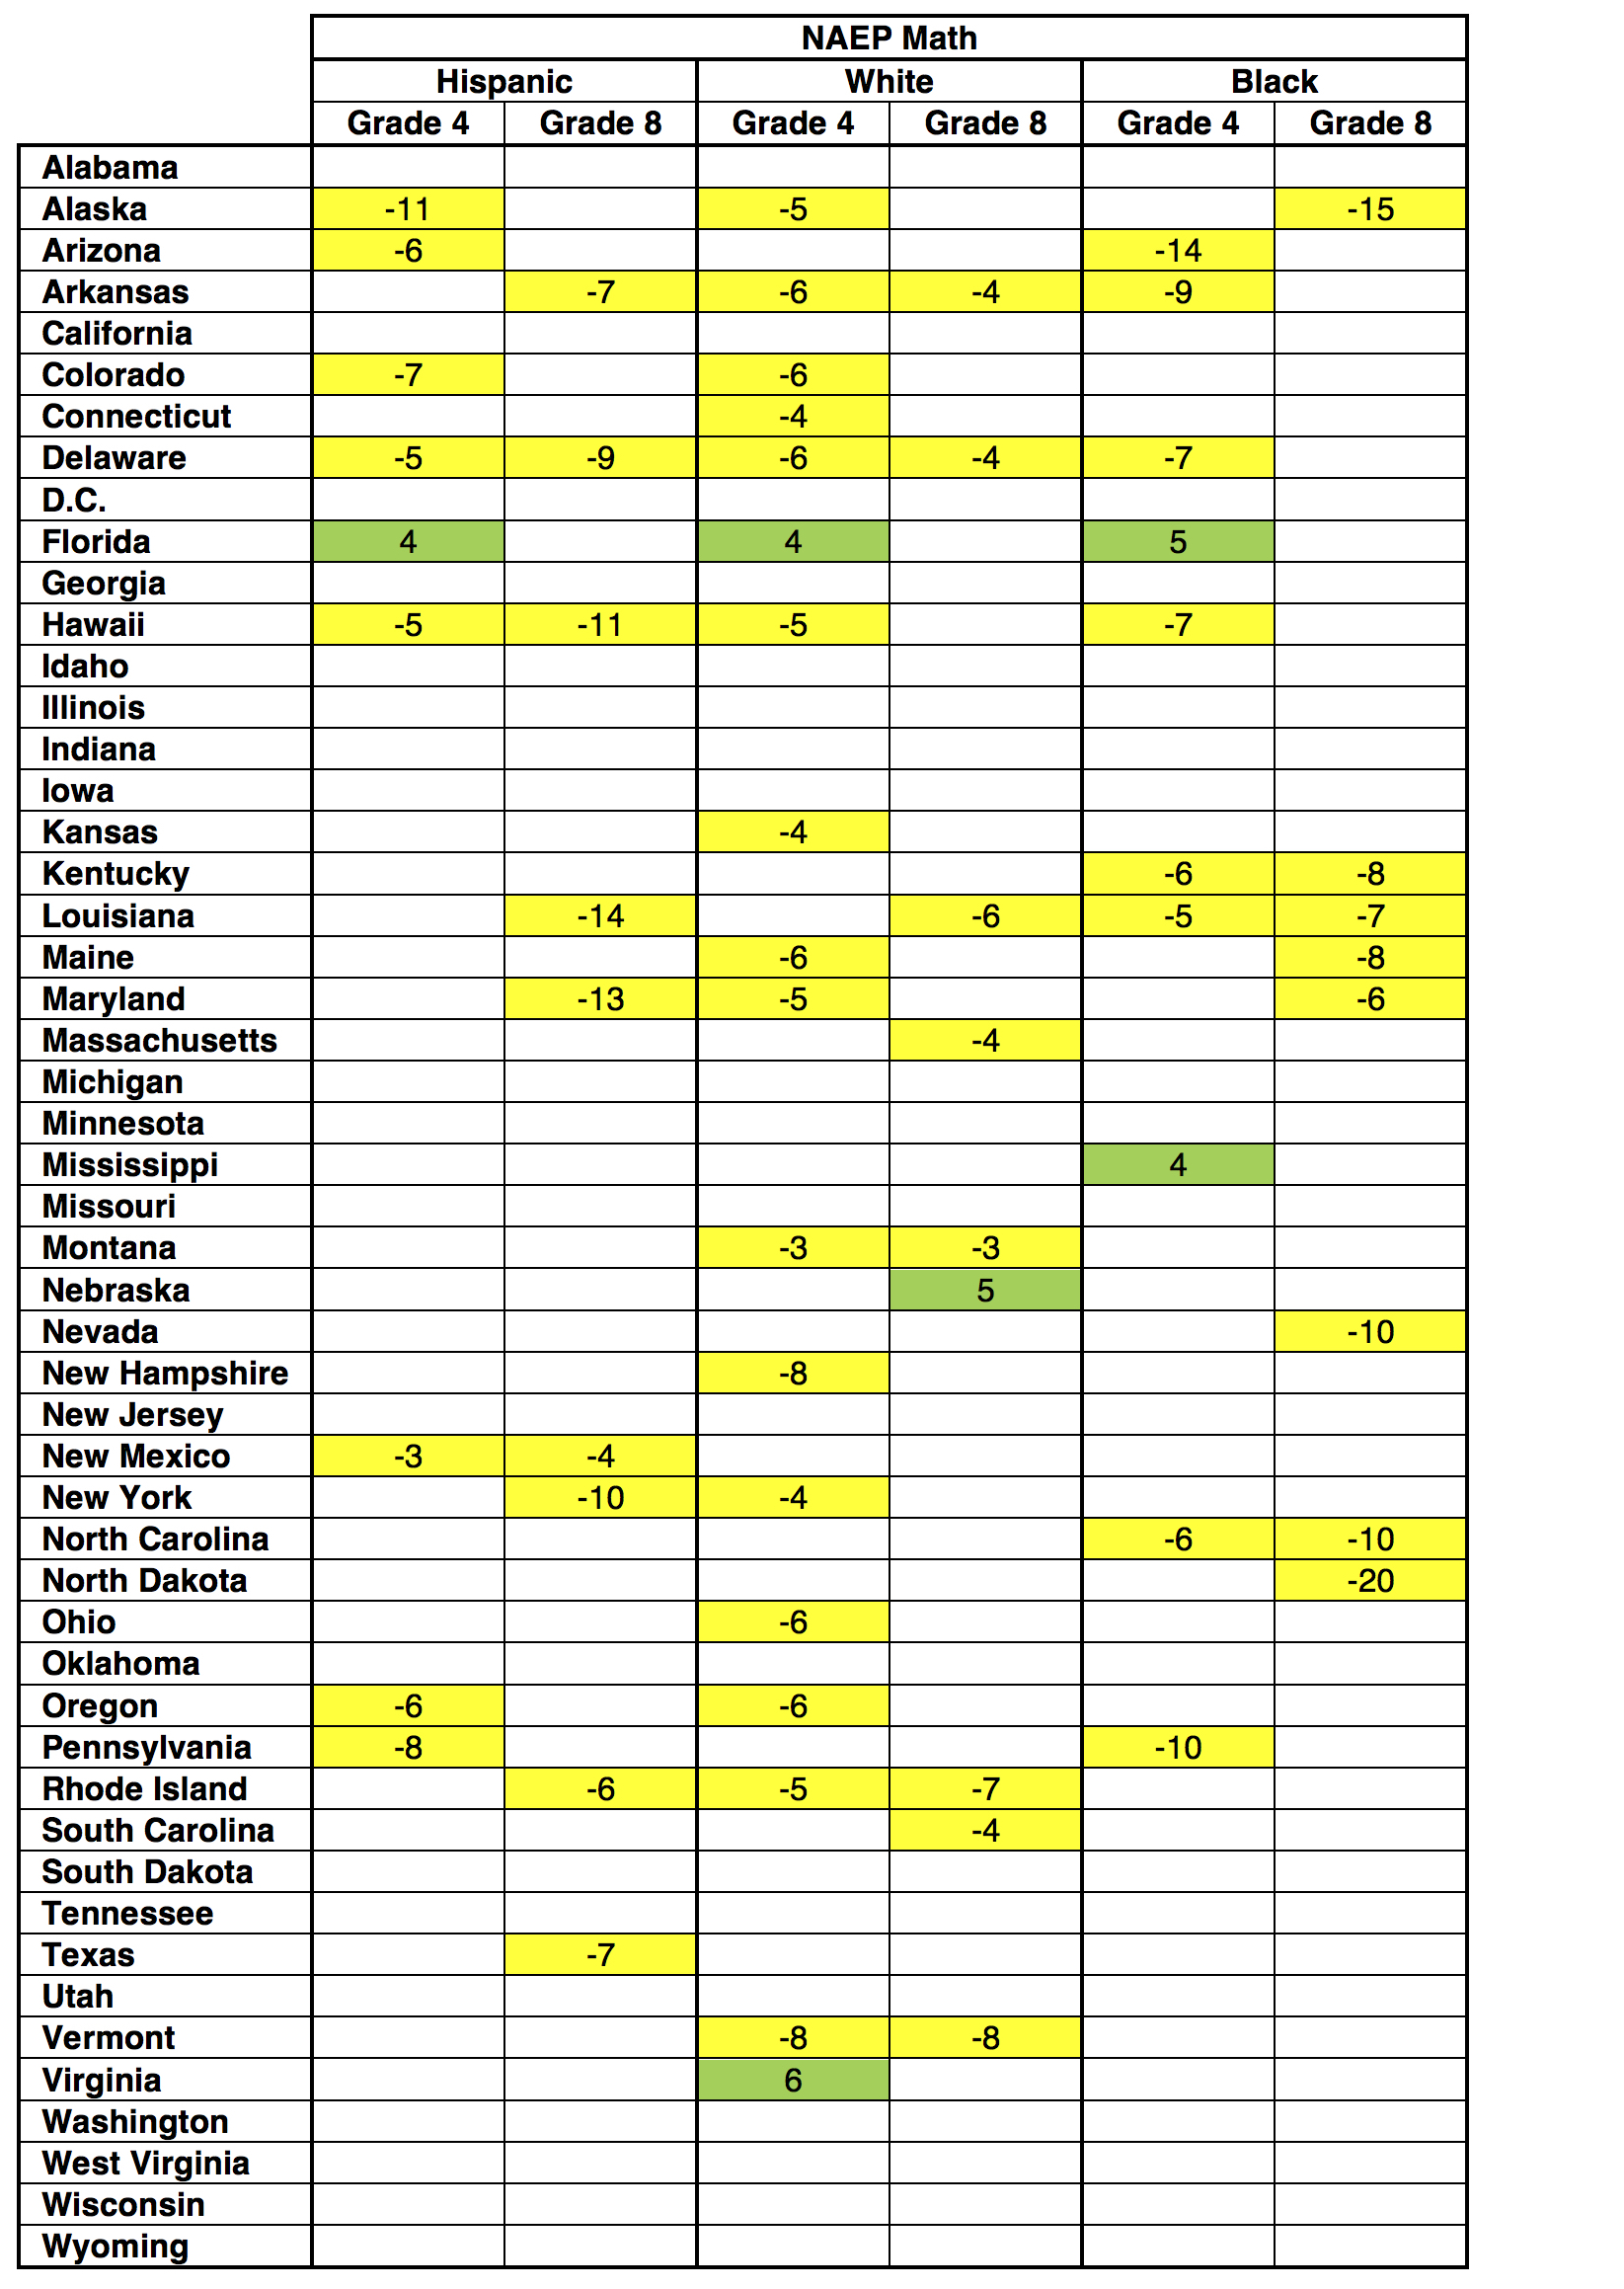
The subgroup results don’t change the basic picture, but there are a few noteworthy items:
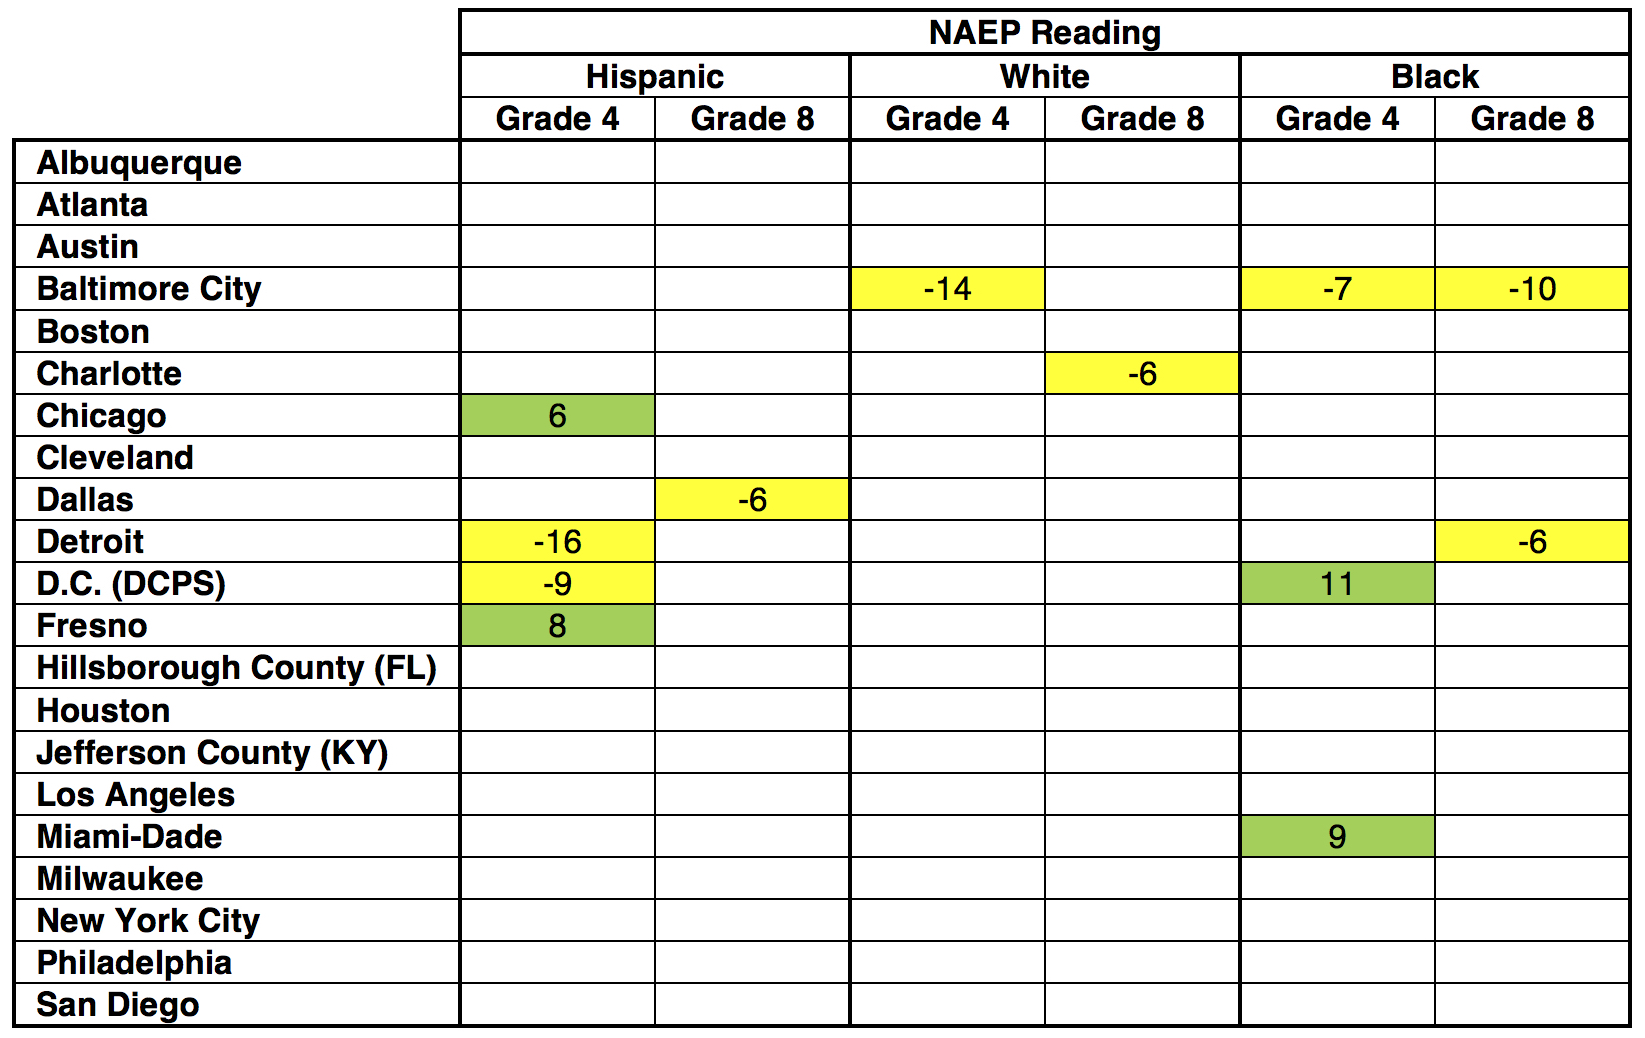
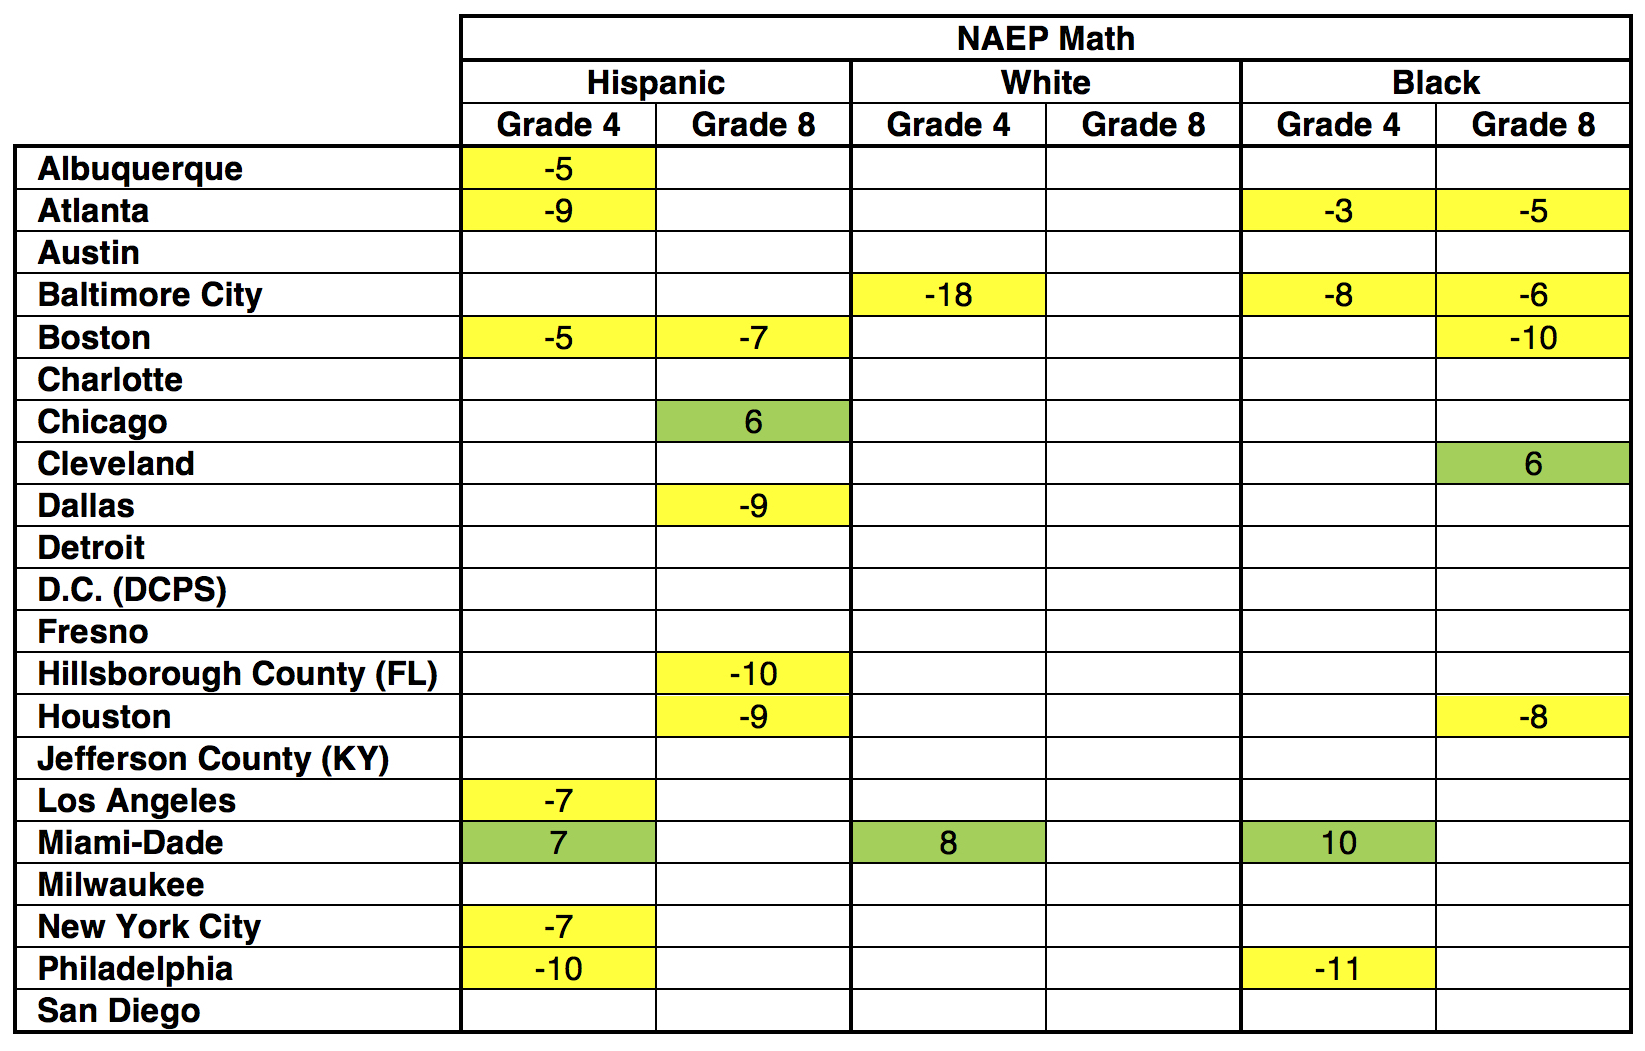
Now let’s turn to the big urban districts that participated in both 2013 and 2017:
Table 4: Statistically significant changes for each participating TUDA district from 2013–17
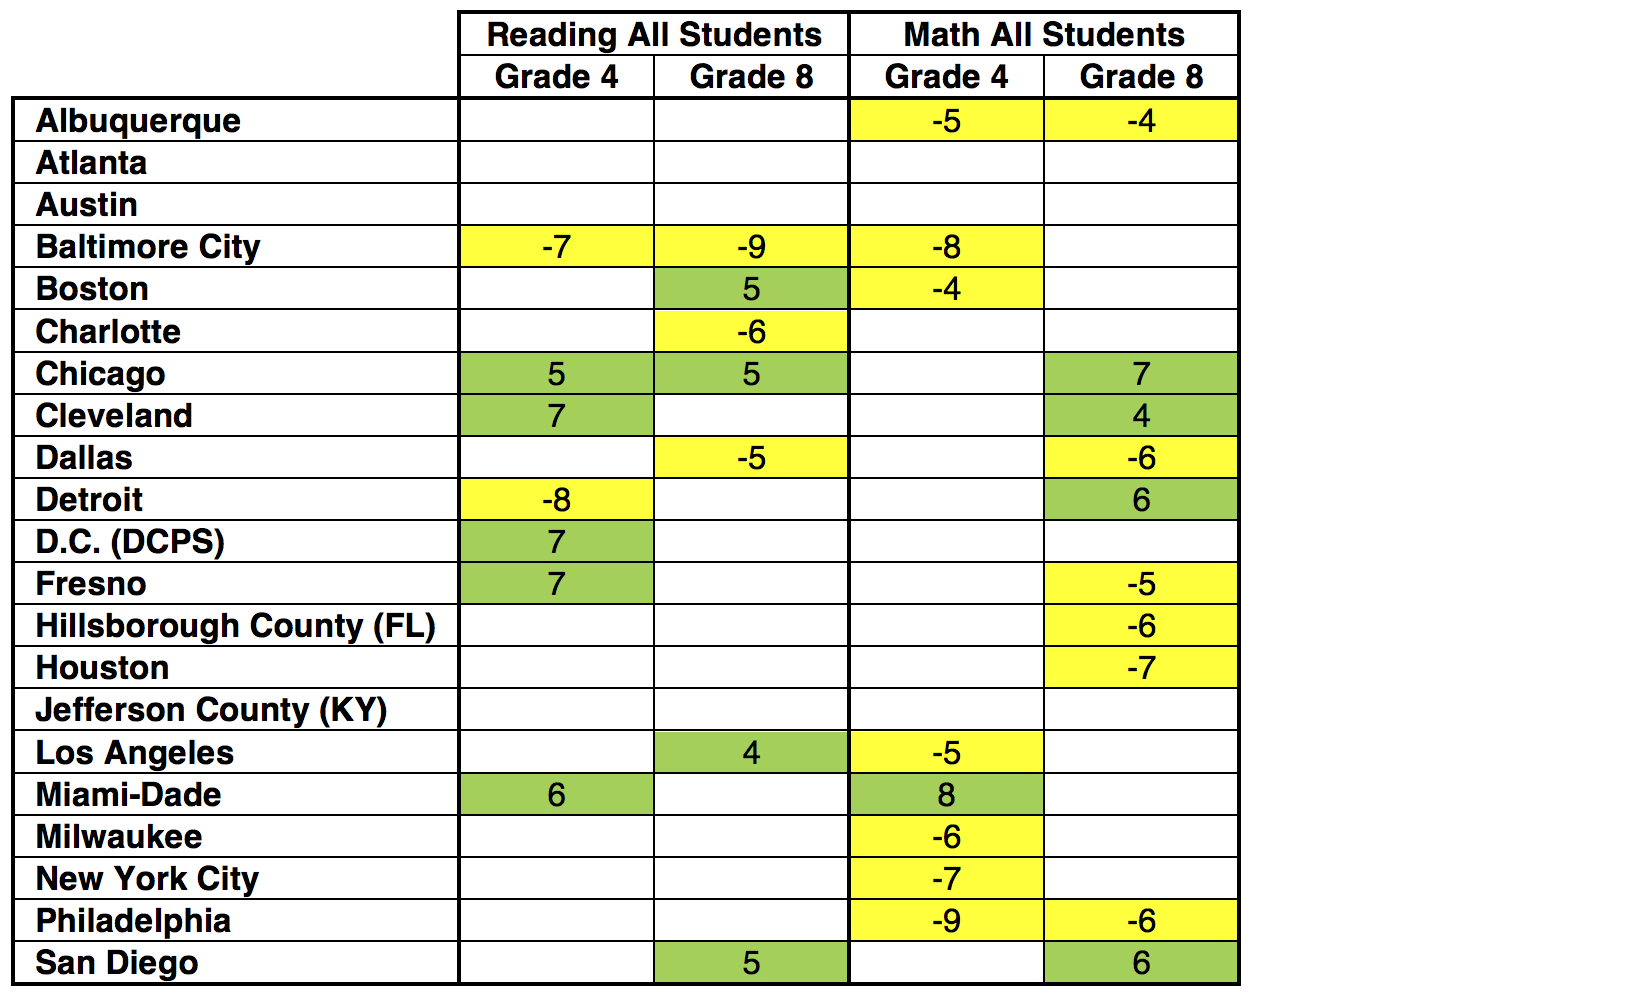
And by subgroups:
Table 5: Statistically significant changes for each participating TUDA district and subgroup from 2013–17
Now back to our story lines.
There is plenty more to unpack. Who lost Boston, for example? What’s the story with Philadelphia? And why isn’t Atlanta so hot? Scholars will be digging into restricted-use data in coming days and weeks; if they find anything, we’ll share it with you here. In the meantime, let’s start discussing the most important question: What can we do so that these flat lines turn into upward slopes again, and before it’s too late for our current generation of students?

The biggest takeaway from the new National Assessment of Education Progress results is a bleak one: Average scores are flat almost everywhere—fourth grade and eighth grade, reading and math, low- and high-income, black, Hispanic, and white. As my colleague Mike Petrilli wrote today in another Flypaper post, “it’s now been almost a decade since we’ve seen strong growth in either reading or math, with the slight exception of eighth grade reading.”
But lost in that disappointing decade of averages is a decade of fairly steady and unexpectedly universal progress for one set of students: high achievers. Not every top scorer benefited to the same degree—and that’s an enduring and substantial problem—but benefit they all did.
NAEP is administered every two years, and scores can fall into three “achievement levels” dubbed Basic, Proficient, and Advanced. The grade- and subject-specific cutoffs are meant to reflect real-life aptitudes. Proficient is defined as “solid academic performance for each grade assessed.” Advanced indicates “superior performance,” and is therefore NAEP’s best proxy for “high-achieving” or “gifted” students.
Table 1 shows how students have fared in fourth and eighth grade over the last decade in reaching the Advanced level in math and reading. It includes results for all pupils, as well as results broken down by race and eligibility for free or reduced price lunch, which is the standard way of relating income to school achievement. An asterisk and yellow background denote a significantly different (p < .05) score from 2017.
Table 1. Percentage of students at/above NAEP Advanced level, by subject, grade, and subgroup, 2007–17

There are two big takeaways—one great, one worrisome.
First, as the data plainly show, more students reached NAEP’s Advanced level in 2017 than in 2007 in both grades, both subjects, and every subgroup. And in every instance, the difference across that decade is statistically significant—sometimes massively so. In eighth grade math, for example, almost one third of Asian students reached the test’s top level in 2017, a 13-percentage-point increase over ten years. This is all rather remarkable. And every parent, teacher, and advocate who helped make this universal progress possible deserves a round of applause.
But once the plaudits subside, much work remains to address the data’s other takeaway: huge and widening gaps among subgroups of high achievers, discrepancies that Johns Hopkins professor Jonathan Plucker rightly calls “excellence gaps.” Yes, black, Hispanic, and low-income students have seen gains, but from a depressingly low base, especially compared to white, Asian, and affluent peers. The 2017 percentage-point difference between white and black students who reach NAEP Advanced, for instance, ranges from 5 points in eighth grade reading to 11 points in eighth grade math. For Asian and black pupils in 2017, it’s between 10 and 28 percentage points. All of these are wider gaps than in 2007. And the refrain is the same for low- and high-income students, between which the Advanced-level gap has also widened in both subjects and grades in the last decade.
The next question is, of course, why. Why have all of these socioeconomic subgroups seen gains at the high-end? And why are the more advantaged groups rising faster? NAEP does not and cannot give us answers. And the first query is a particular mystery. Perhaps it was some combination of better standards, higher quality and more adaptive assessments, stronger accountability, broader choice, and more. No one can be sure.
For the second question—why excellence gaps have worsened—one reason likely has to do with schools’ uneven offerings for high achievers. Indeed, Fordham’s January report, Is There a Gifted Gap?, examined income- and race-based differences in gifted programming and found that students in low-poverty schools are more than twice as likely to participate in gifted programs than their peers at high-poverty schools. And even when black and Hispanic K–8 students attend schools that offer such programs, they participate at much lower rates than white and Asian children.
Such differences might lead to a rising tide that lifts all boats, but favors vessels carrying advantaged students. In Massachusetts, for example, America’s highest-achieving state, white, black, and Hispanic eighth graders reach NAEP Advanced at twice the national rate. But this again masks massive academic inequalities. Although one in every five white students is advanced, that’s true of just one in every twenty-five black and Hispanic students—a gap that is also twice what it is nationally. Meanwhile, a gifted program exists in just one out of every twenty Massachusetts elementary and middle schools, a lower rate than everywhere except Rhode Island and Vermont. And less than half of one percent of the state’s black and Hispanic students participate in such a program.
States, districts, and schools might therefore consider identifying more high achieving students and offering them more opportunities that maximize their education. Doing so could—done well, it should—get more disadvantaged students to NAEP’s top level and help narrow the excellence gap.
For now, however, let’s at least recognize and applaud a remarkable decade of universal progress among America’s high achievers. Be it fourth or eighth grade, math or reading, Asian, black, Hispanic, white, low-income, or high-income students, all reached NAEP Advanced at a greater rate in 2017 than in 2007. Yes, the growth is problematically uneven, and there’s much work to be done to remedy that. No, we’re still not internationally competitive at the high end. But for once we’re at least seeing something that qualifies as good news.

Sad, disappointed, but not yet despairing. These are my emotional reactions to the release today of the 2017 National Assessment of Educational Progress (NAEP) results of fourth and eighth grade reading and mathematics.
Perhaps I should add “relieved.” Given the hostility that replaced comity in the education world and the widespread assault on accountability in the last decade, I suppose it could have been worse.
Yet how are we to handle the simple fact that we made no progress whatsoever in the last eight years? Achievement results on all measures are absolutely flat. The scale score numbers are virtually the same as they were in 2009. Given the progress we had made before and the progress we still need to make, this stagnancy—being stuck in the mud—is inexcusable and unacceptable.
What happened to bring us to this sorry place? There will be as many hypotheses as there are hypothesizers. Here is my take.
Student achievement was flat in the decade that preceded the flowering of accountability. Then we had meaningful achievement growth in the decade in which accountability peaked. And now we see absolute flatness in the eight years during which accountability has been weakened.
The lesson was and still is: Accountability works!
This is not to say that changes weren’t needed to keep accountability fresh, fair, sharp, and effective. Changes were very much in order. But accountability wasn’t fixed; it was largely eviscerated. My point is that, instead of weakening it, we should have repaired it, sustained it, and improved it. I’ll say more about that in a moment.
First, let’s review some relevant history.
The movement to bring accountability to education in America began in earnest in 1993, grew in force through the 1990s, and became so substantial that researcher Eric Hanushek noted that a majority of states had implemented consequential accountability as fundamental policy by 1999. In a major study in the early 2000s, Hanushek and Margaret Raymond showed that consequential accountability had largely worked in the states to improve achievement.
The No Child Left Behind Act (NCLB) became federal law in 2002, expanding and extending accountability throughout the states. Research has shown the positive effects of such accountability. In a major study of studies in 2011, David Figlio and Susanna Loeb concluded that “the preponderance of evidence suggests positive effects of the accountability movement in the United States during the 1990s and early 2000s on student achievement, especially in math.”
In a report that Bill McKenzie and I wrote for the Bush Institute, we showed, among other things, charts of NAEP scores in both math and reading for nine-year-olds. In these charts, one can clearly see flatness before 2000, growth during the 2000s, and flatness toward the beginning of the 2010s. This is true in both subjects. These charts reflect results on the Long Term Trend Assessments before it was suspended, as well as the main NAEP test, in the periods before, during, and after the peak of consequential accountability.
So, where did we go wrong, and what can we do to get right?
Instead of weakening accountability, we should have kept it, fixed it, and made it work better. I’ve warned about mistakes in policy that had the effect of weakening accountability. And I’ve written about how we could have made smarter and better use of accountability.
Whatever the past, it’s not too late to do what should be done. As difficult as it may be, we must at least try to bring back a sense of the comity and mutuality that characterized the early days of standards-based reform.
We can and should be for more spending that is effective and grounded in accountability.
We can and should be for policies that are pro-teacher and grounded in practices that encourage efficiency and effectiveness.
We can be for effective practice that honors standards and testing and promotes better learning results without being foolish or slavish to testing abuse or other educational malpractice.
We can and should entrust significant authority to those closest to the children and insist upon the use of effective, research-based practice.
We can support public education with accountability for results and maximize choice for parents.
I know change will be hard for all parties who are wedded to the status quo and/or would rather fight and die defending their own position. But the problem for them and all of us is that staying stuck is fatal.
We’ve seen, and are paying the price of, stagnation. Our students are not moving forward, which is dangerous for them and for all of us in the complex and challenging world in which we live. And the public is getting wary. Funding is stuck, too, and probably will remain so until we build back broad-based public support for a system that shows the promise of success.
Okay, the choice is there. What will it be?
The views expressed herein represent the opinions of the author and not necessarily the Thomas B. Fordham Institute.

On this week's podcast, Bruno Manno, Senior Advisor to the Walton Family Foundation’s K–12 Education Reform Initiative and a Trustee Emeritus at Fordham, joins Mike Petrilli and Checker Finn to discuss this week’s NAEP results in the context of the thirty-fifth anniversary of A Nation at Risk. On the Research Minute, Amber Northern examines how accountability metrics related to student subgroups affect teacher turnover and attrition.
Matthew Shirrell, “The Effects of Subgroup-Specific Accountability on Teacher Turnover and Attrition,” Education Finance and Policy (Forthcoming).

New York City’s high school choice program can be, depending on your perspective, refreshing or daunting. When it comes time to choose where they want to spend (hopefully) the next four years, every eighth grader in the nation’s largest school system gets a 600-page school directory enumerating over 700 high schools and program options, before submitting an application ranking up to twelve choices. In theory, this kind of education agora should create all manner of opportunities for students to ferret out just the right high school. But low-income, black, and Hispanic residents and those who do not speak English at home have proven more likely to choose and/or be assigned to high schools with lower graduation rates. Could a targeted intervention in the form of simplified information about school options bring order to chaos and enhance “match”? The short answer appears to be “yes” based on an experiment conducted by New York University economics and education policy professor Sean P. Corcoran and his co-authors, Jennifer Jennings of Princeton, Sarah Cohodes of Columbia, and Seton Hall’s Carolyn Sattin-Bajaj.
The four conducted a randomized field experiment in 165 high-poverty New York City middle schools during the 2015–16 school year, in which students in some schools received custom lists of thirty high schools with graduation rates north of 70 percent within a forty-five minute ride on the city’s buses or subways. Students who received the custom lists were more likely to apply to specific high school recommended on the lists than students who did not receive them; and those who received the custom lists were also more likely to receive their first choice high school and less likely to match to a high school with a graduation rate below 70 percent (they had higher odds of admission, and they avoided lower-performing schools on their application).
It’s not a huge surprise that better information leads to more informed and targeted choice. But the authors sound a cautionary note about whether their intervention can reduce inequality. If the assumption is that advantaged students are already near a ceiling of information, so disadvantaged groups have more to gain, then that appears not to be supported by the experiment. “Both disadvantaged and advantaged students used the custom lists to make choices,” the authors note, but in some instances advantaged students “saw greater benefits” by applying and matching to more schools on the researchers’ custom lists.
“Taken together, our findings demonstrate that proving simplified and customized information to middle school students can increase the quality of the schools to which they match. Beyond simply inducing students to apply to higher-performing schools, these supports should help students identify schools where their odds of admission are higher,” the authors conclude. They note several important limitations to their experiment. The “custom lists” of schools were customized at the school level, not the student level. “More personalized information could potentially elicit greater usage and impact,” they say.
SOURCE: Sean P. Corcoran et al., “Leveling the Playing Field for High School Choice: Results from a Field Experiment of Informational Interventions,” National Bureau of Economic Research (March 2018).

An increasing number of headline-grabbing graduation scandals have renewed the public’s interest in how students earn a high school diploma. A recent paper from the Center for American Progress adds to the discussion by examining high school graduation requirements in all fifty states, as well as the District of Columbia and Puerto Rico, to determine whether they are aligned with college admissions requirements and a variety of quality indicators.
To complete their state-by-state comparisons, the authors reviewed the state-level high school coursework needed to earn a standard diploma, as well as the admissions requirements for each state’s public university system.[1] These requirements were divided into two categories: years of study within each subject area and the course type and sequence within each subject.
The authors used Carnegie units to measure the years of study required by both high school graduation and college admissions standards; one Carnegie unit is equivalent to 120 hours of class time. States were placed into one of three categories based on their coursework requirements for math, English, science, social studies, foreign language, fine arts, physical education/health, and electives.[2] In states where both the high school and public university systems required the same number of units in each subject, states were deemed meeting expectations. High school requirements that demanded more coursework units in a subject were labeled as exceeding, while high school requirements that demanded fewer units were labeled as not meeting college expectations.
Forty-four states met expectations in English, and three exceeded them. For math, twenty-nine states met expectations, and eleven exceeded them. California was the only state that failed to meet the expectation in both math and English; meanwhile forty states’ diploma requirements met or exceeded college admissions’ coursework standards in both math and English, including Ohio. The least amount of alignment between high school graduation and college requirements occurred in foreign languages, with twenty-three states failing to meet college expectations; twenty-three others met them.
As for the types of classes required, the authors acknowledge that many students are able to choose the courses they take to fulfill graduation requirements. Nevertheless, the authors were able to determine whether the course type and sequence required by high school graduation standards were aligned with college admissions requirements based on course names. States in which students are required to take the same or more rigorous courses than what is required for college admission are considered to be in alignment.[3]
They found that forty-four states met this standard in both social studies and English. Numbers were smaller in math and science—twenty-three and seventeen states, respectively—but in many additional states, students had the option of choosing high school class sequences that were aligned with college expectations in these subjects.
The authors conducted an additional state-by-state comparison of the quality of graduation requirements based on five criteria: requiring three courses in the same CTE field; addressing the need for a well-rounded education via a life-skills course, like financial literacy; complete coursework alignment between high school graduation and college admissions expectations; and requiring the completion of a fifteen-credit college-ready curriculum. No state satisfied all five, but some met a few. Louisiana and Tennessee, for example, require a fifteen-credit college ready curriculum and have completely aligned their diploma requirements with their state’s public university’s coursework admissions standards. Twenty-three states require some element of a well-rounded education. And one state, Delaware, requires its students to complete three credits in the same career and technical education field.
Overall, the authors find a “significant misalignment” between states’ high school and college systems. They also note that, although their analysis attempted to review the quality of graduation requirements, it did not take into account the content taught in each course. Given the mismatch between rising graduation rates and low proficiency rates on assessments like NAEP, the authors acknowledge that “it is almost a guarantee that America’s schools are graduating students who have not learned as much as they should in high school.”
The paper concludes with a series of recommendations for state policymakers. Unsurprisingly, the first recommendation is to ensure clear alignment between the requirements for high school graduation and college admission. The authors also recommend mandating the completion of the fifteen-credit college-ready coursework that’s required by most public university systems because research shows that students have better life outcomes if they take a rigorous high school course load, regardless of eventual college enrollment.
SOURCE: Laura Jimenez and Scott Sargrad, “Are High School Diplomas Really a Ticket to College and Work? An Audit of State High School Graduation Requirements,” Center for American Progress (April 2018).
[1] The authors selected a single public four-year university located in a major urban center in states with multiple campuses.
[2] Authors excluded four states—Colorado, Maine, Massachusetts, and Pennsylvania—because they require demonstration of mastery in lieu of unit requirements. Thus they compared forty-six states, Puerto Rico, and D.C.
[3] Once again, certain states (Colorado, Maine, Massachusetts, Pennsylvania, and Vermont) were excluded from this comparison because they require demonstration of mastery in lieu of unit requirements, leaving forty-five states, Puerto Rico, and D.C.