“Excellence gaps” are the disparities in advanced academic performance that exist between student groups. These gaps have important implications for both academic equity and American economic competitiveness, as the most lucrative jobs often go to those who perform at the highest levels.
Although considerable work has evaluated how and why these excellence gaps occur, what’s not been examined closely is what excellence gaps look like for students of different races/ethnicities within the same socioeconomic group. This new report uses NAEP data on eighth graders over the last two decades to trace the performance of America’s highest-achieving students by both race/ethnicity and socioeconomic status (SES).
Specifically, Fordham’s research associate Meredith Coffey and national research director Adam Tyner examine:
- The extent to which racial/ethnic excellence gaps can be explained by differences in SES;
- Whether excellence gaps still exist when racial/ethnic groups are compared within the same socioeconomic groups; and
- How excellence gaps by race/ethnicity and SES have shifted over the past two decades, including since the COVID-19 pandemic.
This new analysis reveals five key findings and several implications for education leaders and policymakers who want to increase the numbers of students from all backgrounds whose academic performance rises to the top.
Download the report here or read below.
Foreword
by Michael J. Petrilli and Amber M. Northern
Besides suffocating heat, humidity, and wildfires, the summer of 2023 also brought a seismic shift to higher education: the Supreme Court’s striking down of affirmative action in college admissions.
Putting aside the rancorous debates about the rationale and implications for the decision, at the heart of the Harvard case was the clear evidence that Harvard was discriminating against Asian students.
An incriminating 2022 study about Harvard admissions found a “substantial penalty against Asian American applicants relative to their white counterparts.” Scholars estimated that, given the overall admissions rate for Asian Americans at Harvard was around 5 percent, removing what amounted to a handicap would increase their admissions chances by at least 19 percent.
What’s more, the researchers took on a surprisingly candid tone when noting the differences between the Asian and White applicant pool:
While it is widely understood that Asian American applicants are academically stronger than whites, it is startling just how much stronger they are. During the period we analyze, there were 42 percent more white applicants than Asian American applicants overall. Yet, among those who were in the top 10 percent of applicants based on grades and test scores, Asian American applicants outnumbered white applicants by more than 45 percent.
Startling indeed.
Findings from this new study, Excellence Gaps by Race and Socioeconomic Status, reminded us of this eye-popping imbalance. Authored by Fordham’s Meredith Coffey and Adam Tyner, the report digs into how race and socioeconomic status (SES) interact to shape academic “excellence gaps”—disparities in performance among groups of students achieving at the highest levels.
Their analysis utilizes nearly twenty years of eighth-grade reading and math assessment data (from 2003 to 2022) to document the progress of America’s highest-performing students, meaning those who earned “Advanced” scores on the National Assessment of Educational Progress, a.k.a., “The Nation’s Report Card.” Among other things, it finds that fewer Black and Hispanic students from the highest-SES group (those with college-educated mothers) are achieving at Advanced levels than we would expect given their socioeconomic status. That’s a disparity clearly worth our attention.
But so are their findings on Asian American high achievers—who deserve our attention for a different reason. Two decades ago, Asian American and Pacific Islander students (AAPI) were already crushing it at the Advanced level, and they’ve only made more progress since then (Tables FW-1–2). Part of that progress is due to raising the floor: Coffey and Tyner find that, among students in the lower-SES ranks (those whose mothers have a high school diploma or less), there’s a substantial rise over time in the proportion of AAPI students who are Advanced.
Add it up and we can see that the AAPI advantage has only grown.
Table FW-1. Percentage of students scoring at the Advanced level in math in 2003 and 2022
| 2003 | 2022 | Percent Increase | |
|---|---|---|---|
| AAPI | 13 | 25 | 92% |
| Black | 1 | 1 | 0% |
| Hispanic | 1 | 2 | 100% |
| White | 7 | 9 | 22% |
Table FW-2. Percentage of students scoring at the Advanced level in reading in 2003 and 2022
| 2003 | 2022 | Percent Increase | |
|---|---|---|---|
| AAPI | 5 | 12 | 140% |
| Black | 1 | 1 | 0% |
| Hispanic | 1 | 2 | 100% |
| White | 4 | 5 | 25% |
Now let’s put these numbers into a context that is familiar to admissions officers at highly-selective colleges. If we consider both the percentage of students in each racial subgroup achieving at the Advanced level and their share of the student population, what does the racial composition of students scoring Advanced look like? Here are the pie charts for our top students in 2003 and again in 2022.
Figure FW-1. Racial composition of eighth grade students at the Advanced level in math in 2003 and in 2022
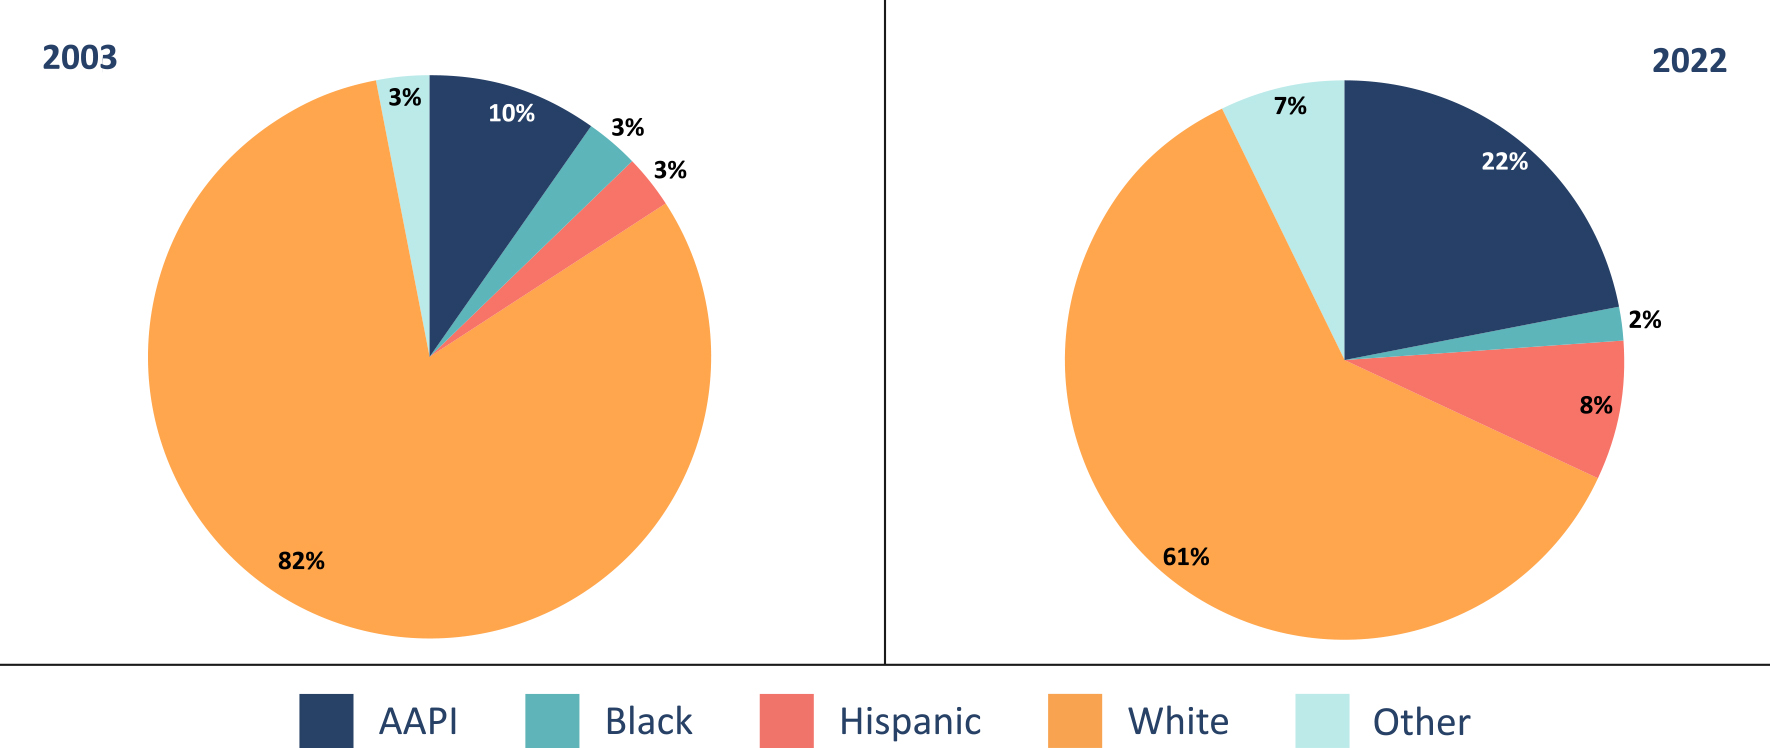
As anyone can plainly see, the proportion of Advanced students who are White dropped significantly, from 82 to 61 percent (Figure FW-1). Yet most of the diversity gains came from Asian students (who went from 10 percent to 22 percent) and, to a lesser degree, Hispanic students (from 3 percent to 8 percent). Unfortunately, the proportion of Advanced students who are Black decreased over that time, from a tragically low 3 to 2 percent.
Now let’s see how it looks for reading in 2003 and then in 2022:
Figure FW-2. Racial composition of eighth grade students at the Advanced level in reading in 2003 and in 2022
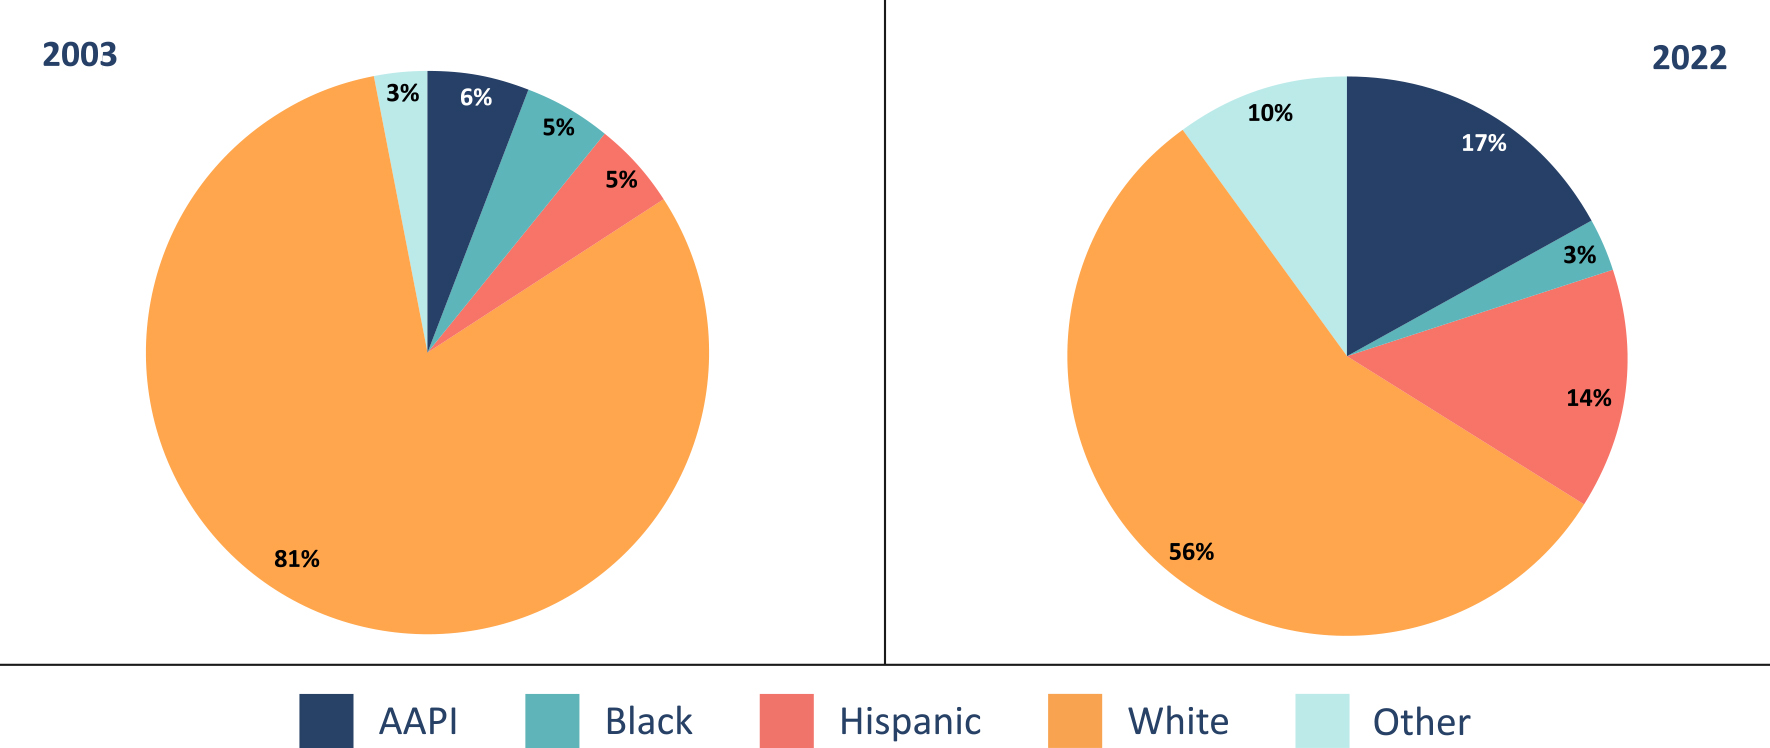
The pattern in Figure FW-2 is largely the same: big declines in the proportion of White students, with large gains for Asian and Hispanic students—once again, more gains for the former than the latter when it comes to reading. The Black proportion is again down, from 5 to 3 percent.
*******
So what can we take from all of this, particularly when it comes to Asian high achievers?
First, they are making solid gains and their success deserves to be recognized.
Second, although our high-achieving students are a more diverse group than twenty years ago, most of this growing diversity is driven by gains by Asian and Hispanic students. For Hispanic students, that largely tracks the growth of their population as a whole, which has nearly doubled over the past two decades. That’s part of the story for Asian students, too (their numbers are up by a third), but it’s also due to their improved performance. Case in point: Our new report finds that Asian students are so high achieving that even those in the lowest-socioeconomic-status group often equal or outperform higher-SES students of other racial and ethnic groups.
Third, we need to learn from the success of AAPI students and their families—not be threatened by it or seek to depress their chances of gaining admission to prestigious institutions. At the national, state, and local levels, policymakers and educators should ask: Are there observable practices among Asian students that could apply more broadly? For instance, are they more likely to participate in extracurricular activities, sign up for more challenging classes, or take part in academic tutoring, clubs, or competitions? Are these behaviors helping AAPI students to reach the highest level of academic achievement? If so, how could smart policies expand those opportunities to students from other communities?
Education reformers spend an inordinate amount of time, energy, and resources (rightly so) on supporting low-performing students. But high performers are often left to fend for themselves. Let’s just say this: It’s not right. We can do better. And we should start doing better today.
Introduction
Piling on to months of alarming findings on learning loss, NWEA reported in July 2023 that progress toward academic recovery continues to lag, despite the return to in-person schooling. Last year’s achievement gains were significantly smaller than typical prepandemic gains, leaving students over four months behind in both reading and math.[1] Exacerbating decades-old achievement gaps, the losses have been largest for Black, Hispanic, and low-income students. In other words, despite renewed national attention to issues of race and equity, American schools are still disproportionately failing their most marginalized students. And the stakes are high: kids in school during the pandemic could end up earning nearly 10 percent less than peers just a few years older,[2] with lifetime earnings reduced by 1.4, 2.4, and 2.1 percent for White, Black, and Hispanic students, respectively. And other generations will suffer, too, with a projected annual GDP loss of as much as $188 billion.[3]
What’s more, learning loss has occurred across the achievement spectrum: the academic performance of even the highest-potential students has either plateaued or declined.[4] And historically underserved student groups are no exception.[5] On the 2022 National Assessment of Educational Progress (NAEP), for example, the number of Black and Hispanic eighth graders achieving Advanced math scores each dropped by half compared to 2019, declining to only 1 percent and 2 percent, respectively.[6] Ensuring that all students—including the highest achieving—have the opportunity to fulfill their academic potential is urgent for both fairness and economic reasons: individuals deserve the opportunity to reach their potential, and American economic competitiveness depends on the cultivation of innovations founded on advanced academic achievement.[7]
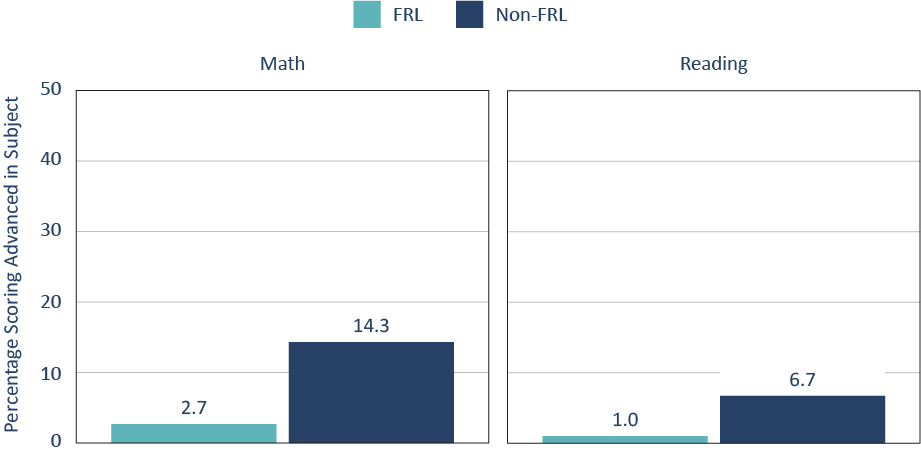
To this end, a growing body of research has called attention to the urgency of combating what Jonathan Plucker, Nathan Burroughs, and Ruiting Song termed “excellence gaps”: disparities in academic performance among groups of students performing at the highest levels.[8] These gaps are evident in comparisons by race/ethnicity (Figure 1) and by socioeconomic status (Figure 2). Studies of excellence gaps have found disparities in advanced performance among students of different genders,[9] students in urban/rural settings,[10] and students with varying immigration histories.[11]
Figure 1. There are pronounced excellence gaps across racial/ethnic groups.
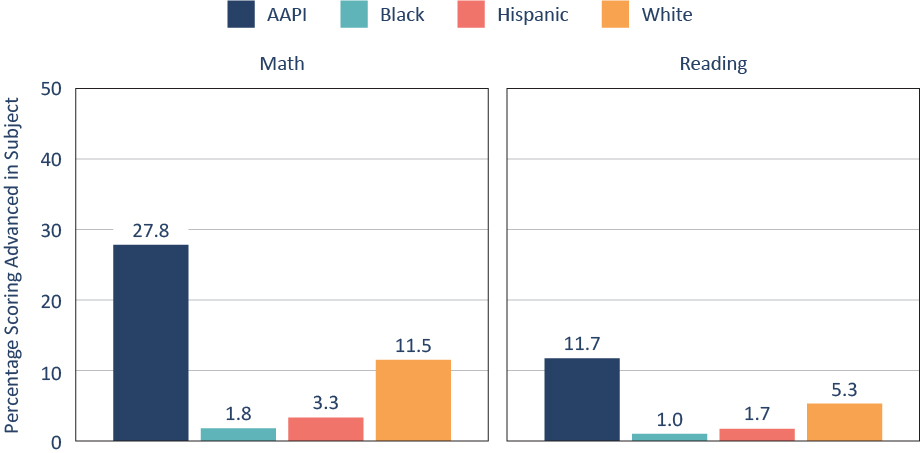
Figure 2. There are pronounced excellence gaps across socioeconomic groups.
To date, much education policy has focused on overall achievement gaps, or average achievement differences between student subgroups. Researchers have increasingly explored not just the impact of individual demographic factors but also how different factors interact with one another to influence student achievement.[12] That is, if White students earn higher average math and reading scores than their Hispanic peers (Figure 3), is that simply because the families of White students are wealthier on average than those of their Hispanic peers? Academic success is, of course, strongly associated with socioeconomic status (SES).[13] Indeed, considerable research suggests that both race and SES—at least as they are typically measured—correlate with achievement gaps. Studies show, for instance, that Black students, on average, underperform their White peers at each socioeconomic level.[14]
Figure 3. Widely documented gaps appear in educational proficiency by race/ethnicity.
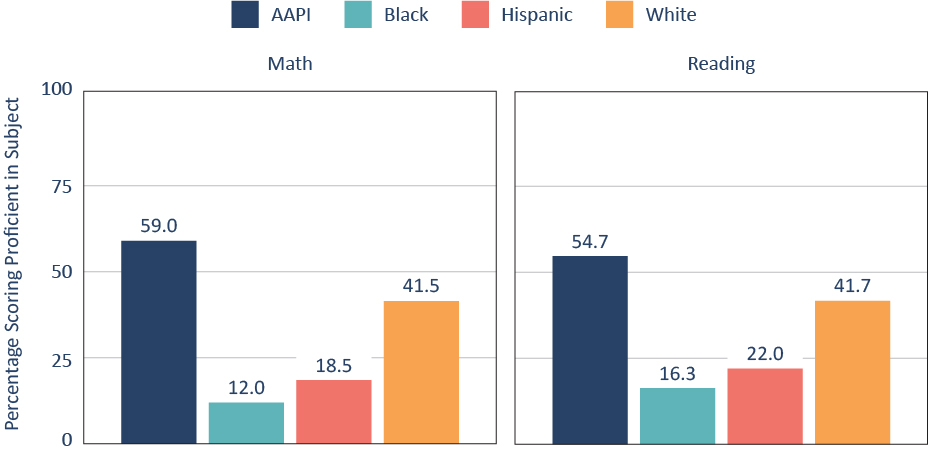
What education research has not yet examined closely, however, is what excellence gaps look like for students of different races/ethnicities within the same socioeconomic group, particularly in the wake of the COVID-19 pandemic.[15] If differences in SES can explain racial disparities at the top end of academic achievement, then the critical action steps are to address economic inequalities and improve schools serving the lowest-income students. But if SES doesn’t fully explain the excellence gap—as it doesn’t for the broader racial achievement gap—then we must investigate why our schools are failing to serve other underrepresented students (e.g., Black and Hispanic students) with the greatest potential.[16] Solving any problem first requires understanding its cause.
This study is the first to focus on the question of how race and SES interact to shape excellence gaps. Using NAEP data on eighth graders over the last two decades, we trace the performance of America’s highest-achieving students by both race/ethnicity and SES.
To illuminate the interaction of race and SES in predicting excellence gaps, this analysis addresses the following questions:
- To what extent can racial/ethnic excellence gaps be explained by differences in SES?
- Are excellence gaps still apparent when racial/ethnic groups are compared within the same socioeconomic groups?
- How have excellence gaps by race/ethnicity and SES shifted over the past two decades, including since the COVID-19 pandemic?
Data and methods
We acquired data on high achievers using the NAEP Data Explorer (NDE). The NAEP is administered by the National Center of Education Statistics (NCES), which is housed within the U.S. Department of Education’s Institute of Education Sciences. Reading and math assessments have typically been administered every two years for eighth-grade students. Other subjects are assessed less frequently.[17] The next most frequently tested subject is science, in which eighth graders are assessed about every four years.[18]
We use publicly available, national NAEP reading and math assessment data from 2003 to 2022 (Table 1), as well as science data from 2009 to 2019 (the latter is in the Appendix). With tests and student surveys typically covering more than 100,000 eighth-grade students during each administration year,[19] the NAEP provides a large-scale, representative picture of how American students are performing across time and in various subjects.[20] The high quality of the NAEP reading, math, and science assessments are part of what make the NAEP the “Nation’s Report Card.”
Table 1. Math and reading are assessed regularly by the NAEP (eighth grade).
| Year | Math | Reading | Science |
|---|---|---|---|
| 2003 | ✓ | ✓ | |
| 2004 | |||
| 2005 | ✓ | ✓ | |
| 2006 | |||
| 2007 | ✓ | ✓ | |
| 2008 | |||
| 2009 | ✓ | ✓ | ✓ |
| 2010 | |||
| 2011 | ✓ | ✓ | ✓ |
| 2012 | |||
| 2013 | ✓ | ✓ | |
| 2014 | |||
| 2015 | ✓✓ | ✓✓ | ✓✓ |
| 2016 | |||
| 2017 | ✓✓ | ✓✓ | |
| 2018 | |||
| 2019 | ✓✓ | ✓✓ | ✓✓ |
| 2020 | |||
| 2021 | |||
| 2022 | ✓✓ | ✓✓ |
Our analysis examines eighth-grade results, which provide the most useful data for our purposes. Fourth graders also take the NAEP at the same intervals, but their surveys provide less socioeconomic data because NCES has found their responses on questions like mother’s education to be unreliable.[21] Twelfth graders, the other age group that participates in the NAEP, take the assessments less frequently and may supply less indicative results due to potential lack of academic engagement at the end of high school.[22]
Identifying race and socioeconomic status
Our analysis focuses on excellence gaps among the four largest racial/ethnic groups: Asian American and Pacific Islander (AAPI) students, Black students, Hispanic students, and White students.[23] We focus on mother’s education as a proxy for SES,[24] although some results by self-reported number of books in the home[25] and whether the students qualify for free or reduced-price lunch (FRL)[26] are also included for context in the Appendix (the results are similar regardless of the SES variable used).
Mother’s education is measured by a question on the NAEP questionnaire in which test-takers select from the following options: “She did not finish high school,” “She graduated from high school,” “She had some education after high school,” “She graduated from college,” or “I don’t know”[27] (the final group is excluded from the analyses).
Note that the available proxies for SES are not comprehensive and, in NDE, cannot be used in conjunction with each other (while including race/ethnicity as well). Not only do both variables rely on student knowledge or estimation, but what the term “socioeconomic status” encompasses is contested and may include family financial resources, family structure, and other factors for which data are unavailable. Moreover, there is race- and ethnicity-specific variability in the SES distributions even within SES categories. For example, among households where the mother has completed college (our highest-SES group), other socioeconomic differences, such as differences in income or family structure, likely remain.[28] Although this is the first study to focus on the intersection of race/ethnicity and SES as those factors correlate with excellence gaps, if more nuanced data were available, our results could be somewhat different. For example, it is possible that a more comprehensive picture of SES would have more predictive power and diminish the separate predictive power of race/ethnicity, as has been shown in some other studies.[29]
Identifying advanced achievement
To identify the highest-performing students, we evaluate the proportion of students who earned “Advanced” scores on the NAEP. This is the highest achievement level and indicates that a student has demonstrated full competency in the subject via “superior performance.” For example, for an eighth grader to earn the Advanced designation in math, she must demonstrate high-level skills, such as analyzing whether a certain data visualization will be helpful for solving a given problem.[30] In reading, Advanced skills include, for example, the ability to synthesize textual evidence from multiple sources in order to support a claim.[31]
Using data from NDE covering all eighth-grade students for each subject and year, we created crosstabs with our race variable and each of our SES variables, including data on the percentage of students in each racial/socioeconomic group who earned Advanced scores (for example, the percentage of Advanced-scoring White students whose mothers did not complete high school).[32] It should be noted that NDE cannot conduct statistical significance tests for the pooled samples and trends over time used in this report. Fortunately, the large size of the NAEP samples makes identifying statistical significance trivial in most cases; if there is a substantive difference between groups, that difference is very likely to be statistically significant.
Results I: The intersection of race and SES in excellence gaps
In this section, we examine the most recent NAEP data collections in order to evaluate how the intersection of socioeconomic and racial/ethnic categories relates to excellence gaps.
Finding 1: Even within SES groups, racial/ethnic excellence gaps persist.
As shown in Figure 4, differences in rates of Advanced achievement remain when students are disaggregated into SES groups. Specifically, AAPI students achieve Advanced at the highest rate, followed by White students, then Hispanic students, and then Black students, who are sometimes tied with Hispanic students.
Figure 4. Excellence gaps by race/ethnicity persist within student socioeconomic groups.
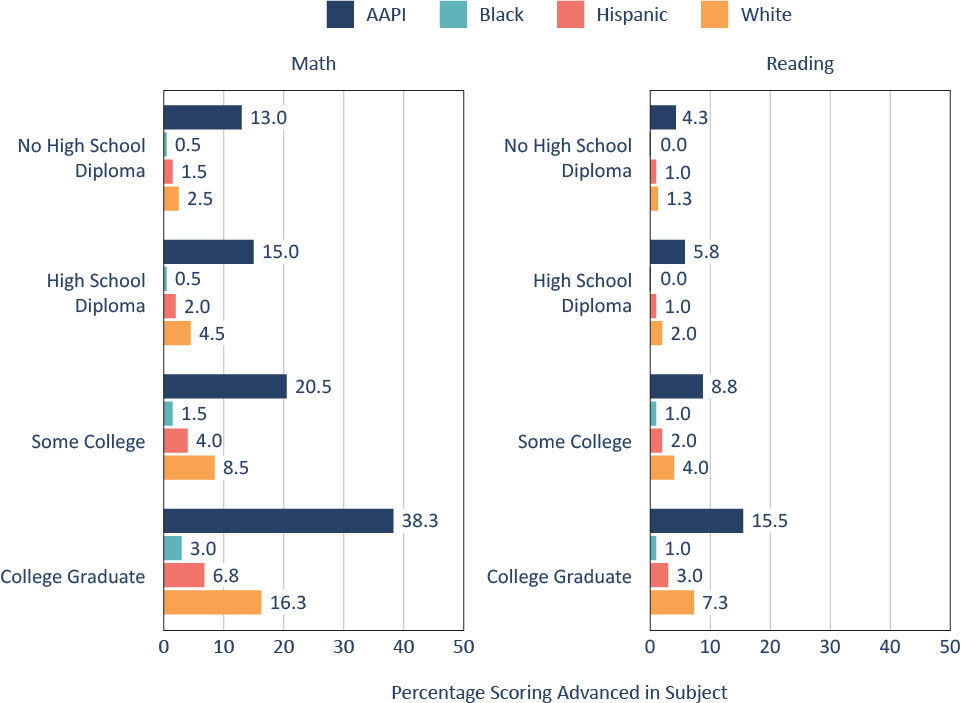
At the same time, within each racial/ethnic group, students of the highest SES achieve Advanced at the highest rate, with a consistent decrease in the share of students achieving at the Advanced level as SES decreases.
Yet there is also some overlap among the racial/ethnic groups of higher and lower SES. For example, in math, the highest-SES Black students are more likely to achieve at the Advanced level than one of the groups of White students and two of the groups of Hispanic students. Specifically, 3.0 percent of the highest-SES Black students achieve at the Advanced level, outperforming White students whose mothers did not finish high school (2.5 percent), Hispanic students whose mothers finished high school (2.0 percent), and Hispanic students whose mothers did not finish high school (1.5 percent).
Similarly, in reading, although White students are more likely to achieve at the Advanced level than their Hispanic counterparts within each SES category, the highest-SES Hispanic students are more likely to achieve at the Advanced level (3.0 percent) than the two lower-SES groups of White students, whose Advanced achievement rates were 2.0 percent and 1.3 percent.
AAPI students, however, are so high achieving that even those in the lowest SES group often equal or outperform higher-SES students of other racial/ethnic groups. In math, 13.0 percent of the lowest-SES AAPI students reach the Advanced level, a figure surpassed only by the highest-SES White students (and other groups of AAPI students). The same pattern holds in reading.
We present these same data in descending order by Advanced rates in table form below.
Table 2. Table presentation of Figure 4.
| Student Groups | % Advanced Rate (Math) | Student Groups | % Advanced Rate (Reading) | ||
|---|---|---|---|---|---|
| College Graduate | AAPI | 38.3 | College Graduate | AAPI | 15.5 |
| Some College | AAPI | 20.5 | Some College | AAPI | 8.8 |
| College Graduate | White | 16.3 | College Graduate | White | 7.3 |
| High School Diploma | AAPI | 15.0 | High School Diploma | AAPI | 5.8 |
| No High School Diploma | AAPI | 13.0 | No High School Diploma | AAPI | 4.3 |
| Some College | White | 8.5 | Some College | White | 4.0 |
| College Graduate | Hispanic | 6.8 | College Graduate | Hispanic | 3.0 |
| Some College | Hispanic | 4.5 | High School Diploma | White | 2.0 |
| High School Diploma | White | 4.0 | Some College | Hispanic | 2.0 |
| College Graduate | Black | 3.0 | College Graduate | Black | 1.3 |
| No High School Diploma | White | 3.0 | No High School Diploma | White | 1.0 |
| High School Diploma | Hispanic | 2.5 | High School Diploma | Hispanic | 1.0 |
| No High School Diploma | Hispanic | 2.0 | Some College | Black | 1.0 |
| Some College | Black | 1.5 | No High School Diploma | Hispanic | 1.0 |
| High School Diploma | Black | 0.5 | High School Diploma | Black | 0.0 |
| No High School Diploma | Black | 0.5 | No High School Diploma | Black | 0.0 |
As indicated, we use mother’s education as our primary measure of SES. But the SES and racial/ethnic patterns of Advanced achievement on eighth-grade math and reading NAEP assessments are similar when either FRL (Appendix, Figure A.1) or self-reported number of books in the home is used instead (Appendix, Figure A.2). Science has much lower levels of Advanced achievement, meaning that some racial/ethnic groups do not reach 1 percent Advanced achievement, regardless of SES (Appendix, Figure A.3).
Finding 2: Racial/ethnic excellence gaps are larger among higher-SES students than lower-SES students.
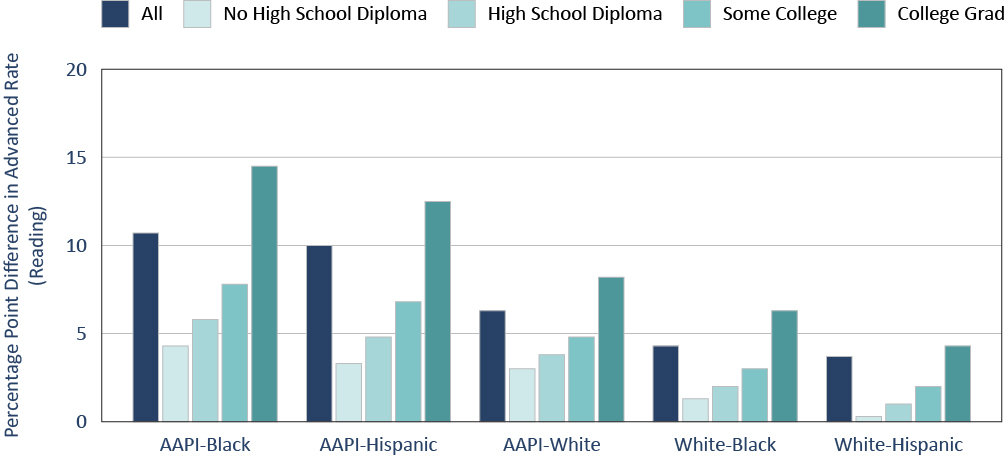
Another way of examining the intersection of race and SES in producing excellence gaps is to see how racial/ethnic excellence gaps vary by SES. Consider Figure 5, which shows the reading excellence gaps in percentage-point differences between groups overall (“all”) and within SES groups. If racial/ethnic gaps were driven by SES, we would expect the gaps to be much smaller—or even nonexistent—within SES groups. But in fact, excellence gaps are not necessarily smaller within SES groups. Indeed, within the highest-SES group (college-educated mothers), excellence gaps are always larger than the overall gap between racial/ethnic groups. On the other hand, for the two lowest SES groups, the White-Black and White-Hispanic excellence gaps are small, ranging from 0.3 to 2.0 percentage points.
For example, Figure 5 shows that the overall AAPI-Black excellence gap in reading is 10.7 percentage points. Yet the gap between AAPI and Black students whose mothers graduated from college is even larger (14.5 percentage points). Likewise for the White-Hispanic excellence gap: the gap for students in the highest SES group (4.3 percentage points) is larger than the overall 3.7 percentage point gap. In contrast, for students whose mothers have a high school diploma or less, the White-Hispanic excellence gap is at most 1.0 percentage point. The generally low rates of Advanced achievement for lower-SES students helps explain why excellence gaps are relatively small for lower-SES students and much larger for high-SES students.
Figure 5. Reading excellence gaps are largest for students in the highest socioeconomic group.
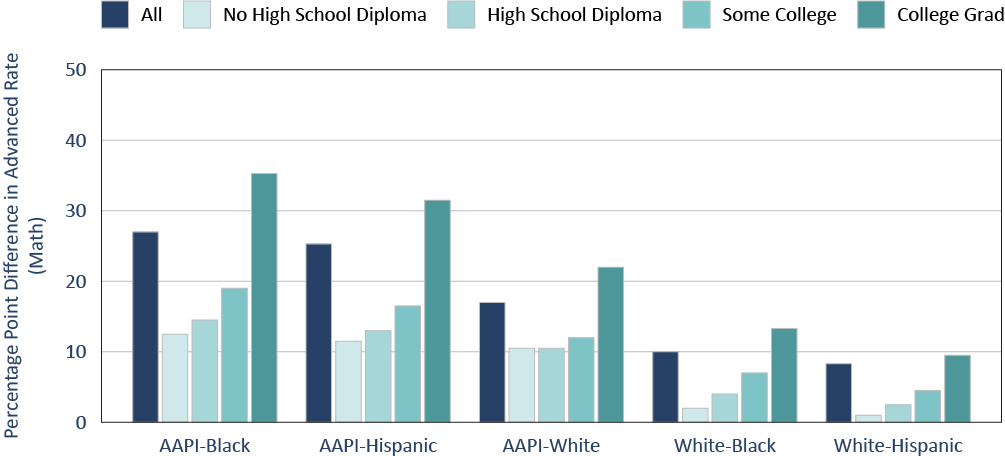
In math (Figure 6), we see a very similar pattern: racial/ethnic excellence gaps are largest within the highest-SES group and are larger than the overall racial/ethnic gaps in Advanced achievement.[33] As with reading, racial/ethnic excellence gaps diminish within SES groups, and for the lowest-SES group (those students whose mothers do not have high school diplomas), the White-Hispanic and White-Black excellence gaps are minimal—1.0 to 2.0 percentage points, respectively (all of these patterns are similar when using self-reported number of books in the home to operationalize SES; see Figure A.4 and A.5 in the Appendix).
Figure 6. Math excellence gaps are largest for the highest-SES students.
Finding 3: SES has a similar effect on all racial/ethnic groups.
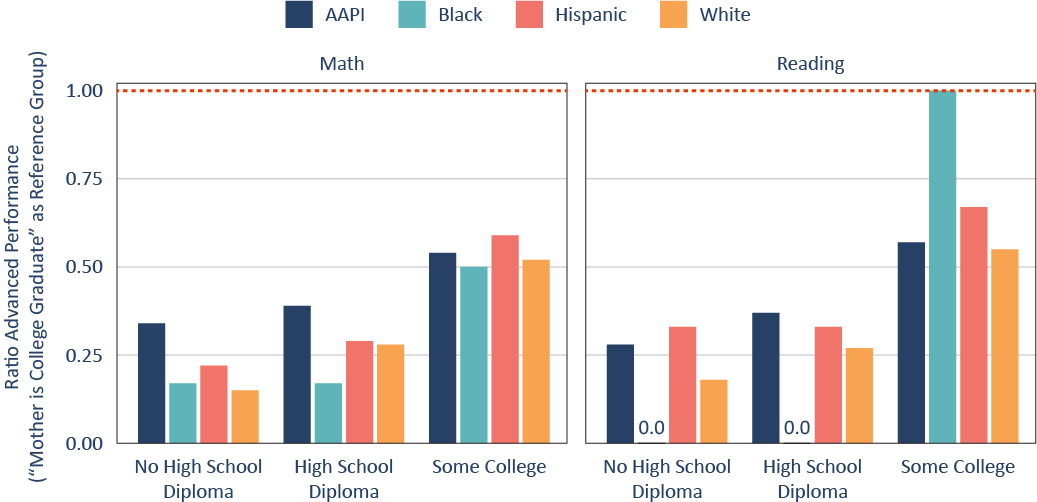
When evaluating the intersection between racial/ethnic identification and SES, it is helpful to consider the extent to which SES moderates racial/ethnic excellence gaps. Figure 7 uses the highest-SES group (students whose mothers are college graduates) as the reference group and shows how the bottom three SES groups compare to the top SES group in terms of Advanced achievement rates. Calculated separately for each racial/ethnic group, each bar shows the percentage of students in that SES group divided by the percentage in the high-SES group, such that if the rates of Advanced achievement were equal, the value would be one.
Figure 7 shows that the effect of SES on Advanced achievement is similar across groups. For math, the values for students with mothers who attained “some college” are all between 0.5 and 0.6, meaning that a little more than half of those students achieved at the Advanced level compared to students in the highest-SES group. For the lower-SES groups, SES has a similarly consistent effect, with the exception of lower-SES AAPI students—who, as indicated earlier, outperform other racial/ethnic groups. Although the effect of SES on Advanced reading achievement appears to be erratic for Black students, that is likely a rounding issue based on the fact that just 1 percent of the highest-SES Black students achieved at that level in all four years of NAEP data analyzed (these patterns are similar when using self-reported number of books in the home to operationalize SES; see Figure A.6 in the Appendix).
Figure 7. The effect of SES on Advanced achievement is generally consistent across racial/ethnic groups.
Results II: Excellence gaps by race and SES over time
The patterns in excellence gaps described above appear in most of the recent years of NAEP data (2015 to 2022). In this section, we examine trends in these data over the past two decades, once again using the highest level of education attained by the student’s mother as the SES variable (additional results may be found in the Appendix).
Finding 4: The last two decades have generally seen rising Advanced achievement for all racial/ethnic and SES groups but particularly for AAPI students.
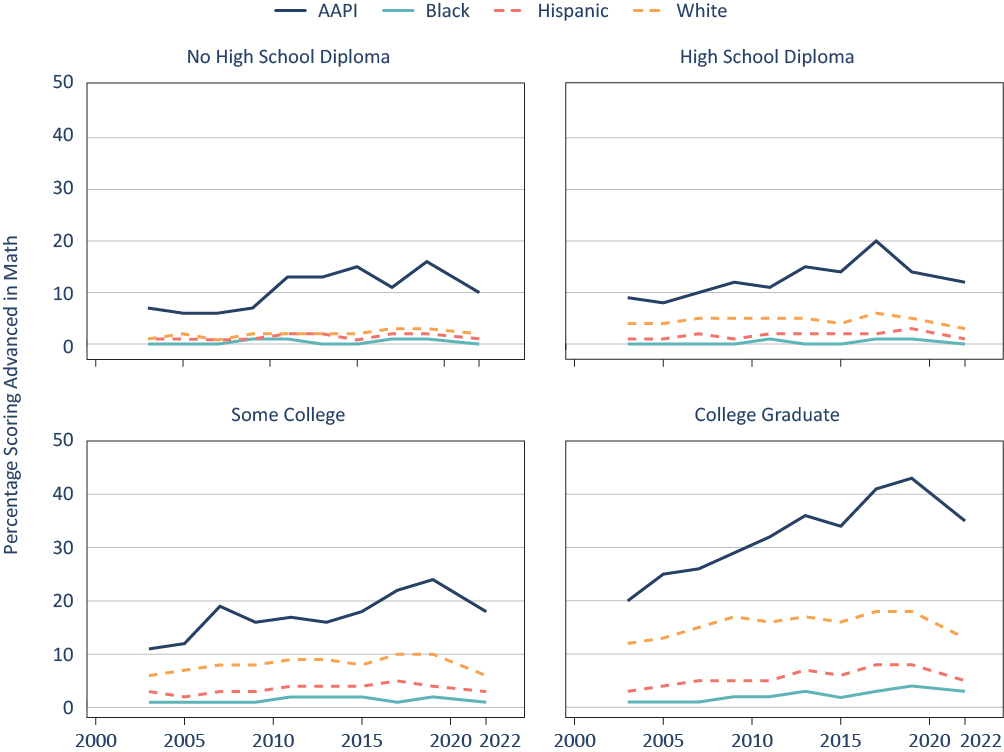
For all but the lowest-SES Hispanic and Black students, Advanced achievement is appreciably higher in the most recent data collections than in the early 2000s, the earliest years of this study. This pattern holds for both reading (Figure 8) and math (Figure 9).
Figure 8. Over the past two decades, reading excellence gaps by race/ethnicity within socioeconomic groups have endured.
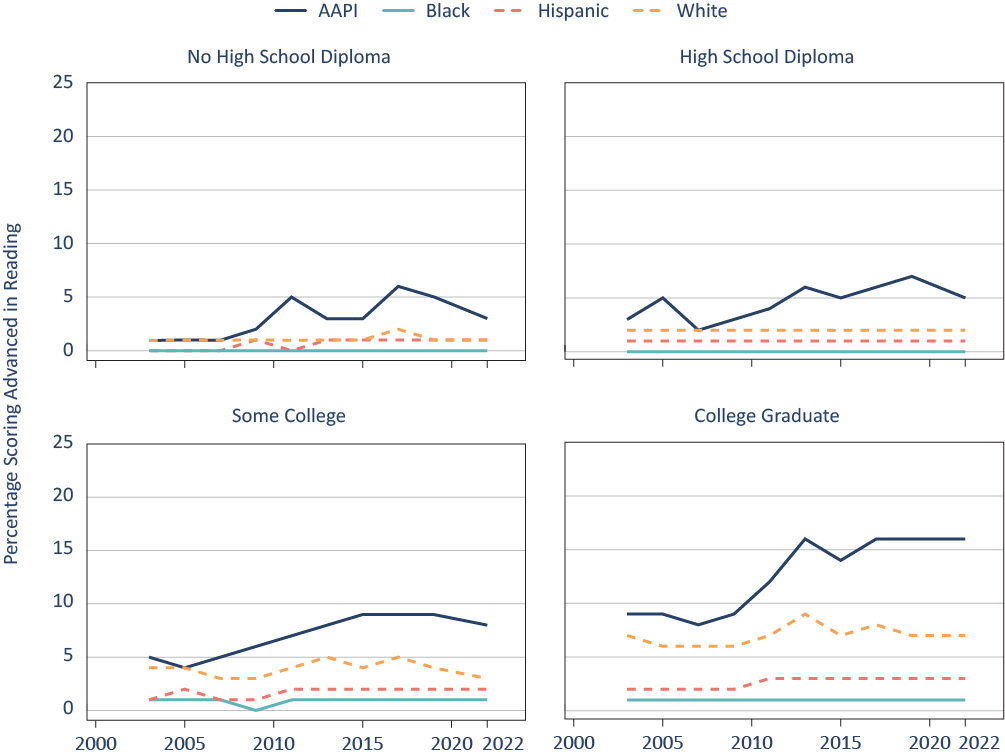
Among the lower-SES ranks, a particularly positive development is the substantial rise in the proportion of AAPI students who are Advanced achievers. In the early 2000s, these students typically outperformed other low-SES groups by only a percentage point or two, and no racial/ethnic group’s lowest-SES students had more than 3 percent achieving Advanced in math or 1 percent in reading. But lower-SES AAPI students broke away from the pack beginning in the early 2010s and strongly outperformed their counterparts in all other racial/ethnic groups in recent years. By 2019, 11 percent of the lowest-SES group of AAPI students reached Advanced in math, and 2 percent notched Advanced in reading. Their improvement is notable and encouraging, despite the fact that it does equate to widening excellence gaps during the study period, as AAPI students were slightly outperforming other groups even in the earlier years of the data.
Some of these patterns of Advanced achievement over time appear for science, but the lower overall rate of high achievement means that the gaps are mostly apparent for higher-SES groups. For more on this, see Figure A.7 in the Appendix.
Finding 5: The pandemic era saw declining Advanced achievement for all racial/ethnic groups.
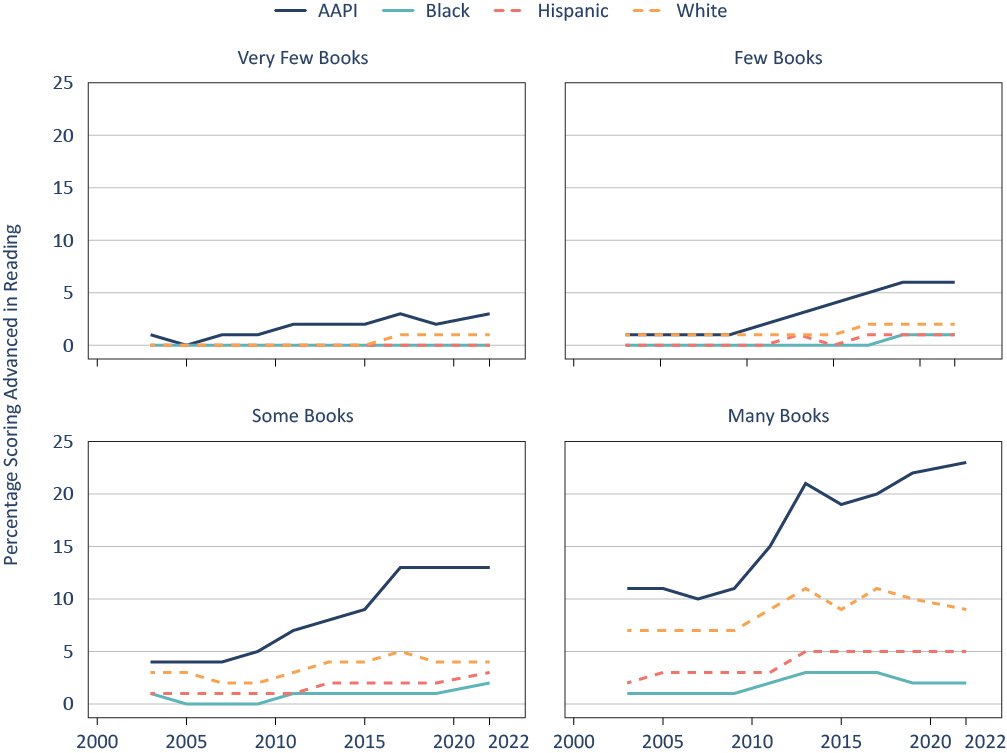
Another—more troubling—trend is the reversal of earlier progress in Advanced achievement between the 2019 and 2022 NAEP data collections, particularly in math (Figure 9). Especially among higher-SES students, Advanced achievement rates generally rose from 2003 to 2019 for all racial/ethnic groups. Between 2019 and 2022, however, among the students whose mothers attended college (whether or not they graduated), Advanced math achievement dropped for all racial/ethnic groups. These declines in Advanced performance are, of course, likely attributable to the challenges of the COVID-19 pandemic, which other studies have shown took a toll on the performance of lower achievers even more than that of high achievers.[34] These patterns are similar when using self-reported number of books in the home as the SES variable (see Figure A.8 and Figure A.9).
Figure 9. Over the past two decades, math excellence gaps by race/ethnicity within socioeconomic groups have not closed.
Summing up
We show that excellence gaps are predicted independently by student race/ethnicity and SES. Controlling for SES with the data available in NDE mitigates—but does not eliminate—excellence gaps by student race/ethnicity. That means that even when various racial/ethnic groups are compared within same-SES categories, excellence gaps largely remain. Still, race is not the entire story: higher-SES Black and Hispanic students sometimes outperform lower-SES White students. We also find that because Advanced achievement rates are generally low for lower-SES students, racial/ethnic excellence gaps are even larger within the highest-SES group than they are for students overall.
In addition, we see that all racial/ethnic groups had higher shares of students achieving at the Advanced level in the 2010s than the 2000s, although the lowest-SES Hispanic and Black students saw little growth in Advanced achievement. On the other hand, AAPI students of all SES categories have experienced soaring rates of Advanced achievement, and more research is needed to understand what factors are behind this success story.
Lastly, we find that excellence gaps have grown during the period of this study (2003 to 2022), particularly in math. The period coinciding with the COVID-19 pandemic saw some declines in Advanced achievement, although these are larger in math than in reading.
Policy implications
So what might policymakers and practitioners do to boost Advanced achievement for all student groups while working to narrow excellence gaps?
Happily, a recent report from the National Working Group on Advanced Education, on which one of us served, offers thirty-six concrete recommendations for policymakers and practitioners attempting to build a wider, more diverse pipeline of advanced learners (see Summary of recommendations of the National Working Group on Advanced Education).
The Working Group did not attempt to differentiate between recommendations focused on economically disadvantaged students versus those targeting underrepresented racial/ethnic groups. The present study indicates that, on the whole, that strategy was wise. Given the large and persistent impact that SES plays across all racial groups, actions that support lower-SES groups will support most underrepresented racial/ethnic groups, too. For example, making sure that every elementary school in the country, including high-poverty Title I schools, has a robust gifted program in place should dramatically increase the number of Black, Hispanic, and lower-SES students entering the pipeline of advanced learning opportunities.
However, this study also indicates that focusing on lower-SES groups alone won’t be enough to narrow racial/ethnic excellence gaps, because those gaps are particularly large among the highest-SES group. Put another way, policymakers and practitioners need to wrestle with the fact that fewer high-SES Black and Hispanic students, in particular, are achieving at Advanced levels than we would expect given their SES.
Several of the Working Group’s recommendations should be helpful to high-SES Black and Hispanic students, such as its calls for culturally relevant programs and curricula, “universal screening” as a check on racial bias in assigning students to gifted programs and to advanced courses, and stronger data-reporting requirements.
But even more aggressive actions might be necessary. Staffing policies provide a useful lever. Studies have shown that same-race teachers improve academic achievement for Black students.[35] A smaller body of research suggests that same-race teachers may also have a positive, if more modest, effect on Hispanic students’ achievement.[36] Having teachers of color for gifted and advanced programming has been shown to increase the enrollment of students of color in advanced courses.[37] To this end, state- and district-level policymakers can expand and invest in teacher career pathways that educators of color are most likely to pursue, including Grow Your Own teacher-prep programs and alternative teacher career pathways. Leaders will need to take care, however, not to run afoul of constitutional limitations on explicitly race-based policies, especially in light of the Supreme Court’s recent affirmative action decision.
Finally, leaders should invest in better understanding the remarkable success of even the lowest-SES AAPI students in reaching the highest levels of achievement. For example, are high-achieving AAPI students more likely to participate in after-school tutoring and academic enrichment programs? If so, how could policy expand those opportunities to students from other communities?
Shrinking excellence gaps, which are continuing to expand, is a tall order. The good news is that even seemingly small improvements in percentages will mean that thousands more children have gained the opportunity to excel.
Appendix
In this Appendix, we provide some additional results, including presentation of excellence gaps using alternative SES measures and excellence gaps in science.
Figure A.1. Math and reading excellence gaps by race/ethnicity persist within socioeconomic groups (using FRL).
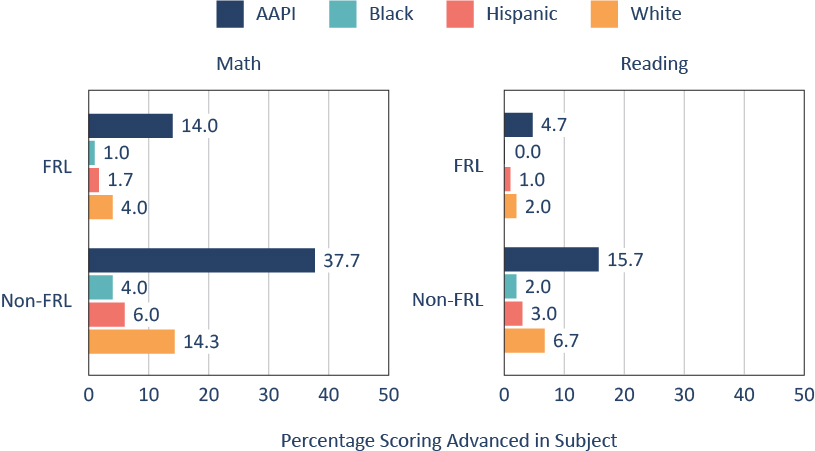
Figure A.2. Math and reading excellence gaps by race/ethnicity persist within socioeconomic groups (using number of books reported in the home).
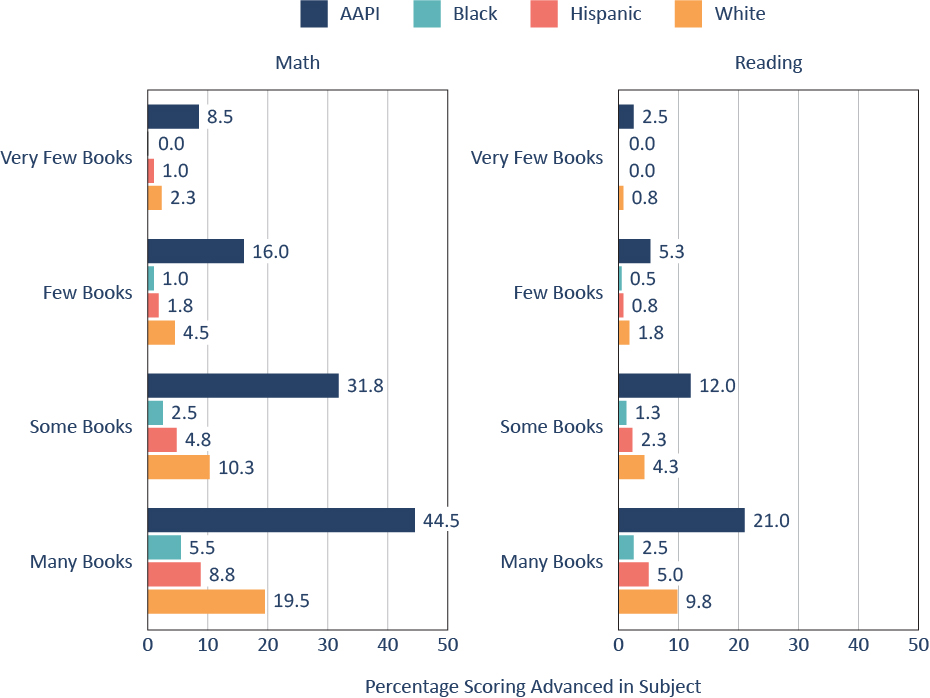
Figure A.3. Science excellence gaps by race/ethnicity persist within socioeconomic groups (using mother’s education).
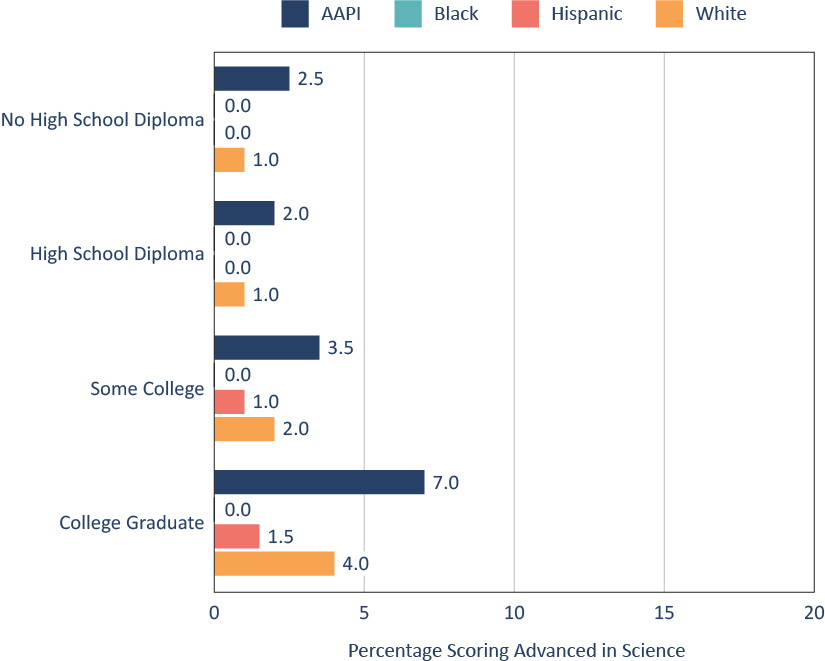
Figure A.4. Math excellence gaps are largest for the highest-SES students (using number of books reported in the home).
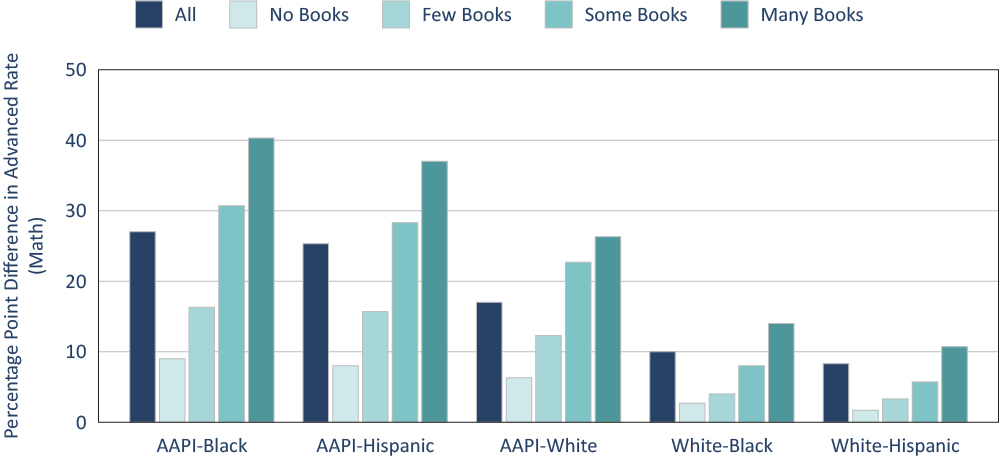
Figure A.5. Reading excellence gaps are largest for the highest-SES students (using number of books reported in the home).
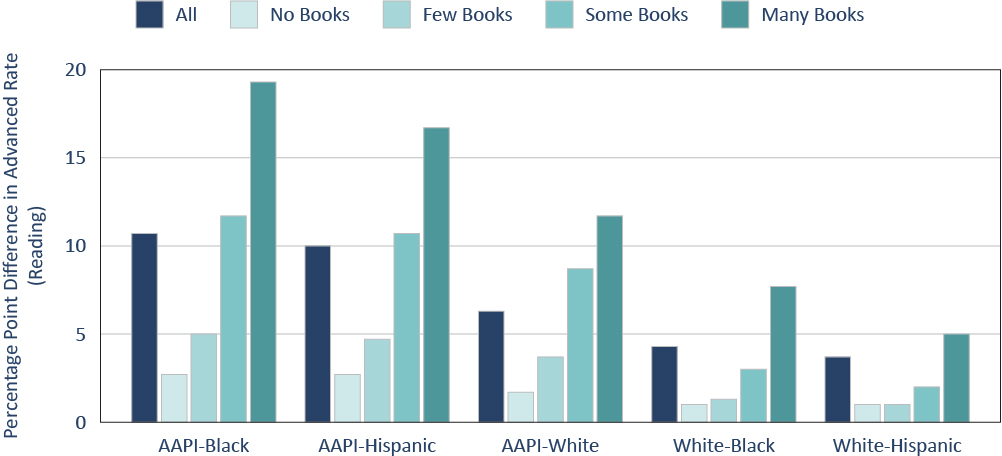
Figure A.6. The effect of SES on Advanced achievement is generally consistent across racial/ethnic groups (using number of books reported in the home).
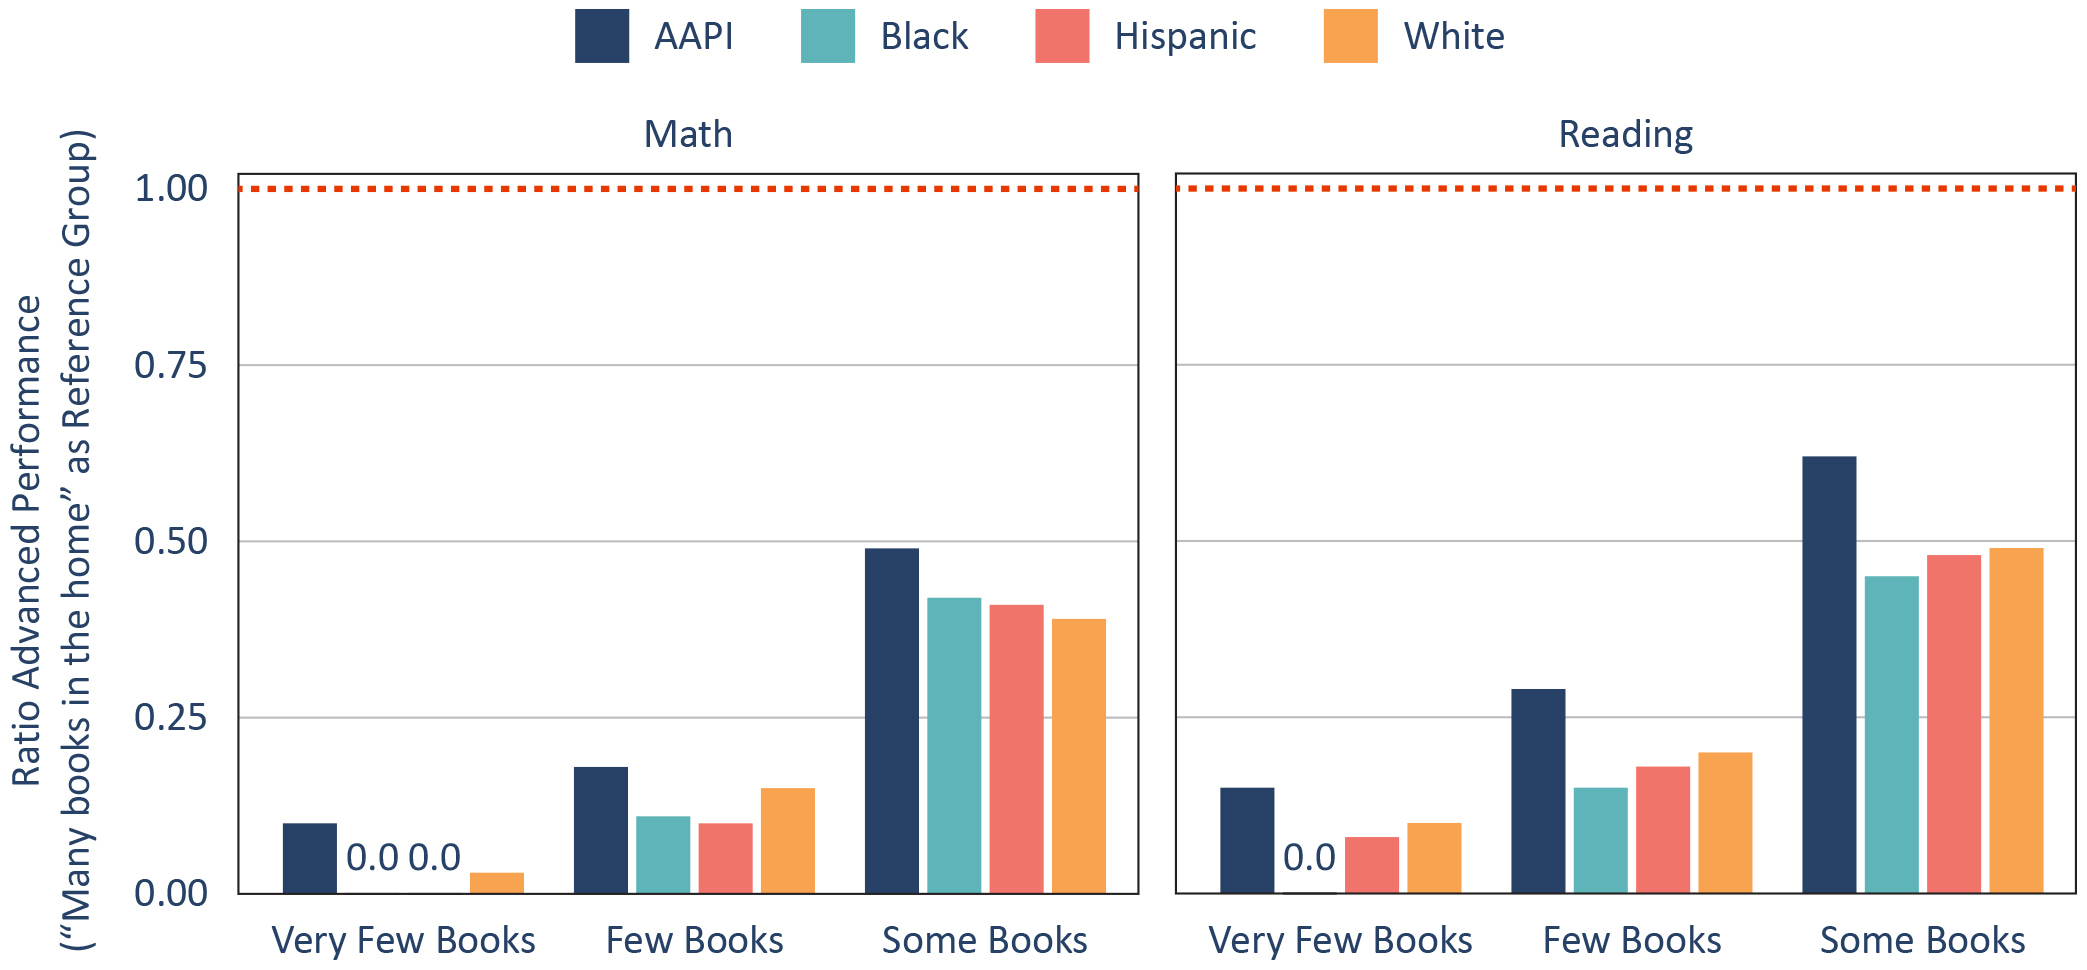
Figure A.7. Over the past two decades, science excellence gaps by race/ethnicity have persisted within socioeconomic groups (using mother’s education).
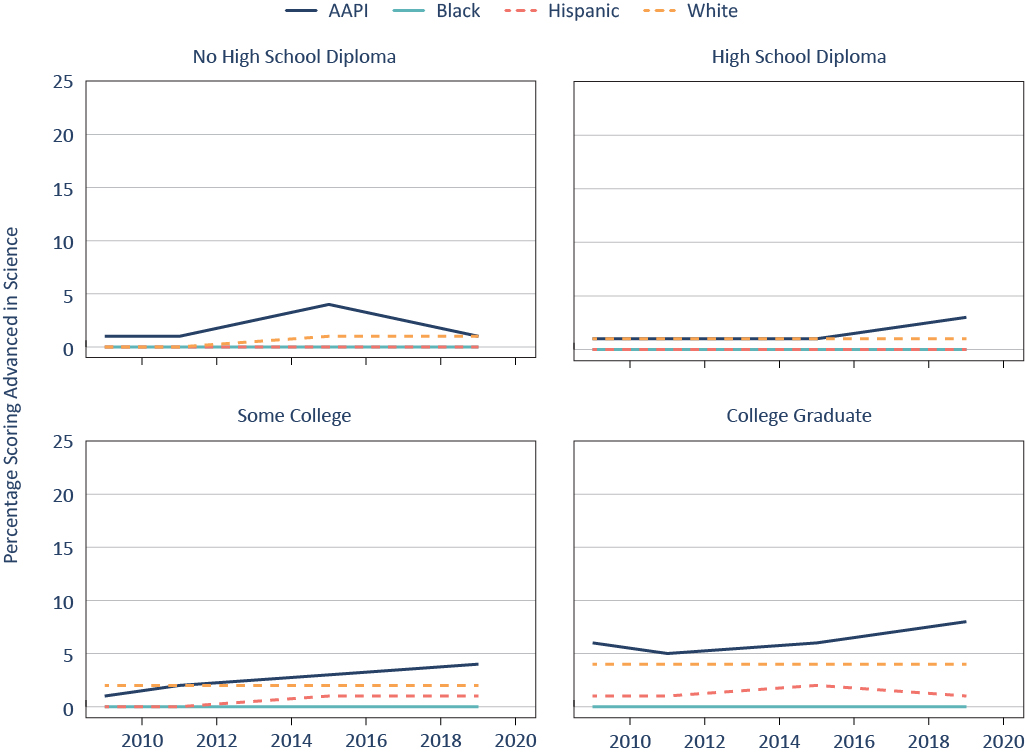
Figure A.8. Over the past two decades, math excellence gaps by race/ethnicity have persisted within socioeconomic groups (using books in the home).
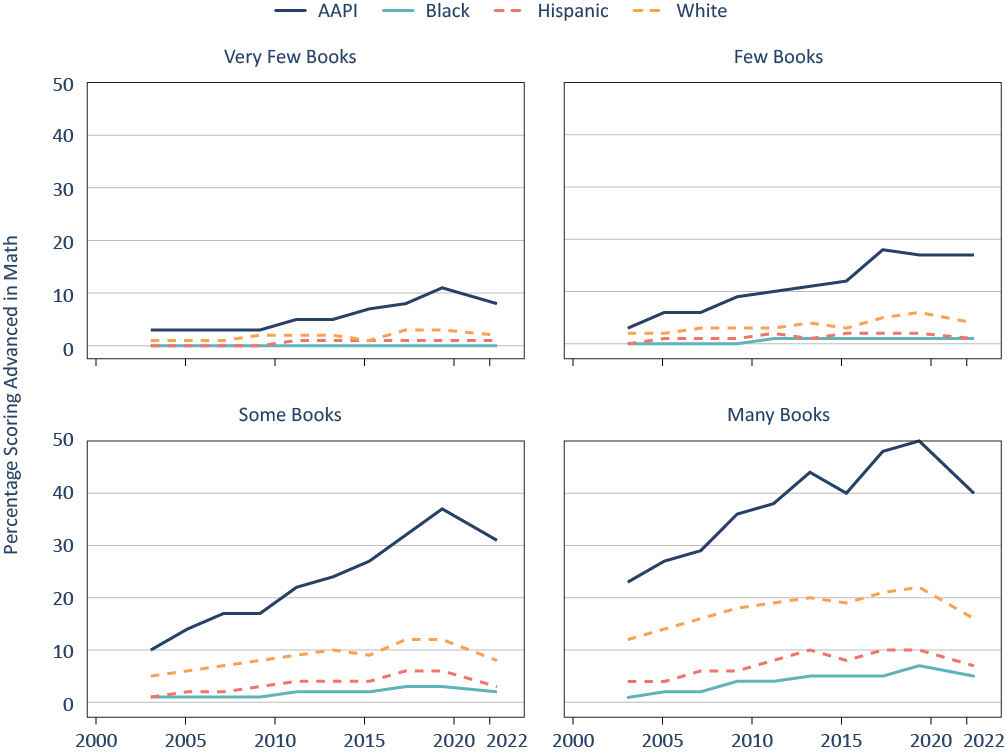
Figure A.9. Over the past two decades, reading excellence gaps by race/ethnicity persist within socioeconomic groups (using books in the home).
Endnotes
[1] Karyn Lewis and Megan Kuhfeld, Education’s long COVID: 2022–23 achievement data reveal stalled progress toward pandemic recovery (Portland, OR: Center for School and Student Progress, NWEA, July 2023), https://www.nwea.org/uploads/Educations-long-covid-2022-23-achievement-data-reveal-stalled-progress-toward-pandemic-recovery_NWEA_Research-brief.pdf.
[2] Eric A. Hanushek, “The Economic Cost of the Pandemic: State by State” (essay, Hoover Education Success Initiative, Hoover Institution, 2023), http://hanushek.stanford.edu/sites/default/files/publications/Hanushek%202022%20HESI%20EconomicCost.pdf.
[3] Emma Dorn, Bryan Hancock, Jimmy Sarakatsannis, and Ellen Viruleg, “COVID-19 and education: The lingering effects of unfinished learning,” McKinsey & Company, July 27, 2021, https://www.mckinsey.com/industries/education/our-insights/covid-19-and-education-the-lingering-effects-of-unfinished-learning.
[4] Scott J. Peters, Meredith Langi, Megan Kuhfeld, Karyn Lewis, “Unequal Learning Loss: How the COVID-19 Pandemic Influenced the Academic Growth of Learners at the Tails of the Achievement Distribution,” EdWorkingPaper: 23-787, Annenberg Institute at Brown University, June 2023, https://www.edworkingpapers.com/index.php/ai23-787.
[5] The one exception occurred in Black students’ performance in civics. Advanced performance in civics, however, remains dismal. The percentage of Black students earning Advanced civics scores previously rounded to zero; the 2022 percentage was only 1 percent. See Brandon Wright, “High-achieving middle schoolers fare poorly in U.S. history and civics, finds NAEP, but that’s nothing new,” ADVANCE, Thomas B. Fordham Institute, May 5, 2023, https://edadvance.substack.com/p/high-achieving-middle-schoolers-fare.
[6] Brandon Wright, “High-achieving middle schoolers have suffered devastating math losses, finds NAEP,” ADVANCE, Thomas B. Fordham Institute, October 25, 2022, https://edadvance.substack.com/p/high-achieving-middle-schoolers-have.
[7] Tyler Clark and Julia Roberts, “What are excellence gaps and how can we close them? An interview with Jonathan Plucker and Scott Peters,” Gifted and Talented International 33, no. 1–2 (2018): 64–70, https://doi.org/10.1080/15332276.2019.1656565.
[8] Jonathan A. Plucker, Nathan Burroughs, and Ruiting Song, Mind the (Other) Gap! The Growing Excellence Gap in K–12 Education (Bloomington, IN: Center for Evaluation and Education Policy, February 4, 2010), https://files.eric.ed.gov/fulltext/ED531840.pdf.
[9] David Rutkowski, Leslie Rutkowski, and Jonathan A. Plucker, “Trends in education excellence gaps: a 12-year international perspective via the multilevel model for change,” High Ability Studies 23, no. 2 (2012): 143–66, https://www.tandfonline.com/doi/full/10.1080/13598139.2012.735414.
[10] Daniel Hernández-Torrano, “Urban–Rural Excellence Gaps: Features, Factors, and Implications,” Roeper Review 40, no. 1 (2018): 36–45, https://www.tandfonline.com/doi/full/10.1080/02783193.2018.1393610.
[11] Carla B. Brigandi, “First-generation students in rural communities: A study of effective programming components that support closing the excellence gap,” Gifted and Talented International 35, no. 1 (2020): 3–15, https://www.tandfonline.com/doi/full/10.1080/15332276.2020.1774944; David Rutkowski, Leslie Rutkowski, and Jonathan A. Plucker, “Trends in education excellence gaps: a 12-year international perspective via the multilevel model for change,” High Ability Studies 23, no. 2 (2012): 143–166, https://www.tandfonline.com/doi/full/10.1080/13598139.2012.735414.
[12] For work on the interaction of race, socioeconomic status, and gender, see Rebecca McGraw and Sarah Thuele Lubi, “A Closer Look at Gender in NAEP Mathematics Achievement and Affect Data: Intersections with Achievement, Race/Ethnicity, and Socioeconomic Status,” Journal for Research in Mathematics Education 37, no. 2 (2006): 129–50, https://pubs.nctm.org/view/journals/jrme/37/2/article-p129.xml, and Laia Bécares and Naomi Priest, “Understanding the Influence of Race/Ethnicity, Gender, and Class on Inequalities in Academic and Non-Academic Outcomes among Eighth-Grade Students: Findings from an Intersectionality Approach,” PLOS One 10, no. 10 (2015), https://doi.org/10.1371/journal.pone.0141363. For work on the interaction of race, socioeconomic status, and sexuality, see Sung Tae Jang, “The schooling experiences and aspirations of students belonging to intersecting marginalisations based on race or ethnicity, sexuality, and socioeconomic status,” Race Ethnicity and Education (2020), https://www.tandfonline.com/doi/abs/10.1080/13613324.2020.1842350. For work on the intersection of race and community poverty rates, see Mellissa S. Gordon and Ming Cui, “The Intersection of Race and Community Poverty and Its Effects on Adolescents’ Academic Achievement,” Youth & Society 50, no. 7 (2018), https://doi.org/10.1177/0044118X16646590, and R. Aaron Wisman, “Operationalizing the Intersection of Racial and Socioeconomic Diversity in Predicting School-Level Academic Achievement,” Education and Urban Society 52, no. 6 (2020), https://journals.sagepub.com/doi/10.1177/0013124519894989.
[13] Jonathan A. Plucker, and Scott J. Peters, Excellence gaps in education: Expanding opportunities for talented students (Cambridge, MA: Harvard Education Press, 2016).
[14] Sarah Theule Lubienski, “A Closer Look at Black-White Mathematics Gaps: Intersections of Race and SES in NAEP Achievement and Instructional Practices Data,” The Journal of Negro Education 71, no. 4 (2002): 269–87, https://www.jstor.org/stable/3211180; Katherine W. Pascall, Elizabeth T. Gershoff, and Megan Kuhfeld, “A Two Decade Examination of Historical Race/Ethnicity Disparities in Academic Achievement by Poverty Status,” Journal of Youth and Adolescence 47, no. 6 (2018): 1164–77, https://www.ncbi.nlm.nih.gov/pmc/articles/PMC8209685; Daphne A. Henry, Laura Betancur Cortés, and Elizabeth Votruba-Drzal, “Black–White achievement gaps differ by family socioeconomic status from early childhood through early adolescence,” Journal of Educational Psychology 112, no. 8, 1471–89, https://doi.org/10.1037/edu0000439.
[15] Jonathan A. Plucker and Scott J. Peters briefly touch on the intersection of race and socioeconomic status in their seminal 2016 book Excellence gaps in education: “Even when controlling for socioeconomic status, excellence gaps by race/ethnicity may still exist. . . . Any interventions to address excellence gaps that focus on poverty reduction may not fully address persistent excellence gaps.” See Plucker and Peters, Excellence gaps in education.
[16] See Jonathan Plucker, Jacob Hardesty, and Nathan Burroughs, Talent on the Sidelines: Excellence Gaps and America's Persistent Underclass, (Storrs, CT: Center for Education Policy Analysis, January 2013), https://www.researchgate.net/publication/304046990_Talent_on_the_sidelines_Excellence_gaps_and_America's_persistent_talent_underclass.
[17] At the most recent NAEP science assessment in 2019, 31,400 eighth graders participated. See U.S. Department of Education, Institute of Education Sciences, National Center for Education Statistics, “Science,” December 12, 2022, https://nces.ed.gov/nationsreportcard/science.
[18] In 2009, the science framework changed such that the NCES has found that results prior to 2009 are not comparable. The current framework assesses students’ knowledge of physical, life, and earth and space sciences, as well as their abilities to identify and use science principles, apply scientific inquiry, and implement technological design. See U.S. Department of Education, Institute of Education Sciences, National Center for Education Statistics, “What Does the NAEP Science Assessment Measure?”, May 11, 2021, https://nces.ed.gov/nationsreportcard/science/whatmeasure.aspx.
[19] U.S. Department of Education, Institute of Education Sciences, National Center for Education Statistics, “Reading,” January 20, 2023, https://nces.ed.gov/nationsreportcard/reading.
[20] Since 2003, Title I funding requirements have required the biannual participation in eighth-grade reading and math testing in all fifty states, as well as jurisdictions including Washington, D.C., the Department of Defense, and the Bureau of Indian Education. Students are randomly chosen for participation, which remains voluntary at the individual level. U.S. Department of Education, Institute of Education Sciences, National Center for Education Statistics, “National Assessment of Educational Progress (NAEP),” NCES Handbook of Survey Methods, n.d., https://nces.ed.gov/statprog/handbook/naep.asp; National Center for Education Statistics, “NAEP Assessment Sample Design,” NAEP Technical Documentation, December 6, 2022, https://nces.ed.gov/nationsreportcard/tdw/sample_design.
[21] U.S. Department of Education, Institute of Education Sciences, National Center for Education Statistics, “Student Groups,” October 14, 2022, https://nces.ed.gov/nationsreportcard/guides/groups.aspx.
[22] Jere Brophy and Carole Ames, “NAEP Testing for Twelfth Graders: Motivational Issues” (paper, National Assessment Governing Board, September 2005), https://www.nagb.gov/content/dam/nagb/en/documents/publications/reports-papers/preparedness/naep-testing-motivational-issues.pdf.
[23] Hispanic students may be of any race, and the other groups are of non-Hispanic students. For our race/ethnicity variable, we used “race/ethnicity used to report trends, school-reported,” since it is the only race variable that has been collected consistently throughout the span of our study. Schools report student race/ethnicity, although this information is sometimes supplemented by student self-reported data. See The Nation’s Report Card, “Variable,” NAEP Data Explorer, n.d., https://www.nationsreportcard.gov/ndecore/xplore/NDE. In 2011, the category “Asian/Pacific Islander” was replaced by two categories: “Asian” and “Native Hawaiian or other Pacific Islander.” The latter remains too small for statistical analysis, and the NAEP Data Explorer treats “Asian/Pacific Islander” and “Asian” as equivalent categories across time, so we do as well. Similarly, also in 2011, the race category “Other or unclassified” was replaced by “Two or More Races.” Again, because the NAEP Data Explorer treats these two categories as equivalent across time, our analysis does, too. See U.S. Department of Education, Institute of Education Sciences, National Center for Education Statistics, “Student Groups,” October 14, 2022, https://nces.ed.gov/nationsreportcard/guides/groups.aspx.
[24] Parental education is often used as an indicator of socioeconomic status, and limited research suggests that maternal education may be more strongly associated with academic performance than paternal education. See Gary Neil Marks, “Are Father’s or Mother’s Socioeconomic Characteristics More Important Influences on Student Performance? Recent International Evidence,” Social Indicators Research 85, no. 2 (2008): 293–309, https://www.jstor.org/stable/27734583; Elena Arias Ortiz, “What are the Factors of Success at University? A Case Study in Belgium,” CESifo Economic Studies 54, no. 2 (2008): 121–48, https://www.researchgate.net/publication/46513074_What_are_the_Factors_of_Success_at_University_A_Case_Study_in_Belgium.
[25] The results by the number of books reported in the student’s home are similar to those reported by the mother’s education and are presented in the Appendix. This variable has four values for which NAEP takers can respond: “Few (0–10),” “Enough to fill one shelf (11–25),” “Enough to fill one bookcase (26–100),” or “Enough to fill several bookcases (more than 100).” For ease of interpretation, we refer to the values ordinally as “Very Few Books,” “Few Books,” “Some Books,” and “Many Books.” Some studies note that students of higher SES may be better at estimating the number of books in their home. For example, see Kimmo Eriksson, Jannika Lindvall, Ola Helenius, and Andreas Ryve, “Higher-achieving children are better at estimating the number of books at home: Evidence and implications,” Frontiers in Psychology 13 (2022), https://www.ncbi.nlm.nih.gov/pmc/articles/PMC9623014.
[26] Although FRL is the most common indicator of socioeconomic status used in K–12 education research, it is a binary and therefore cruder measure than the other measures we employ.
[27] See U.S. Department of Education, Institute of Education Sciences, National Center for Education Statistics, National Assessment for Educational Progress, “Mathematics Student Questionnaire, 2017 Grade 8,” 2017, https://nces.ed.gov/nationsreportcard/subject/about/pdf/bgq/student/2017_sq_student_math_g8.pdf.
[28] Black Americans, for example, earn less income than White Americans at every level of education. See Valerie Wilson, “African Americans are paid less than whites at every education level,” Economic Snapshot, Economic Policy Institute, October 4, 2016, https://www.epi.org/publication/african-americans-are-paid-less-than-whites-at-every-education-level.
[29] Paul L. Morgan, George Farkas, Marianne M. Hillemeier, Yangyang Wang, Zoe Mandel, Christopher DeJarnett, and Steve Maczuga, “Are students with disabilities suspended more frequently than otherwise similar students without disabilities?” Journal of School Psychology 72 (2019): 1–13, https://www.sciencedirect.com/science/article/pii/S0022440518301171.
[30] National Assessment Governing Board, “The Nation’s Report Card: Reading and Mathematics Achievement Levels,” National Assessment of Educational Progress, 2022, https://www.nagb.gov/content/dam/nagb/en/documents/naep/naep-day/2022/the-nations-report-card-reading-and-mathematics-achievement-levels.pdf.
[31] Ibid.
[32] The NDE automatically rounds percentages to the nearest whole number. As a result, it’s possible that 1.6 percent of a certain student group earned Advanced scores and 1.4 percent of another group did so—a small difference of 0.2 percent—but the results suggest that twice as high a percentage of the first group earned Advanced compared to the second. Given that the percentages scoring Advanced are so low in many cases, the effect of automatic rounding could be more than marginal, but our approach, which averages rates for the static analysis, mitigates this concern.
[33] As discussed in the methodology section, there is variability in the SES distributions for different racial/ethnic groups.
[34] Peters, Langi, Kuhfeld, and Lewis, “Unequal Learning Loss.”
[35] See Seth Gershenson, Michael Hansen, and Constance A. Lindsay, Teacher Diversity and Student Success: Why Racial Representation Matters in the Classroom (Cambridge, MA: Harvard Education Press, 2021).
[36] Constance A. Lindsay, Tomás Monarrez, and Grace Luetmer, “The effects of teacher diversity on Hispanic student achievement in Texas,” (Washington, D.C.: Urban Institute, November 2021), https://www.urban.org/sites/default/files/publication/105325/the-effects-of-teacher-diversity-on-hispanic-student-achievement-in-texas_0_0.pdf.
[37] Jason A.Grissom, Luis A. Rodriguez, and Emily C. Kern, “Teacher and principal diversity and the representation of students of color in gifted programs: Evidence from national data,” The Elementary School Journal 117, no. 3 (2017): 396–422, doi:10.1086/690274.
[38] Thomas B. Fordham Institute, Building a Wider, More Diverse Pipeline of Advanced Learners: Final Report of the National Working Group on Advanced Education (Washington, D.C.: Thomas B. Fordham Institute, June 2023), https://fordhaminstitute.org/national/research/building-wider-more-diverse-pipeline-advanced-learners.
About this study
This report was made possible through the generous support of our sister organization, the Thomas B. Fordham Foundation. In addition, we are grateful to external advisers Scott Peters, senior research scientist at NWEA, and Jonathan Plucker, the Julian C. Stanley Endowed Professor of Talent Development at Johns Hopkins University, for their multiple rounds of insightful feedback; to Pamela Tatz for her thorough copyedit; and to Dave Williams for designing the figures and tables.
At Fordham, we thank Meredith Coffey and Adam Tyner for authoring this analysis, Chester E. Finn, Jr. for reviewing drafts, Jeanette Luna for handling funder communications, and Victoria McDougald for her role in dissemination.


