
The Cupp-Patterson plan: Lots more resources, no reform
Earlier this month, the Ohio House Finance Committee began hearings on a school funding plan crafted by Representatives Robert Cupp and John Patterson, along with a group

Earlier this month, the Ohio House Finance Committee began hearings on a school funding plan crafted by Representatives Robert Cupp and John Patterson, along with a group




Earlier this month, the Ohio House Finance Committee began hearings on a school funding plan crafted by Representatives Robert Cupp and John Patterson, along with a group of school district administrators. The current cost estimate of a fully implemented plan clocks in at $1.5 billion additional dollars per year, equivalent to a roughly 15 percent increase above the state’s current $9.3 billion outlay on K–12 education. The price tag could escalate even further after several cost studies called for under the plan are completed. Bear in mind, too, that these dollars only represent the state contribution to K–12 education, excluding the $10 billion raised via local school taxes and the $2 billion Ohio receives in federal aid. And it does nothing to ensure equitable funding for children attending schools of choice.
But the disappointment for reformers isn’t just due to the plan’s feeble approach to charter schools and private school choice; it’s also lackluster when it comes to traditional public schools. Given the cost of the proposal, one might think that legislators would be eager to leverage these funds to drive stronger student outcomes. Remarkably, the Cupp-Patterson plan does no such thing. While the plan spreads millions more in state aid to public schools, it demands nothing in return for these funds. It’s a $1.5 billion blank check.
Some may argue that simply pouring more money into the existing system will automatically result in higher achievement. Anything’s possible, but even scholars who disagree about the relationship between school spending and outcomes have asserted that how money is spent matters greatly when it comes to influencing outcomes. A key question, then, is how can lawmakers increase the chances that schools spend this influx of funds wisely, resulting in higher student achievement? Let’s consider three possibilities.
First, strengthen results-based accountability. The state shouldn’t micromanage the way in which schools spend money, but it should insist on satisfactory student results in return. Unfortunately, the Cupp-Patterson plan makes no commitment to maintain even current accountability measures—such as school report cards or interventions in failing districts and schools—let alone offer any new ideas to bolster accountability in Ohio. Instead, both of the plan’s legislative sponsors—and a large number of their House colleagues—would prefer to undo accountability by ditching the state’s academic distress commissions via House Bill 154.
Legislators should also consider further outcomes-oriented mechanisms to ensure that schools use the additional support to benefit students. In Massachusetts, for example, reform- and business-minded groups have insisted that any new education money be paired with robust accountability, including improvement plans—reviewed and overseen by the state—that aim to narrow achievement gaps and increase readiness for college and career. Regrettably, the Cupp-Patterson plan does not follow this model, and would instead give away the goodies, at taxpayer expense, without expecting much in return.
Second, incorporate structural reforms. Legislators could also consider pairing funding increases with reforms to archaic laws that lead to ineffectual spending. But as with accountability, the Cupp-Patterson plan proposes no reforms to the way schools operate, especially with respect to their staffing and compensation practices (the locus of most spending). The following list offers four potential reforms that might allow Ohio schools to use funds in ways that maximize student achievement.
Third, beef up performance-based funding. A third option legislators could explore is tying school funding directly to outcomes in an effort to provide an extra incentive to meet performance goals. Indeed, Ohio already does in a few ways. First, the state distributes a small amount of extra aid—$31.2 million statewide, or just $19 per pupil, as of FY 2018—based on third grade reading proficiency and graduation rates. Second, in a new dimension of charter funding, Ohio provides a much heftier $1,750 per economically disadvantaged pupil in supplemental aid to quality schools that meet certain report card benchmarks. Third, starting with the FY 2020–21 state budget, Ohio provides a $1,250 bonus to schools when students earn in-demand industry credentials.
The Cupp-Patterson plan eliminates the third grade reading and graduation bonus, and it’s not yet clear whether it will incorporate the quality charter or credentialing funding.[1] As presently designed, scrapping the third-grade reading and graduation bonus makes sense. The meager funding pool, which is then spread over all districts—providing money to even the state’s worst performers—is unlikely to drive higher results. But the targeted approaches of the quality charter and industry-credentialing programs offer more promising examples that legislators could build on.
Pouring millions more into the K–12 education system without accountability or reform is a recipe for more of the same—and more of the same isn’t good enough. While there are commendable aspects of the Cupp-Patterson plan, it falls noticeably short on any proposal to ensure that schools leverage dollars to benefit students. On this count, Ohio legislators have more work ahead.
[1] The Cupp-Patterson plan was released prior to the enactment of the state budget for FYs 2020–21, the first years in which the supplemental charter and industry-credential funds were made available.

Last year, NBA superstar LeBron James opened I Promise School (IPS), a school for at-risk kids in his hometown of Akron, Ohio. In its first year (2018–19), IPS served 240 students in grades three and four. This year it expanded to include fifth grade, and now serves 344 students.
IPS is a joint effort between Akron Pubic Schools (APS), the I Promise Network, and the LeBron James Family Foundation. It’s not a charter school; it’s overseen by APS, the state’s sixth largest school district, and holds a lottery to admit students. But it also offers a host of things most district schools don’t, such as free uniforms, tuition to the University of Akron when students graduate high school, and family services like GED classes and job placement assistance. The school also has some unique characteristics that are more often associated with schools of choice: an extended school day and year, a STEM curriculum, and alternative working conditions for teachers, such as required home visits.
The school’s grand opening in July 2018 made national headlines and earned James a considerable amount of well-deserved praise. There were plenty of hot takes to go along with the praise, including some folks who saw an opportunity to take potshots at their least favorite education policies, namely charter schools. But by and large, most people were excited about the prospect of another high quality school, and eager to see if IPS could follow through on its promise (pun intended) to change the trajectory of hundreds of kids’ lives.
The first round of results arrived this spring. The school announced on Twitter that 90 percent of its students had met or exceeded their expected growth in math and reading. These results were based on NWEA MAP, a national computer adaptive assessment that measures academic growth over time. Coverage in USA Today called the results “extraordinary.” The New York Times offered additional details: In reading, both the third and fourth grade classes initially tested in the 1st percentile. MAP results showed that third graders had improved to the 9th percentile, and fourth graders to the 16th. In math, third graders moved from the 1st percentile to the 18th, and fourth graders jumped from the 2nd percentile to the 30th.
USA Today was right to call these results extraordinary. But as significant as they are, they are only one measure. Even NWEA will tell you that multiple measures matter. To be considered successful, IPS was going to have to do more than demonstrate growth on diagnostic measurements.
To their credit, most media outlets recognized that. The New York Times pointed out that “time will tell whether the gains are sustainable and how they stack up against rigorous state standardized tests at the end of the year.” Locally, the Akron Beacon Journal noted in August that state test results would be “unlikely to show the school in a positive light.” The piece quoted APS school improvement coordinator Keith Liechty-Clifford saying, “We’re prepared to receive an F” because “our students come to us low, and it’s going to take some time.” But he also noted the school expected to show growth, and that “we are all operating under the belief we will not be an F school.”
Well, it’s mid-October in Ohio. That means school report cards have been out for a month or so. So, did IPS get an F?
Nope. In its first year, IPS earned an overall grade of C. For a brand new school that purposely targeted students who were performing a year or two behind grade level, that’s very impressive. It’s even more praiseworthy considering the school’s demographics: 100 percent of the student population is economically disadvantaged, 29 percent are students with disabilities, 15 percent are English language learners, and more than 80 percent are minorities.
A more detailed breakdown of state report card components shows a mixed bag. On the achievement component, which measures how well students perform on state assessments, IPS earned that F it feared. That’s not entirely surprising, considering the achievement measure looks to see how well students have mastered grade level material, and most of I Promise’s students entered the school far below grade level. IPS still has plenty of room to grow in this area, and their teachers and staff are fully committed to getting the job done. In the coming years, it will be important to keep an eye on whether the school’s Performance Index (PI) scores increase. If IPS is able raise its PI score each year, that will be a sign that kids are headed in the right direction.
The progress component, meanwhile, determines the growth of students based on their past performance. Unlike the achievement component, progress gives credit when students—including those below grade level—make significant growth during the year. IPS really shined on the progress component, earning an A. For reference, Akron Public Schools is home to twenty-eight elementary schools, of which only four (including IPS) earned an A on their progress components. In English language arts, evidence shows that IPS students made progress similar to statewide expectations—about one year’s worth of growth. In math, however, there is significant evidence that students made far more progress than expected. The school also earned high marks for progress in certain subgroups: receiving a B for students identified as the lowest 20 percent statewide in reading, math, or science, and another B for students with disabilities.
The upshot? Both the state report card and in-house MAP growth data indicate that students at IPS are learning a lot. In many cases, they’re learning more than their peers in other schools and districts. If this growth continues, the school will be well on its way to keeping its promise to Akron families and the community. The New York Times is right: Only time will tell if these gains are sustainable. The job is only going to get harder as the school expands to more grade levels. But so far, students, school staff, and the Akron community should be proud of their progress. And so, too, should LeBron—the coolest thing he’s ever done is already paying dividends for kids.

“Confront the brutal facts (yet never lose faith)” – Jim Collins, Good to Great
Cheerleading on schools and students is widespread in K–12 education. Go to a school district website and you’re bound to see something heralding an afterschool program, celebrating an arts initiative, or profiling the most recent teacher of the year.
This positivity is well and good—and completely understandable. But once in a while, we need a reality check. Every two years, the National Assessment of Educational Progress (NAEP), commonly referred to as the “Nation’s Report Card,” gives us the cold (often hard) facts about student achievement in America. A random sample of fourth and eighth grade students in all fifty states take the NAEP exams in reading and math. And in today’s release of data from the 2019 assessment, NAEP again delivers sobering news about achievement both nationally and in Ohio.
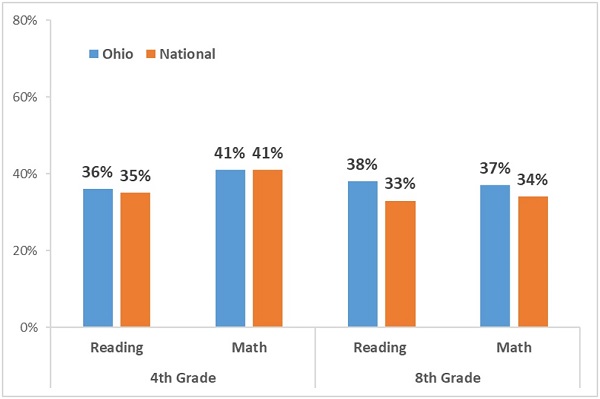
NAEP has long been a much sterner test of student proficiency than Ohio’s state exams. That was no different in 2019. As figure 1 indicates just 36 percent of Ohio students reached proficiency or above on fourth grade reading NAEP exams, 41 percent on fourth grade math, 38 percent in eighth grade reading, and 37 percent in eighth grade math. As the chart below shows, Ohio’s proficiency rate tracks closely to the national average in fourth grade and is slightly ahead in eighth grade. Though not displayed here, upwards of 60 percent of Ohio students reach proficiency on most state exams.
Figure 1: Student proficiency on 2019 NAEP exams, Ohio and national
Source (for all data displayed in this piece): NAEP Data Explorer. Note: For NAEP proficiency rates from 2017, see our Ohio By The Numbers webpage.
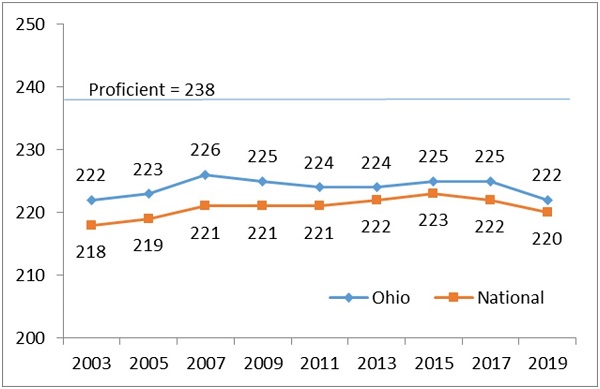
While the proficiency data remind us how much work is needed to enable all students (or even a majority) to reach high academic standards, the NAEP trend data offers insight into whether Ohio is making progress toward that goal. Unfortunately, as the figures below indicate, progress has been slow over the past decade and a half. Even more sobering is that Ohio, following national trends, lost some ground in three of the four NAEP exams between 2017 and 2019.
Figures 2 and 3 display results from fourth grade. While Ohio scores were unchanged in fourth grade math between 2017 and 2019, scores have noticeably slumped over the longer term, leading to a convergence between Ohio and the national average in 2019.
Figure 2: Fourth grade math NAEP scores, Ohio and national
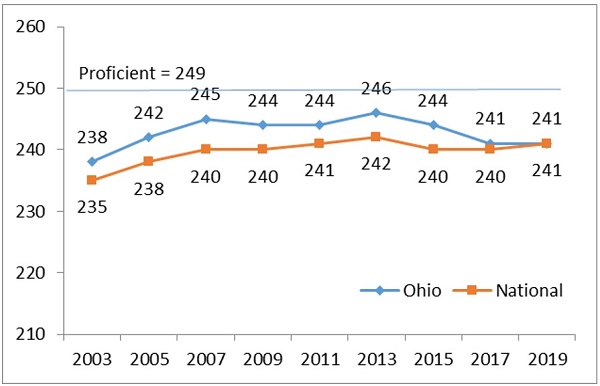
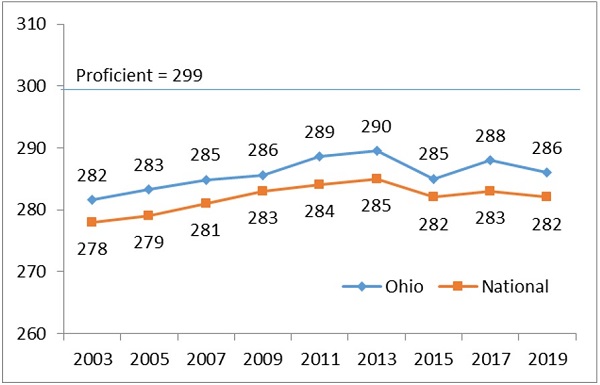
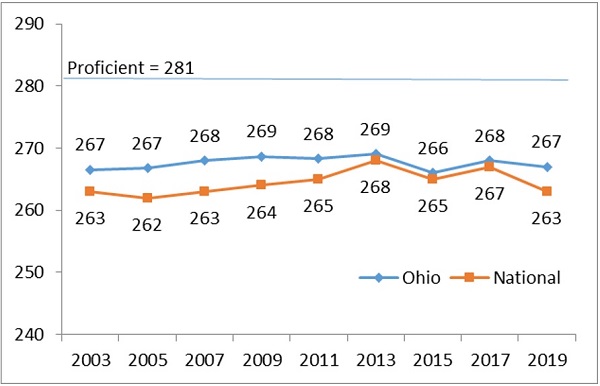
Note: Figures 2 through 5 display NAEP scaled scores, with the exam’s proficiency bar displayed for reference (the full range of scores across all of these exams is 0–500).
On the reading side, Ohio scores have been largely stagnant during the period shown in the figure below, though the three-point decline between 2017 and 2019 is worrying, especially given the state’s recent efforts to improve early literacy.
Figure 3: Fourth grade reading NAEP scores, Ohio and national
Turning to eighth grade, figure 4 indicates that math has been a bright spot for Ohio, with generally increasing scores over the period shown below. The results in recent years, however, have been more uneven, with the slide in the 2019 scores (relative to 2017) offsetting the uptick registered in 2017.
Figure 4: Eighth grade math NAEP scores, Ohio and national
Akin to fourth grade reading, Ohio’s eighth grade reading scores have also been largely flat since 2003. Fortunately, the slight dip in Ohio’s 2019 eighth grade reading score was less severe than the four-point drop in the national average from 2017 to 2019.
Figure 5: Eighth grade reading NAEP scores, Ohio and national
Because NAEP administers the same tests in all states, we can see how Ohio stacks up nationally. Table 1 below shows Ohio’s rankings on these exams since 2003. Generally speaking, Ohio has ranked between 10th and 20th in the nation in student achievement, a pattern also visible in the 2019 data. Compared to 2017, Ohio moved up in the rankings in eighth grade reading, perhaps because it didn’t lose as much ground as its counterparts (see figure 5). In the other subjects, Ohio’s ranking slightly declined. Overall, these results should ease concerns that Ohio’s school system is falling behind, but also put to rest any fanciful notion that Ohio is (or has been) one of the nation’s highest performers.
Table 1: Ohio’s national ranking on NAEP exams
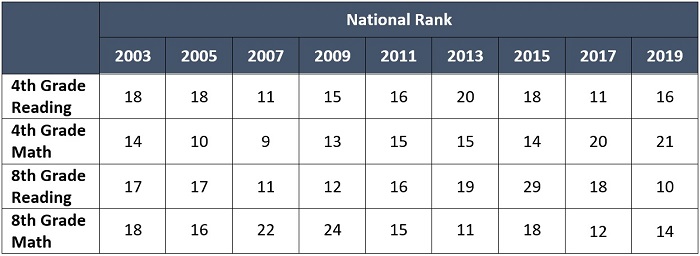
Note: These rankings include all 50 states plus the District of Columbia and US Department of Defense Education Activity. To see how Ohio compares on NAEP after making adjustments for states’ demographics, see the Urban Institute’s website.
* * *
The brutal fact, as delivered by NAEP, is that too few Ohio students are reaching rigorous academic benchmarks. And progress, whether influenced more so by economic or educational trends, has been much too slow over the past decade and a half. Yes, it’s important to root on our schools and praise their successes, but we cannot forget the state of achievement in Ohio. By confronting these facts, and not running away from them, Ohio’s policymakers will be in the best position to help change the trajectory of achievement in the Buckeye State.

Back during the 2016–17 school year, Ohio was in the midst of creating its plan for meeting federal education requirements under the Every Student Succeeds Act (ESSA). One provision in ESSA calls on states to set “ambitious” goals for English and math proficiency rates, including narrowing achievement gaps between students of different backgrounds.
With significant input from Ohioans, the state’s ESSA plan establishes steadily increasing achievement targets for all Ohio students, as well as for nine specific subgroups. For instance, under Ohio’s plan, economically disadvantaged (ED) students are expected to almost double their English proficiency rate from a baseline of 39.3 percent in 2015–16 to 69.7 percent by 2025–26. While meeting this target won’t necessarily erase the entire gap between ED students and their non-ED peers, it would be a terrific accomplishment to help so many low-income pupils become proficient in reading and writing.
In the wake of last month’s release of the 2018–19 school year data, we now have three years of test scores to check whether Ohio is meeting its achievement goals. Note that the specific goals vary by subgroup depending on their starting point, but all subgroups are expected to show improvement each year.
Without further ado, let’s dig in.
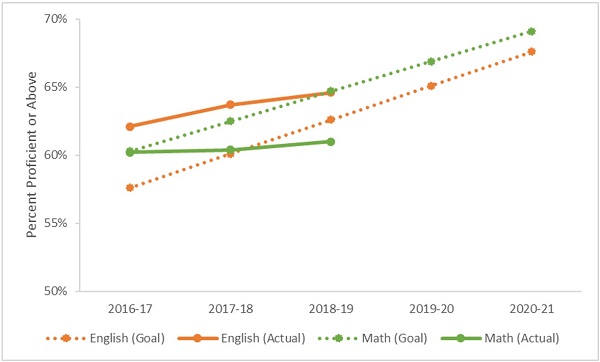
Figure 1 below shows English and math proficiency rates on state exams among all Ohio public school students. The solid lines display the actual results in these subjects (combined across grade levels), while the dotted lines represent the state’s proficiency targets for all students over a five-year period. Ohio students have outperformed the state’s targets in English in each of the past three years. That’s good news. However, students have not had the same degree of success in math. In 2018–19, math proficiency rates fell noticeably short of the state’s goal: 61 percent reached proficient versus a 65 percent target. Moreover, in both subjects, Ohio will need to increase its rate of improvement to keep pace with the escalating targets set forth in its ESSA plan.
Figure 1: English and math proficiency rates for all Ohio students, actual versus goal
Sources for figures 1–3: Ohio Department of Education, ESSA Plan (Appendix A) and State Report Card. Other subgroup comparisons—e.g., by race/ethnicity—can be examined by following these links. Note: The ESSA goals for 2016–17 were set prior to the release of the 2016–17 report cards on September 14, 2017. A draft version of the goals presented at the July 2017 State Board of Education meeting matches the goals submitted to the U.S. Department of Education on September 15, 2017.
A similar story emerges for the economically disadvantaged subgroup of students. As the orange lines in Figure 2 indicate, ED students outperformed the state’s goals in English over the past three years. But they’ve been missing the mark in math. In 2018–19, just 46 percent of ED students reached proficiency in math, while the goal was 51 percent. If the flat trend in math proficiency persists, an even greater gap will emerge between ED students’ actual proficiency rates compared to the targets.
Figure 2: English and math proficiency for economically disadvantaged students, actual versus goal
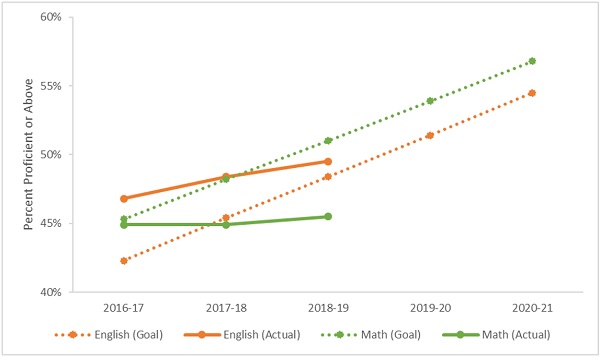
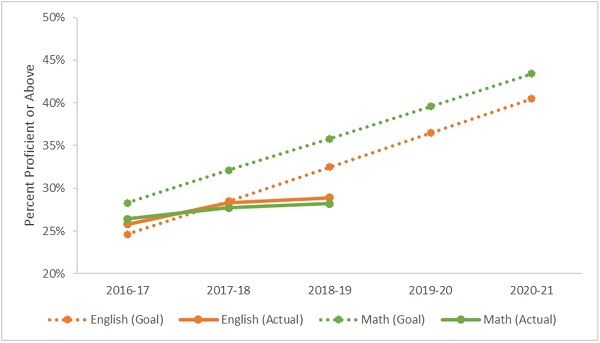
Figure 3 reveals the results for students with disabilities (SWD), who represent 15 percent of Ohio students. Here, the results are especially disappointing. In 2018–19, proficiency rates in both subjects fell short of the state goals for SWDs. Less than 30 percent of SWDs reached proficient in math and English, while the goal was set at 33 percent in English and 36 percent in math.
Figure 3: English and math proficiency for students with disabilities, actual versus goal
* * *
Setting and striving to reach ambitious goals around English and math proficiency makes common sense. Students who cannot read, write, and do math proficiently by the time they exit high school are likely to face a lifetime of frustration in the workplace and in their adult lives. The data shown above indicate that, while Ohio has made incremental gains, the pace of improvement—in math most urgently—needs to quicken if these proficiency goals are going to be met in the years to come.

A recent working paper published by the National Bureau of Economic Research looks at the effectiveness of two methods typically used to boost preschool quality—an infusion of funding and an increase in pedagogical supports—and surfaces some eye-opening results.
A group of international researchers studied the rollout of a nationwide program to improve the quality of education in hogares infantiles (HI), the public preschool system in Colombia. The HI program is the oldest public center-based childcare program in the country. It is targeted at families with working parents and enrolled an average of 125,000 children per year in the most recent decade. In 2011, the Colombian government announced a plan to upgrade HI program quality with a cash infusion representing a 30 percent increase in per child expenditures per year. The funding was to be used to purchase learning materials (books, toys, etc.) and to hire more staff, specifically classroom assistants, nutrition or health professionals, and professionals in child social-emotional development. The government provided some guidance for the proportions in which the money was to be spent, but HIs had some discretion within these guidelines. About two-thirds of the funding went to hire new staff.
In 2013, Colombian National University and NGO Fundacion Exito (FE) joined the effort by providing free education courses for HI teachers, including “technical guidelines for early childhood services; child development courses; nutrition; brain development; cognitive development; early literacy; the use of art, music, photography and body language for child development; mathematical concepts during early childhood; and pedagogical strategies during early childhood.” These courses were not mandatory, and HIs were free to participate as they wished.
Researchers were able to take advantage of the rollout structure for the new funding amounts and the free education courses to create three study groups—forty HIs that received only the government money (referred to as HIM), forty HIs that took advantage of the teacher education component and the government money (called HIM+FE), and a control group of forty HIs whose participation in either effort was delayed and thus continued business as usual over the study period.
Baseline data were obtained in mid-2013 from a sample of 1,987 children evenly distributed among the three study groups. Students were tested again eighteen months later, in late 2014. Researchers were able to assess nearly 92 percent of the students at both beginning and end, and the vast majority of those had persisted in the same HI center throughout the study period. Data were gathered in various areas of child development, such as cognitive and language skills, school readiness, and pre-literacy skills, as well as preschool quality and the quality of the home environment.
Compared to the control group, the HIMs saw no additional improvements in their students’ cognitive and social-emotional development despite the sizeable influx of cash. Some of the children in HIMs even lost ground as compared to their HI peers, especially in vital pre-literacy skills. However, in the HIM+FE centers, students realized statistically significant gains as compared to both of the other groups. Students from the poorest families notched the largest gains.
While it stands to reason that more funding and more teacher training would produce noticeable gains over the status quo, the question of how more funding by itself could produce negative results vexed researchers. After digging into teacher surveys, however, it became apparent that the new hires and “learning toys” were supplanting rather than supplementing HIM teachers’ interactions with children, leading to a decrease in actual teaching and learning.
These findings provide important evidence that education systems must spend money thoughtfully and strategically if true benefit is to accrue to the children in their care. Simply getting more funding with few strings attached can be counterproductive to the goal. But even more clear is that effective teacher training and professional development matters a whole lot in any setting.
SOURCE: Alison Andrew, et. al., “Preschool Quality and Child Development,” NBER Working Papers (August, 2019).

With the backing of Chevron and local philanthropy, the Appalachia Partnership Initiative (API) was launched five years ago. The initiative’s purpose is “to help develop a skilled workforce that can meet the needs of the energy industry and related manufacturing industries” within a twenty-seven county region that encompasses Southwestern Pennsylvania, Northern West Virginia, and Eastern Ohio. With a rapidly growing natural gas industry in the region, improving the STEM skills of workers is critical to meeting the human-capital needs of employers.
To gauge progress, API tapped the RAND Corporation to conduct periodic analyses about project implementation (my review of an earlier paper is here). While API also invests in adult workforce training, the focus of its latest report is the initiative’s efforts to bolster STEM education among the region’s K–12 students. API articulates four goals: 1) raise young people’s awareness about STEM career opportunities; 2) promote the acquisition of skills needed for those careers; 3) provide professional development for teachers and career counselors; and 4) develop networks between students and employers through activities such as mentoring or job-placement.
It’s important to note at the outset that this report does not provide evidence about the initiative’s effects on student achievement outcomes. Rather, it offers a useful overview of the programs that API helped to support, which students participated in them, and how the initiative helped to create connections within communities. To provide this type of descriptive portrait, the analysts rely on self-reported data from providers along with interviews with program staff.
During the first three years of implementation (2014–17), API provided grants to seven organizations supporting anything from hands-on programming directly serving K–12 students, to STEM curricula and teacher development. To get a flavor of the program’s scope, a few specific examples are worth mentioning.
All in all, the RAND analysts estimate that API funded programs reach about 40,000 students per year in the tristate region. Yet the report also notes that participation is more heavily concentrated in Pennsylvania and West Virginia, but only “lightly represented” in Ohio. It’s not altogether clear why that is, though the lack of Ohio-based philanthropic support for API might explain some of it. Regardless, this seems to be a lost opportunity for Eastern Ohio students, many of whom struggle to reach the college-and-career-ready targets needed to excel in STEM occupations. Despite that setback—and c’mon Ohio!—the API approach of connecting businesses, nonprofits, and schools together in the mission of improving STEM education should be heartily applauded.
SOURCE: Gabriella C. Gonzalez, Shelly Culbertson, and Nupur Nanda, The Appalachia Partnership Initiative’s Investments in K-12 Education and Catalyzing the Community, RAND Corporation (2019).

Parents, when surveyed, routinely tell us that safety is one of their top priorities when choosing a school. Although what exactly constitutes a “safe” school likely varies, for many it means a place where children feel welcomed and accepted.
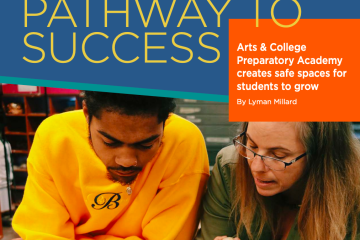
In this school profile, the latest in our Pathway to Success series, author Lyman Millard of the Bloomwell Group, gives us an inside look at a Columbus-based public charter school that creates safe spaces for young people to grow both artistically and academically.
Founded almost twenty years ago, Arts & College Preparatory Academy (ACPA) today serves about 400 students, including one student, profiled in this piece, who has thrived in the school’s unique learning environment.
With a facility expansion completed earlier this year, ACPA is poised to reach more Central Ohio students needing an opportunity to attend a high-quality school where they belong.