
Federal relief funding should be used to help schools reopen
With Covid-19 cases on the rise and state budgets in crisis, federal lawmakers seem poised to pass another round of stimulus.

With Covid-19 cases on the rise and state budgets in crisis, federal lawmakers seem poised to pass another round of stimulus.


With Covid-19 cases on the rise and state budgets in crisis, federal lawmakers seem poised to pass another round of stimulus. It appears that K–12 education will receive a decent portion of the emergency aid, likely exceeding the $13.5 billion-plus provided to U.S. schools in the last package. A recent Washington Post article reports that federal lawmakers are mulling the possibility of tying K–12 funding to school reopenings—perhaps unsurprising given the president’s recent comments urging schools to reopen for in-person learning this fall.
No one can be sure whether the feds will come through with additional funds (and if so when), or whether they’d condition funding on reopening. Even if Congress doesn’t require it, Ohio policymakers should—provided it can be done within federal rules—work to ensure that any forthcoming relief be used to help schools safely reopen. Here are three reasons why. Note: Given the present challenges with Ohio’s budget, it’s unlikely that the state will be able to provide extra funds in the coming year.
As is often the case with funding, several details about distributing funds to support reopenings would need to be ironed out. Among them include the following. First, the distribution model would need to ensure that funds actually reach the schools that are open—a concern, for example, in districts that reopen their elementary schools but keep their high schools shut. Second, the state may need a process that verifies schools are actually open. Third, the model should take into account student needs, so that high-poverty schools that reopen receive more supplemental aid than wealthier ones.
Reopening schools safely should be a national and state priority. Students, foremost, need schools to be in operation so that they can continue making progress after significant time out of the classroom. Many parents are also counting on schools to reopen so that they can get back to work. Targeting relief funds towards reopening schools would be another step in supporting Ohio’s students and families during these difficult times.

It’s no secret that the national debate about reopening schools has been heating up. State and federal policymakers, teachers and administrators, and education advocates of all stripes have been deliberating two sets of guidance, one from the Centers for Disease Control (CDC) and the other from the American Academy of Pediatrics (AAP). Both groups have the health and safety of students and staff at top of mind, but their recommendations differ.
In the midst of these discussions, Governor DeWine unveiled Ohio’s guidance for schools to reopen. The long-awaited plan covers health and prevention guidelines aimed at protecting students and staff, as well as a planning guide to help schools respond to the new academic and operational realities of attending school in the midst of a pandemic. There is CDC guidance sprinkled all over the health and prevention guidelines. And the planning guide explicitly notes that if schools cannot meet the state’s health guidelines, “they should continue remote learning until they can.” But the health guidelines also note the AAP’s assertion that “schools are fundamental to child and adolescent development and well-being.” In short, Ohio has pursued middle ground, incorporating aspects of each set of guidance.
The state also struck a balance between requirements, strongly worded recommendations, and local flexibility. Some of the health guidelines are required, as evidenced by words like “must,” while others are merely suggestions. In terms of academics and operations, there are virtually no concrete expectations from the state. Overall, most of the decision-making power in both areas has been left up to local leaders. Here’s a look at a few of the big takeaways.
Health and safety
The health and safety guidelines for schools are divided into five sections: assessing and tracking symptoms, washing and sanitizing hands, cleaning school environments, spacing students out via social distancing, and wearing facial coverings. Each section contains several links to CDC resources and scientific research, and most of the guidelines are common sense. For instance, schools must provide hand sanitizer in high-traffic areas, such as building and classroom entrances. Staff must clean surfaces frequently and pay particularly close attention to high-touch areas and shared materials. And if students or staff begin to show symptoms, they must immediately be separated from others and referred to a healthcare professional or a testing site.
Recommendations around social distancing, on the other hand, appear to be more suggestive in nature. The document notes that social distancing is “key” to preventing the spread of Covid-19, but it doesn’t say that schools must practice it. Instead, staff and students “should try when possible” to practice social distancing. Busing is a good example—school officials “should endeavor to do the best they can to keep social distancing on buses,” but it’s not a requirement. That’s a big deal because requiring social distancing on buses would have made transporting students almost impossible logistically. It also means that one of the primary methods used to reduce transmission isn’t required.
The most strongly worded guideline relates to facial coverings. School staff, including volunteers, must wear a mask while on site. There are some exceptions, but the guidelines warn that schools must be prepared to “provide written justification to local health officials upon request” to explain why a staff member isn’t wearing a mask. When it comes to students, though, the state has opted to defer to schools. Schools must establish a face-mask policy for students, but the contents of that policy are up to local leaders. Despite this flexibility, the guidelines strongly recommend that students in third grade and above wear a mask unless they are unable to do so for health or developmental reasons. And although the guidelines recognize that students being transported via buses “are at an increased risk for transmission,” the state stops short of requiring students to wear masks while riding them. Instead, it is “strongly recommended.”
Academics and operations
The state’s planning guide focuses on four guiding principles: caring for the health and well-being of students and staff, prioritizing student learning, ensuring effective teaching, and operating efficiently, effectively, and responsibly. The bulk of the state’s recommendations for health and safety can be found in the separate guidance document outlined above. But the planning guide also contains some important provisions worth mentioning. For instance, the state calls on schools to provide age-appropriate instruction to students on health and safety practices and for employees to receive similar training. The Ohio Department of Education (ODE) and the Ohio Department of Health have vowed to make general training resources for school personnel available soon.
Unlike the health and safety guidelines, which contain several musts, the “return-to-school considerations” are not mandatory. Operational decisions about the use of space and time have been left up to local leaders. For example, it’s up to schools how to group students during the day; where and when to use buildings (including on nights and weekends); whether they will offer classroom-based, remote, or personalized learning (or some combination of all three); and whether to alternate the days students attend school in person to maintain social distancing. The state recommends—but does not require—that schools provide remote learning all year, “as many families will have higher-risk health concerns and/or may not feel comfortable with in-person instruction until a vaccine is available.”
Attendance tracking will also change. The health and prevention guidance notes that though schools must monitor daily absences for trends, “sick leave and absence policies should not penalize staff or students for staying home when symptomatic or in quarantine.” The planning guide, meanwhile, recommends that schools “consider a measure that encourages consistent attendance or consistent participation” rather than perfect attendance, particularly as some families may not be comfortable sending their students back to school.
In terms of academics, the planning guide contains a considerable amount of flexibility. For instance, diagnostic testing is described as a crucial part of understanding where students are and what kind of support they need. ODE plans to provide resources for teachers that are based on released state test items. But it’s up to districts to decide if, how, and when they want to assess their students. The same is true for the content students will be taught. Despite emphasizing that the commitment to Ohio’s learning standards “must continue to be strong,” schools will be able to decide whether they want to “support a more focused or streamlined curriculum” that emphasizes “the most essential concepts” in any given subject.
Flexibility also extends to issues such as grading, grade promotion, remediation, student discipline, and services for subgroups such as students with special needs, English-language learners, and gifted students. Rather than set clear academic expectations that all schools must follow, the guide offers an “essential questions” checklist that schools should review. Questions include the following: “How will you ensure inclusion of students with disabilities and meeting their needs (academic and physical)?,” “Are you using assessment data to create individual English learner plans with specific goals, especially to mitigate learning loss?,” and “What happens to students who do not comply with safety procedures?” The answers to these and other questions are entirely up to local leaders, with no clear-cut expectations from the state (though it’s worth noting that there are additional resources available for certain topics, such as English learners and social emotional learning). Such a heavy emphasis on flexibility is understandable. In Ohio, the impacts of the pandemic range widely from school to school and region to region. But with virtually zero academic expectations from the state, there is a high likelihood that achievement gaps and other inequities will grow.
To be fair, the guide does emphasize the important of assessing and addressing the needs of vulnerable youth. It notes that equity challenges “have been recognized in education for some time, yet the pandemic is revealing and exacerbating deeply rooted social and educational inequities.” Unfortunately, though, the guide doesn’t offer schools many concrete examples of how to ensure that equity is prioritized or achieved. Instead, it identifies sweeping approaches such as ensuring “cultural relevancy and student choice” and working to “recognize the manifestations of implicit bias and eliminate or overcome it.” These are worthy suggestions, to be sure. And it’s possible that the state didn’t include concrete examples for the same reason it didn’t mandate decisions on remote learning—local leadership and implementation efforts are key. Nevertheless, schools have a tall task ahead of them in dealing with the academic fallout of this pandemic. Concrete examples, resources, and expectations are crucial.
***
The upshot of all this is that although the planning guide and health guidelines are useful and important for school leaders, they aren’t particularly helpful in determining what school will look like in the fall. The real answers about how schools plan to manage health risks and mitigate learning losses will be found in local, school-specific plans. In the coming weeks, students, families, and educators will need to pay close attention to the reopening plans that are proposed by their schools.

Enacted in 2012, Ohio’s (well-named) Third Grade Reading Guarantee aims to ensure that children can read proficiently by the end of third grade. The legislation calls for interventions when students struggle to meet early literacy benchmarks, and it includes a requirement that schools retain third graders who do not meet targets on state English language arts exams or an alternative assessment. At the bill-signing ceremony, former Governor John Kasich captured the logic behind the law saying, “If you can't read you might as well forget it. Kids who make their way through social promotion beyond third grade, when they get up to eighth, ninth, tenth grade…they get lapped, the material gets too difficult.”
Despite the vital importance of early literacy, the reading guarantee has faced significant pushback from the start. Critics have attacked the policy as an “unfunded mandate,” and they’ve assailed the retention provisions as a form of punishment. The latter argument was recently echoed by a state board of education member who justified her opposition to raising the promotional score on third grade state exams by saying, “I don't think that anyone should be punished more than they already are being punished.”
What the critics seem to forget is the data showing that third grade tests scores are highly predictive of later outcomes. Kasich was right. Children who have difficulty reading early in life are going to face immense challenges in middle and high school—and likely into adulthood. That’s the real punishment.
The most influential report showing the link between early literacy and later outcomes is a 2011 Annie E. Casey Foundation study by Donald Hernandez. His work is based on the National Longitudinal Survey of Youth which tracked nearly 4,000 children born between 1979 and 1989 until age nineteen. That survey collected data on third grade reading scores on the Peabody Individual Achievement Test and high school graduation.
The results are startling. Non-proficient readers in third grade are four times more likely to fail to graduate than their peers who read proficiently. The odds of dropping out rise among non-proficient Black and Hispanic students who are a staggering eight times more likely to not graduate from high school.
Hernandez’s study tracked students who were in elementary school during the 1980s and ‘90s. Perhaps the link between early literacy and later outcomes has dissipated in more recent years. Or maybe state exams aren’t very good predictors of later outcomes.
In comes a new study by the University of Washington’s Dan Goldhaber and Malcolm Wolff and EdNavigator’s Timothy Daly, which shows that third graders’ state test scores still strongly predict high school outcomes. Their analysis relies on student data from Massachusetts, North Carolina, and Washington State that allow them to track academic progress from grades three through twelve between 1998 and 2013.
They find that lower third grade math and reading scores are associated with significantly lower high school math scores (results in English aren’t reported), less participation in advanced coursework, and lower rates of high school graduation. In terms of exam outcomes, the authors put the results this way: “All else equal, a student at the lowest percentile of the third grade math test distribution rather than the highest percentile is expected to be 48–54 (depending on state) percentile points lower in the high school math test distribution.” Depressingly, the relationship between third grade results and high school outcomes is nearly as strong as eighth grade scores, suggesting that very little “academic mobility” occurs between third and eighth grade.
To illustrate the pattern visually, the figure below, taken from their report, displays the link between students’ third grade test scores on the x-axis and their likelihood of graduation on the y-axis. As is evident from the data points at the far left of the chart, students scoring in the lowest deciles—the first and second, especially—on third grade exams have much lower probabilities of high school graduation. For instance, for low-income students, defined by students’ eligibility for free and reduced-priced lunch (FRL), a widely used proxy for student poverty, the odds of graduation among those scoring in the lowest decile on third grade reading exams are about 0.70. That’s below low-income students who scored in the fifth decile, whose probability is just over 0.80, and far lower than high-achieving low-income third graders.
Figure 1: Probability of Graduation by third grade test score decile and FRL
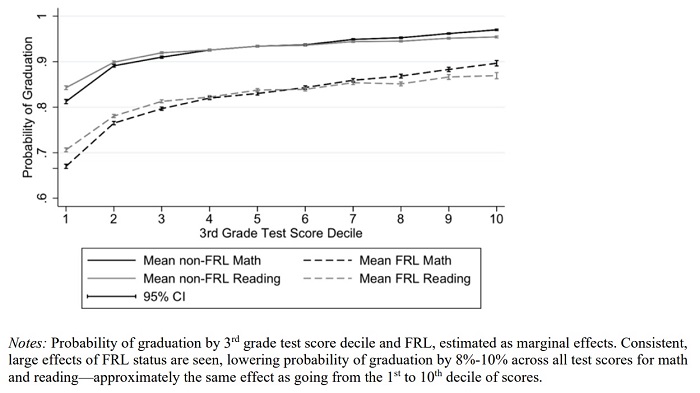
Source: Dan Goldhaber, Malcolm Wolff, and Timothy Daly, Assessing the Accuracy of Elementary School Test Scores as Predictors of Student and School Outcomes, CALDER (May 2020).
Goldhaber and colleagues sum up their analyses with the powerful conclusion (emphasis added):
[E]arly student struggles on state tests are a credible warning signal for schools and systems that make the case for additional academic support in the near term, as opposed to assuming that additional years of instruction are likely to change a student’s trajectory. Educators and families should take third grade test results seriously and respond accordingly; while they may not be determinative, they provide a strong indication of the path a student is on.
State and local leaders in Ohio should heed the advice of these researchers and take third graders’ test scores seriously. This will be all the more important in the coming year, as students return to school having lost academic ground after being out of the classroom for an extended period. Although state retention provisions were waived for last year’s third graders due to the pandemic, schools must still step in and ensure that struggling readers receive the time and help needed to read proficiently. As the data indicate, these students can’t afford to get lost in the shuffle—a real possibility in the remote and blended-learning environments that schools are likely to use next year. Some critics will continue to wrongly decry such interventions as punitive. But let’s all remember that these steps are no punishment, but rather an investment in a child’s future.

The coronavirus pandemic has upended many facets of K–12 education but not the regular surveys of public school teachers and principals conducted several times annually for the RAND Corporation’s American Educator Panels. The spring 2020 surveys provide the first nationally representative data from both teachers and principals regarding their experiences teaching, leading, and learning during the chaos of pandemic-mitigation closures and the pivot to remote learning. These data—from district and charter teachers and principals—were obtained in late April and early May. There were 1,000 complete responses out of 2,000 invitations for teachers and 957 complete responses out of 3,500 invitations for principals. No information is given as to the breakdown of charter or district school respondents. The key topics surveyed were distance learning and curriculum coverage, perceptions of school challenges and needs, school and teacher contact with families and students, teacher training on remote instruction, teachers’ needs for additional support, and priorities and plans for the summer and next school year.
Consistent with other reported data on this ever-changing topic, the RAND Corporation researchers find that while almost all schools required students to complete distance learning activities, teachers reported wide variation in curriculum coverage and approaches to monitoring student progress. Approximately 80 percent of teachers reported requiring students to complete assigned learning activities, although only one-third were issuing letter grades for students’ work. No data were obtained on the types of teaching (synchronous/asynchronous) or curricular materials (worksheets/online lessons/virtual classroom lectures) provided. Of the teachers who responded, 17 percent were monitoring work completion but providing no feedback on it. These findings diverge depending on grade levels. More elementary teachers reported providing no feedback than did secondary teachers, but far more secondary teachers reported assigning letter grades than did elementary teachers. The researchers speculate that these differences could simply reflect prepandemic variation in feedback and grading processes. One could imagine that the long-standing pressures of GPA calculations and graduation requirements might drive a continuation of traditional grading for high schoolers even in a time of otherwise radically altered grading paradigms.
Just 12 percent of teachers reported covering all or nearly all of the curriculum remotely that they would have covered during the year in person. Overall, more than 25 percent of teachers at all grade levels and school types reported that the content they taught was mostly review, with a smaller amount of new content. Nearly 24 percent reported an even split between new content and review. However, teachers in high-poverty schools (those in which at least 75 percent of students qualified for free or reduced-price lunch) were more likely to have devoted most of their curriculum to review relative to counterparts in low-poverty schools and schools with a majority of white students. Teachers in schools defined as “town or rural” were most likely (30 percent) to report teaching content that was all or almost all review.
Students lacking high-speed Internet and/or devices were top of mind for principals responding to the question of factors limiting the provision of remote learning. Both items showed up as specific survey responses, but the digital divide was also likely at play in other reported concerns, such as equitable provision of instruction and difficulties communicating with families. It is interesting to note that nearly 39 percent of principals also reported lack of teacher access to adequate technology as a major or a minor limitation. This, also, was more pronounced in town or rural schools.
A majority of teachers—62 percent—indicated that they had received at least some training on how to use virtual-learning-management platforms and technology. However, a far lower percentage of teachers indicated receiving training on other distance-learning topics such as equal accessibility of remote lessons for all students, differentiating lessons to meet individual student needs, engaging families in at-home learning, and providing opportunities that support students’ social and emotional well-being. As far as supports teachers need going forward, nearly 45 percent of teachers said that strategies to keep students engaged and motivated to learn remotely was a major need, followed by strategies to address the loss of hands-on learning opportunities such as labs and internships (just under 29 percent).
Going forward, principals anticipate that they will prioritize emergency preparation for ongoing pandemic disruption, eliminating academic disparities, and boosting students’ social-emotional health when their schools reopen in the fall. As to concrete actions to address these and other future concerns, over 40 percent of principals anticipated that their schools or districts would take one or more of the following actions during the new school year: providing tutoring (58 percent), changing grading or credit requirements for grade promotion (48 percent), modifying the school-day curriculum to help students catch up (47 percent), providing supplemental online courses to help students catch up (45 percent), partnering with out-of-school organizations to provide resources to families and students (43 percent), and providing a stand-alone summer program (42 percent).
Conducting research in the midst of a pandemic is somewhat akin to reconstructing Pompeii while the ash is still falling, but these data from the front lines of education are a vital step toward building knowledge of the moment. What we learn now about how this crisis was addressed will be a vital part of the story going forward.
SOURCE: Laura S. Hamilton, Julia H. Kaufman, and Melissa Diliberti, “Teaching and Leading Through a Pandemic: Key Findings from the American Educator Panels Spring 2020 COVID-19 Surveys,” RAND Corporation (June 2020).

Editor’s Note: The Thomas B. Fordham Institute occasionally publishes guest commentaries on its blogs. The views expressed by guest authors do not necessarily reflect those of Fordham.
Like most states and regions, Ohio and Colerain Township have felt serious impacts from the COVID-19 pandemic. While our governor and his team received praise for their decisive early actions, certain businesses and industries may have a tough road back from resulting economic losses; for some, the return could be a long one. While businesses start to re-open, it is unclear where they are going to find the skilled workers they need.
Even before the pandemic, Ohio faced a massive skills gap. To compete effectively in the global economy, about 65 percent of Ohio adults would need to have a post-secondary credential of some kind, such as a four-year degree, an associate’s degree, or a certificate or credential for an in-demand occupation.
Currently, Ohio sits at 45.5 percent of adults earning such a credential, ranking us 31st in the nation and behind several nearby states.
That simple, yet sobering fact is the centerpiece of a recent brief from ReadyNation, an organization of over 2,700 global business leader members, myself included. Frustrating the progress toward closing our skills gap, many programs are unsure how they will be able to offer hands-on training in this new age of social distancing. That is a particularly urgent problem because the current health crisis has shown just how crucial these workers in many essential and front-line industries are.
For example, health care workers are often trained in programs requiring a certain amount of time spent outside the classroom in clinical settings. Likewise, there is increasing demand for logistics and supply chain management, as anyone who has gone grocery shopping lately can attest. Yet, these programs are also struggling to offer hands-on training in certain areas. Ohio is home to large, nationally-recognized organizations in both the health care and logistics fields, with those skills in great demand.
Fortunately, the ReadyNation brief also offers solutions, calling for increased investment in three policies Ohio has adopted that have helped address these problems. They are TechCred, OCOG, and Choose Ohio First.
The ReadyNation brief also calls attention to the significant earnings advantages for skilled workers. This shortage of available workers comes at a high cost for individuals, businesses, and the economy. Ohioans with a bachelor’s degree also out-earn by more than $20,000 per year those who only have a high school diploma, at $52,656 compared to $30,708.
With more than half of Ohio’s jobs being “middle-skill” jobs that require more than a high school diploma but less than a bachelor’s degree, it is crucial to encourage both younger people and working adults seeking to re-tool their skills to consider an associate degree, certificate, and credential programs. These usually require less time to complete than a bachelor’s degree, which in return offer higher wages and oftentimes increased benefits than jobs requiring only a high-school diploma. Individuals who have attained some post-secondary education credits may work with advisers that can help parlay those previous classroom experiences and certifications as partial progress towards completion; this can save both individuals and employers even more time and money.
The bottom line is that Ohio faces a significant workforce skills gap that compromises our ability to compete in the global economy. This was true before the pandemic, and as we emerge from it, we will need to work together—employers, educators, and people of all ages—with greater focus on retooling and reinvesting in important human resources.
This piece was originally published on the ReadyNation blog.

Editor’s Note: The Thomas B. Fordham Institute occasionally publishes guest commentaries on its blogs. The views expressed by guest authors do not necessarily reflect those of Fordham.
Author’s Note: The School Performance Institute’s Learning to Improve blog series typically discusses issues related to building the capacity to do improvement science in schools while working on an important problem of practice. Now, however, we’re sharing how the United Schools Network, a nonprofit charter management organization based in Columbus, Ohio, is responding to the Covid-19 pandemic and planning educational services for our students during school closures.
As schools consider how to restart in the fall, some are galvanizing their community to consider this an opportunity for reinvention, a way to rethink how we educate our young, while others simply want to get students back in the building and return as quickly and safely as possible to the normal that existed prior to the pandemic. Regardless of a school’s position on the spectrum from restart to reinvention, a more sophisticated manner in which to analyze student engagement and track efforts to improve engagement will be necessary.
In prior blog posts, my colleague John A. Dues explored the idea that successful remote learning requires a whole new system, especially because many teachers were accustomed to in-person teaching and had no prior experience with teaching students from afar through a computer. I followed up with some thoughts on defining student engagement by creating operational definitions for key remote learning concepts (like engagement) and then using those definitions to inform data gathering. Finally, John discussed the use of Process Behavior Charts (PBCs) to better understand and analyze student engagement data, and how to use a basic knowledge of variation to avoid common pitfalls of under- and overreaction to these data. Let’s pick up the conversation there.
Inspired by the legendary management consultant W. Edwards Deming and the esteemed statistician Dr. Donald J. Wheeler, Mark Graban, in his book Measures of Success, proposes three key questions that organizations must consider when using data to drive improvement:
1. Are we achieving our target or goal?
a. Are we doing so occasionally?
b. Are we doing so consistently?
2. Are we improving?
a. Can we predict future performance?
3. How do we know we are improving?
a. When do we react?
b. When do we step back and improve?
c. How do we prove we’ve improved?
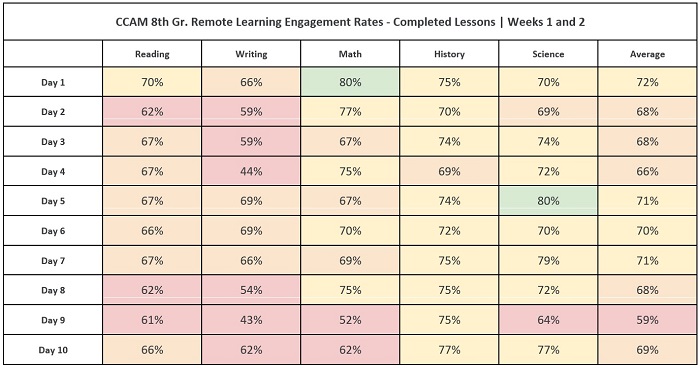
The engagement data we collected from Columbus Collegiate Academy-Main Street during the first two weeks of remote learning is displayed in the table below. Our operational definition for engagement is: “A USN middle school student demonstrates engagement in a remote lesson by completing the accompanying practice set in its entirety.”
Let’s apply Graban’s key questions to the data table.
1. Are we achieving our target or goal? We set our target as 70 percent engagement, considering we were beginning a brand new system of instruction and faced significant barriers to successful implementation (internet connection, access to devices, etc.). It appears that we are hitting 70 percent engagement in some classes on some days.
a. Are we doing so occasionally? Yes.
b. Are we doing so consistently? It is hard to tell from the data. While the color-coding draws attention to specific numbers, it is hard to tease out patterns in the data presented in this way. In addition, the color-coding, which corresponds to our grading scale, does not easily communicate achievement of our target (70 percent is still in the “yellow”).
2. Are we improving? It is hard to tell from the data. The simple list of numbers makes it difficult to identify patterns.
a. Can we predict future performance? Not from the data presented in this manner.
3. How do we know we are improving? We do not know if we are improving.
a. When do we react? We cannot know by presenting the data in this way.
b. When do we step back and improve? We cannot tell by presenting the data in this way.
c. How do we prove we’ve improved? We cannot prove we’ve improved by presenting the data in this way.
The table above is a start, and certainly better than not collecting and examining the data at all. The colors allow you to quickly obtain a very broad picture of remote learning engagement. More green is good, more orange/red is bad. However, the data, as presented in this way, cannot speak to improvement. A Process Behavior Chart (PBC) is a better option.
The PBC below takes data in a table and, by “plotting the dots,” allows you to see change over time in a more efficient manner—like a run chart on steroids. While the details on creating PBCs are beyond the scope of this blog post, I’ll quickly review what we see below.
The red lines are the upper and lower limits. You should expect engagement percentages to fall within these limits based on the data set. The green line is the mean (or average), and the blue dots are the engagement percentages for the given day. This PBC, for eighth grade math specifically, is telling us that we can expect remote learning engagement to fall between 47 and 85 percent on any given day, with a mean engagement rate of 66 percent.
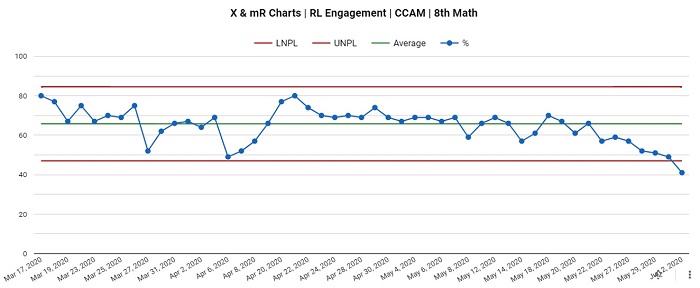
Graban proposes ten key points when utilizing PBCs to make data-driven decisions. Most importantly, he states that we manage the process that leads to the data we see above, not the data points themselves. We can spend hours blaming people for metrics we do not like, but that time is largely wasted. In the context above, the “voice of the process” is telling us that, if we don’t do a single thing to change the system, we can expect similar results moving forward—daily engagement between 47 and 85 percent. If we do not like the limits or the mean, we need to go to work on the process. Furthermore, we must understand the basic reality that variation exists in every data set; if we react to every “up and down” (called “noise”), we will likely burn out and miss actual signals in the data that we can use to improve. Why did engagement increase 8 percent from March 19 to March 20? Who knows? This is likely unknowable, and not worth further exploration. So when do we react?
In order to better analyze the PBC above, let’s apply Graban’s three rules:
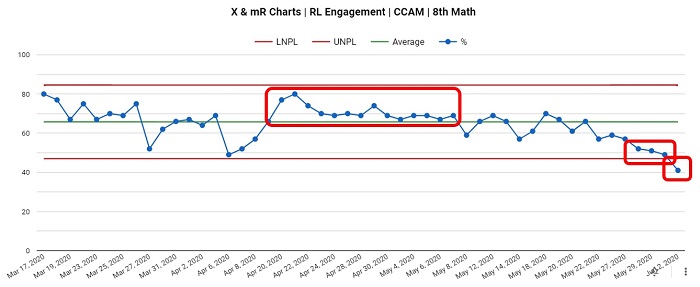
As demonstrated above, we see one example of each rule in our 8th grade math remote learning PBC. We can use this learning to modify the PBC to make it easier to determine next steps on the path to improvement.
Below, after recognizing the “run of 8” that indicated engagement was increasing for a sustained amount of time, we adjusted the limits and mean for that specific chunk of time. Interestingly, the start of this improved period aligned with our return from spring break. We then adjusted the limits and mean after a sustained period of improvement when we detected a downward turn. Thus, a PBC that began as a singular, predictable system with wide limits has been redefined to a system with three distinct periods of varying engagement. An initial stage of highly-variable engagement (which makes sense, considering remote learning was brand new to everybody) gave way to a period of increased engagement (possibly due to students and teachers becoming accustomed to the new reality), and finally a period of decline as we approached the end of the school year.
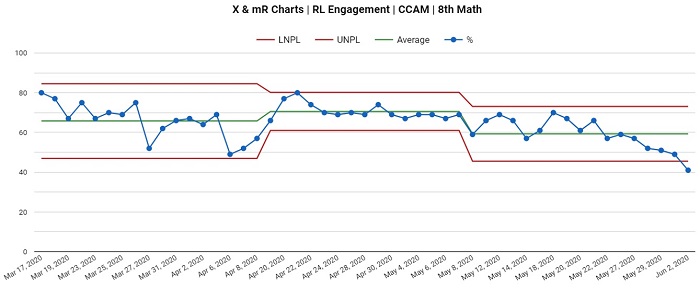
One can imagine how schools could utilize PBCs to make more informed decisions on interventions, either proactively or retroactively. At USN, like many schools, we had to adjust to remote learning extremely quickly, and therefore did not have the time or bandwidth to track interventions with as much sophistication as we would’ve liked. However, let’s simulate how we could utilize PBCs moving forward, especially in light of the fact that remote learning, in some form, may continue into next year.
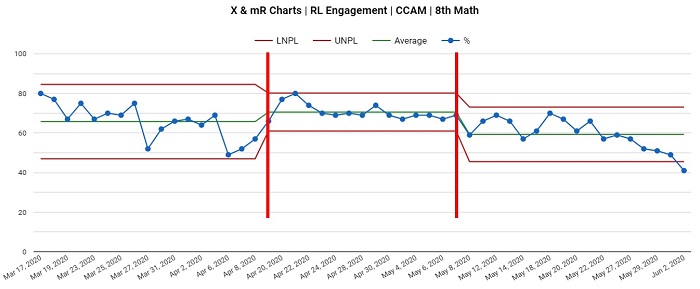
Eighth grade math experienced two significant shifts this spring in the remote learning context. Looking backward, with the goal of improving remote learning next year, we could ask ourselves: What was different between April 20 and May 7? Was the teacher texting students daily to remind them to complete assignments? Did we improve the way in which instructional materials were organized in Google Classroom to make it easier for students to find and complete them? Along the same lines, we see another unique system between May 8 and the end of the school year. What about our system changed that led to decreased engagement? At times, these questions may be difficult to answer, but when we detect a signal (remember the three rules above), it’s time to grab our shovels and dig.
This approach works proactively, as well. For example, we can pretend that today’s date is April 8, and we’re planning an intervention such as eighth grade teachers will text every student every day to remind them to complete their remote assignments. We collect daily data, and post-intervention, we note increased engagement. We now have data to demonstrate that this intervention shows promise! Conversely, pretend that today’s date is May 8, and we’re planning another intervention to try to increase engagement even more. We might ask eighth grade teachers to plan twice-weekly Google Hangouts to provide support to students who sign on. We collect the data for a few weeks and, unfortunately, the intervention does not lead to improvement. Moreover, average engagement decreased. While that’s a bummer, we still learned something. Above all, it’s vital to note that the focus is on the process—the changes we introduce to the system to improve it—not the people.
As a final step, let’s revisit our three key questions once more using the PBC instead of the table of numbers.
1. Are we achieving our target or goal? As a reminder, we set our target as 70 percent engagement. On average, we are not achieving our goal in the subject of math, with the exception of a two-week period following spring break.
a. Are we doing so occasionally? Yes.
b. Are we doing so consistently? No.
2. Are we improving? We are not improving. We experienced a period of improvement following spring break, but that was followed by a period of decline toward the end of the school year.
a. Can we predict future performance? We currently have a stable system with the exception of one signal on the last day of school. We can predict that engagement will vary between 45 percent and 73 percent, with a mean of 59 percent, unless something substantial shifts in our system.
3. How do we know we are improving? We can apply Rules 1, 2, and 3 to the PBC to separate signals from noise and determine if, and when, improvement occurs.
a. When do we react? We can react after we see a “run of 8” in the data, signaling an improvement in the system. We also reacted upon examining a Rule 2 later on that signaled a decline in engagement.
b. When do we step back and improve? After a period of improvement in mid-April to early May, we ended the year with a period of decline. We can use this learning to think about designing a better remote learning system next school year.
c. How do we prove we’ve improved? In this particular data set, we can prove we improved for a period in mid-April to early May as indicated by an increase in the mean engagement.
At SPI, we have much to learn about using PBCs in the field of education. However, we believe there is tremendous power in examining and acting on data in this way. We spend less time overreacting to (or underreacting to) common day-to-day variation, and more time improving the system and verifying the outcomes of interventions. Whether remote or in person, this type of data analysis will certainly help guide us in making smart decisions during an uncertain time.