Voucher critics are at it again
It’s been a banner year for private school choice in Ohio.

It’s been a banner year for private school choice in Ohio.




It’s been a banner year for private school choice in Ohio. Senate Bill 89, which became law this spring, wisely decoupled the state’s EdChoice Scholarship Program from school report card ratings and expanded eligibility to more middle-income families. The state budget built on these improvements by creating a new school funding model that directly funds choice programs, expanding eligibility provisions even further, and increasing scholarship funding amounts.
These changes are a big win for everyday Ohioans who are searching for the best educational fit for their children. But for public school advocates who view choice as a threat, the state’s actions appear to represent yet another harbinger of doom. Their disdain for EdChoice, in particular, is clear in their comments from a recent piece published by the Columbus Dispatch, which purports to take a look at how vouchers gained popularity in Ohio. Amidst the history lesson there are some inaccurate, misleading, and downright troublesome assertions made by voucher critics. Let’s take a look at three of the most egregious.
Claim 1: Private school scholarships drain money from public schools
This is one of the most common arguments against private school choice—and choice more generally—so it’s no surprise that it shows up in the Dispatch piece. In fact, the total cost of educational vouchers during the 2021–22 school year (approximately $628 million) is referenced more than once. Ohio Federation of Teachers president Melissa Cropper even goes so far as to say there is “something wrong” with the state spending so much. She adds: “Even though the money might not be directly taken from a school district right now, there is still only so much state money allocated for education.”
It’s true that the state has a finite amount of money to devote to education. But acting as though EdChoice carries a burdensome price tag that taxpayers wouldn’t have to shoulder if vouchers disappeared isn’t accurate. If a student opts to attend a private school using an EdChoice scholarship, the state money designated for that student simply follows them to the school that’s doing the work of educating them. That’s how student-centered funding works. Moreover, taxpayers don’t pay more when students use vouchers. In fact, for years, Ohioans have actually saved money when students use a voucher. That’s because voucher amounts add up to far less than the overall taxpayer support required to educate a student who attends a district school. Even with scholarship amounts increasing under the new budget, vouchers will still be funded at far more modest amounts than the statewide average per pupil expenditure.
It’s also unfair to claim that voucher programs rob districts of money. First and foremost, no school—district, charter, private, or otherwise—is entitled to students. Families have the right to choose where to send their children to school, and schools are allocated money based on students they actually teach, not students they could have taught. To do otherwise would be to prioritize systems—one specific system—over students.
Second, it’s important to remember that schools are funded by state and local dollars. On average, 45 percent of elementary and secondary public school revenues are from local sources. For the most part, these dollars aren’t tied to student enrollment. Districts receive tax payments from their residents regardless of whether those residents have children that attend the district. And contrary to widespread claims that school choice results in lost funding, Ohio data show that per-pupil funding actually increased between 2000 and 2019 in districts where charters and private schools have historically been the most prevalent.
Finally, although districts’ complaints about losing money might have been understandable when the state funded voucher programs through deductions to districts’ state aid, that’s no longer the case. The recently passed state budget included a complete overhaul of the school funding formula. As Cropper noted above, money is no longer “directly taken” from districts. There is, quite literally, no loss of funding for districts when a student opts to use a voucher.
Claim 2: School choice is at odds with improving public schools
This is another anti-choice talking point that’s mentioned in the Dispatch. The piece notes that the “thorough and efficient system of common schools” promised by the Ohio Constitution is a mandate to “fix” underperforming public schools. The underlying implication is that rather than paying for families to “escape” to private schools, we should be focusing all our money and attention on improving public schools. This is always framed as an either/or. Policymakers and advocates can either focus on improving traditional public schools, or they can focus on expanding choice programs. They can’t do both.
But that’s a false dilemma. There’s no reason that traditional public schools can’t improve and thrive alongside private and charter schools. In fact, one of the great arguments in favor of choice is that it can spur change and innovation in nearby districts. Cleveland is proof positive of that. The district was recently named one of the fastest-improving school districts in the country. It is one of only three districts in a nationwide sample that succeeded in improving from negative to positive NAEP impacts between 2009 and 2019. And all of this was accomplished despite the fact—or perhaps because of the fact—that Cleveland students have had access to private school scholarships since 1995 plus a burgeoning charter school sector. A portfolio of school options can breed competition between different types of schools, but it can also lead to collaboration if adults are willing. In either case, students benefit. That’s all that should matter.
Claim 3: If parents want their children to attend private schools, they should pay for it
This argument makes an appearance courtesy of Senator Teresa Fedor, who told Dispatch reporters: “I went to private schools, I taught at private schools, I sent my son to a private school, and it was by my choice...I did not expect the public to pay for it.”
There’s a lot wrong with this way of thinking. First and foremost is the Senator’s assumption that, just because she can afford to attend and send her children to private schools, everyone in Ohio can. But according to the 2021 State of Poverty in Ohio report, nearly 3.5 million Ohioans—more than three out of every ten—live below 200 percent of the federal poverty line. That translates to an annual income of $53,000 for a family of four. Meanwhile, average private school tuition in Ohio clocks in at just over $7,000. Without assistance from the state, low-income parents with two kids would need to spend more than a fourth of their annual income just to afford private school tuition. Spending that much isn’t feasible.
Of course, Senator Fedor and others would argue that every Ohio student has access to free public schools. And that’s true. But free doesn’t always equate to good. Consider Toledo, which is part of the district that Senator Fedor represents. On the 2018–19 report card (the last report card with graded components), Toledo Public Schools (TPS) earned an F in achievement and a D in progress. Value-added grades for students with disabilities and the lowest-performing 20 percent of students were F’s. And the four-year graduation rate was only 79 percent compared to the state average of 85 percent.
Parents of students in TPS could wait for the district to turn itself around and improve. That is, after all, what voucher opponents advocate for when they say that state leaders should focus on improving public schools rather than giving families access to other options. But what if families—families just like Senator Fedor’s—aren’t willing to risk their child’s future on a potentially empty promise that their neighborhood school will suddenly improve? Districts like TPS have nearly a decade of poor report card results under their belts, in addition to high remediation rates and low ACT and SAT scores. What if families dare to want something better for their children now?
Unlike their senator, most Toledo parents can’t afford to pay private school tuition. Of the nearly 23,000 students TPS educates, 87 percent are considered economically disadvantaged. The median household income in Toledo is just below $38,000, which means the average annual private school tuition bill would amount to almost a fifth of a household’s annual income. Moving to a nearby district is likely out of the question, considering the average home price in neighboring, higher-performing districts like Perrysburg ($274,877) and Ottawa Hills ($333,571). Open enrollment isn’t an option either, since most of the districts that surround TPS have closed borders. There are charter schools, of course, but seats are limited.
The upshot? Without private school scholarships, lower- and middle-income families who want a different or better option are out of luck. That seems like a problem Senator Fedor should be working to solve. Instead, she’s calling for these programs to be eliminated or scaled back.
***
When it comes to debates over school choice, misrepresentations are nothing new. Given the wide variety of choice-friendly provisions in the budget, it’s not surprising that the establishment is hitting back. But the complaints refuted here—and several others that appear unchallenged in the Dispatch piece—are inaccurate at best. Ohioans deserve better.

Over the past year, raucous debates have erupted over school reopenings, masking in classrooms, and critical race theory. At the same time, multiple studies, both nationally and in Ohio, have revealed significant learning declines throughout the pandemic. Given these unsettling dynamics, now would be a good time to focus attention on core academics. Minding these basics might cool some of our most heated arguments, as people on all sides of the political spectrum can readily agree that children need to master the “three R’s.” More importantly, anchoring our energies on academics is likelier to benefit students than some of the other items of fervid interest.
Setting clear goals would be a wise first step towards regaining such a focus. The good news is that Ohio now has results from the spring 2021 assessments that can inform goal-setting. These baseline data allow state and local leaders to set clear academic targets, rally public support to meet them, and track progress moving forward.
Setting goals is always as much art as science. As policy wonks know, education leaders have sometimes struggled to set ambitious but achievable goals. And with the pandemic ongoing, it’s especially hard to predict what’s next. Will we see a quick bounce-back in test scores in spring 2022? Could proficiency continue to stagnate, given the ongoing challenges of education during a pandemic?
Despite these difficulties, Ohio should create sensible achievement targets to aim at. Based on where students stand today and historical trends, state leaders should set a goal that student proficiency return to pre-pandemic levels by 2025—in both English language arts and math, and in every grade level. That could drive a sense of urgency about the recovery, without being naive about the challenges in schools, while also working to avert a “lost generation” of students who perform at levels below their recent peer groups.
What would it take to meet this goal? To start, let’s look at the data. Figures 1 and 2 show Ohio’s math and reading proficiency rates, respectively, in selected grades. The “Covid slide” is clearly evident in both charts. In third grade math, for instance, 67 percent of students met the state’s proficiency bar in 2018–19, the year immediately prior to the pandemic. Last spring, just 56 percent scored proficient or above. Bear in mind that these proficiency rates likely overstate the “real” rate, as test participation fell to roughly 85 percent statewide, with less advantaged students more likely to have missed the test.
Figure 1: Statewide proficiency rate on selected math exams

Figure 2: Statewide proficiency rate on selected English language arts exams

Source: Ohio Department of Education
The dotted lines show the progress needed to achieve pre-pandemic proficiency rates within four years. In math, statewide proficiency would have to increase by an average of about 3–4 percentage points annually to reach this goal. In reading, the necessary rates of improvement in grades five and seven are smaller—about 1–2 percentage points each year—though in third grade, proficiency rates fell rather sharply and larger improvements are needed. Again, as noted above, all this may somewhat underestimate the progress required, as proficiency rates may have been lower had all students taken tests in 2020–21. Still, it’s important to note that Ohio has registered annual increases in proficiency rates of 5 or 6 percentage points (and more) in previous years.
Another way to think about this goal is to consider estimates of learning declines that have occurred during the pandemic. According to a recent analysis by Ohio State’s Vlad Kogan and Stéphane Lavertu, the average Ohio student lost about one-third to a full year of learning depending on grade and subject. That would seem to imply that, if the typical student makes 1.10 to 1.25 years of progress moving forward, proficiency rates would largely return to pre-pandemic levels in four years. Again, that amount of progress isn’t unprecedented. Research, for instance, finds that, in normal circumstances, effective charter schools contribute the equivalent of an extra quarter or more “years of learning.” Moreover, with the flood of federal dollars flowing into public education, Ohio schools should quite literally be giving students extra learning time—more than the usual 180 days per school year—and access to as much additional teaching and tutoring as is available.
Whether it’s two, three, or four years that is deemed the “right” target, policymakers ought to set a clear and specific goal that can energize the state’s academic recovery efforts. Similarly, local districts could likewise set targets for their own schools. Ohio could easily crush the goals I’ve proposed. If so, all for the better. Or maybe the state will fall a bit short, which would let policymakers and the public know that more work is needed just to get back to square one. In the end, thousands of Ohio students have gotten knocked off track. They’re the ones most counting on adults to focus the public’s attention on the task at hand.

NOTE: The Thomas B. Fordham Institute occasionally publishes guest commentaries on its blogs. The views expressed by guest authors do not necessarily reflect those of Fordham.
Traditional public schools are accountable, right? I mean, everyone says they are, so it must be true.
And yet, when you probe deeper and start asking tough questions about how the funding flows, how these schools are governed, and what all that testing data mean, you might just reach a different conclusion.
To wit, in our 2021 Schooling in America survey, we at EdChoice asked a nationally representative sample of Americans to estimate the amount of money their local public schools spend each year. To say that they were “off” in their guesses is like saying that Paul Krugman was “off” when he said that the internet would be no more important to the economy than the fax machine. It’s true, but it understates the magnitude.
The median respondent to the survey estimated that American schools spend $7,000 per student. The median school parent thought it was $5,000. On average, schools spend over $13,000 per student per year in current expenses alone, with some states spending more than $20,000 before capital expenses are taken into account. In total, 77 percent of the general population and 81 percent of the school parents we surveyed underestimated how much schools spend.
One of the reasons for the prevalence of this poor understanding is that school spending is opaque and is allowed to be that way. It is very difficult to determine just how much a school spends on the students that it educates. Schools, districts, and states have put up myriad barriers between taxpayers and schoolhouses. There is not uniform agreement as to what spending categories should “count” when it comes to calculating per- pupil expenditures, and the same district will publish multiple numbers in different outlets.
This matters because a vast, nationwide, systematic underestimation of what schools spend tempers every public discussion about schools, what they are doing, and what they should be doing. We shouldn’t be surprised if folks cut schools some slack when they believe that they’re getting half or a third of the funding that they actually are. And if we don’t know how much is being spent—or how dollars are being used—we cannot ensure that the money is well spent.
In my new paper, The Accountability Myth, I pull this string, and others, to argue that even though a vast superstructure of ostensible accountability policies has been erected, it doesn’t actually hold schools or the people that work in them accountable in any meaningful sense of the word.
Take school boards, for example. School boards are supposed to provide democratic accountability, and lots of conservatives like to hold them up as bastions of small-“d” democracy. They don’t, and they aren’t. School board elections are low- turnout affairs usually conducted “off- cycle” to depress participation. School boards do not represent the views of the populace because only a tiny minority of the community participate in their election. What they do represent are the views of motivated and resourced interest groups, who are able to swing small elections in their favor.
Meanwhile, pop the hood on most state accountability systems and you’ll find a Rube Goldberg device of byzantine data points and “consequences” that seem designed to neither clearly display what a school is doing nor do anything should that school fail to meet performance goals. Don’t believe me? Take a gander at Ohio’s ESSA plan and let me know if you can make heads or tails of it. And that was before the pandemic gave states an excuse to take an accountability holiday.
Despite these realities, public school advocates often insist that we cannot give parents a more diverse set of options because “public schools are accountable and private (or charter) schools are not.”
That argument is doubly wrong. Private schools are more accountable than traditional public schools. Parents have far more skin in the game when they have the opportunity to actively choose their child’s school. They are able to vote with their feet and leave if they are not satisfied. Private schools are more responsive to the needs of the children that attend them because they have to be.
The first part of their statement is false, too. Public schools are not held accountable either democratically, financially, or educationally. We know this because we can see the turnout numbers of local school board elections and look on what days they are held; we can survey parents about how and how much their schools are spending and see that they are completely in the dark; and we can try and make heads or tails of school accountability systems and find loophole after loophole. In all cases, we find little evidence that these mechanisms are doing what advocates say that they are.
The myth of public school accountability creates a barrier between families who desperately want more options and an intransigent system that wants to deny them. It needs to be busted.
Michael Q. McShane is director of national research at EdChoice.

A recent, state-level report from the National Alliance for Public Charter Schools (NAPCS) seeks to shed some light on how many families made a school change during the pandemic. Comparing enrollment numbers from various states can be difficult as each jurisdiction has its own reporting protocols. For the sake of this analysis, NAPCS used statewide enrollment figures that were either generated or verified by state education agencies. Seven states—Kentucky, Montana, Nebraska, North Dakota, South Dakota, Vermont, and West Virginia—don’t have charters and thus were not included. Two states that do have charters, Tennessee and Kansas, were excluded due to missing or unusable data. That left forty-two states, including the District of Columbia, with usable data.
The findings indicate that, from 2019–20 to 2020–21, charter enrollment increased while traditional public school enrollment decreased. Charter schools gained nearly 240,000 students, a 7 percent increase. Other public schools, meanwhile, suffered a 3.3 percent loss to the tune of more than 1.45 million students. All forty-two states saw decreases in public district school enrollment, but only Illinois, Iowa, and Wyoming saw drops in charter school enrollment.
In terms of percentage changes between 2019–20 and 2020–21, four states had charter enrollment increases over 20 percent: Oklahoma (nearly 78 percent), Alabama (65 percent), Idaho (24 percent), and Oregon (20 percent). Decreases in district school enrollments were much smaller and ranged from 0.1 percent in Missouri to 6.9 percent in Oklahoma. Fordham’s home state of Ohio fell somewhere in the middle on both counts. Charter enrollment in the Buckeye State rose by 11 percent, while district enrollments dropped by almost 4 percent. In Arizona, an 8 percent increase in charter enrollment combined with a 6 percent drop in district enrollment was enough to make it the first state other than D.C. to have 20 percent of its public school students enrolled in charter schools.
Examining the absolute numbers brings a few other states to the foreground. Oklahoma is still the top charter enrollment gainer with an increase of nearly 36,000 students. But four other states also had significant surges: Texas (29,030 students), Pennsylvania (22,696), Arizona (18,429), and California (15,283). Drops in district enrollment were much larger. California’s district schools lost the most students—a whopping 175,761—and Texas wasn’t far behind with a loss of 151,393. Twenty-one states saw district enrollment losses of more than 25,000 students.
The researchers didn’t conduct a school level analysis, but they did find that, in some states, charter growth was primarily driven by enrollment in virtual schools. Oklahoma, for example, gained tens of thousands of new charter students thanks in part to virtual enrollment. But that wasn’t the case everywhere. Texas had the second largest number of new charter students, but its growth wasn’t attributable to full-time virtual schools. The maturity of a state’s charter sector didn’t seem to affect charter enrollment, either. Some of the nation’s most mature sectors, like D.C. and Louisiana, had only modest growth, while other mature markets like New York posted significant gains. It’s also worth noting that, although we don’t yet have new school openings data for 2020–21, it’s reasonable to assume that fewer startups opened their doors during the pandemic. If that is indeed the case, families seem to have maximized what was available.
Overall, the authors were careful to note that it’s still too early to draw any firm conclusions about why enrollment in charters increased. But one thing is for certain: Charter schools continue to be a critical part of the public school ecosystem, and the pandemic made them even more so.
Source: Debbie Veney and Drew Jacobs, “Voting with Their Feet: A State-level Analysis of Public Charter School and District Public School Enrollment Trends,” National Alliance for Public Charter Schools (September 2021).

Is it possible to reduce the number of out-of-school suspensions experienced by Black students in America by means of a small tweak in school practices, such as adding a simple activity to some school days? As improbable as it may sound, a new research paper provides evidence that one such intervention can shrink the number of suspensions by at least half.
A team of researchers, replicating an earlier experiment, added a “self-affirmation writing exercise” to the school day for two successive cohorts of seventh graders in Wisconsin’s Madison Metropolitan School District. More than 2,140 pupils were asked to complete a writing exercise during class with neither teachers nor students aware of the details of the experiment. Half the students were female, 53 percent were White, 19 percent were Black, 17 percent were Hispanic, and 11 percent were Asian. Those in the (randomly-assigned) treatment group were given a list of values, items, and attributes (such as friends, family, sports, and creativity) and asked to choose three that were most important to them. Then they were asked to explain why each was important to them. They were given no time or word limit and were assured that no aspect of what they wrote—length, spelling, grammar, etc.—would be graded. Control group students received the same criteria and freedoms but were given a “neutral, nonaffirming” exercise which asked them to choose three items from the list that were not important to them personally but to explain why they might be important to others. Students who were not part of the study were given an unrelated but similarly-structured writing task, the results of which were not analyzed.
The research team looked at the numbers of suspensions recorded for treatment and control students across the three years of middle school in Madison—sixth, seventh, and eighth grades—and controlled for what they term “outlier cases,” or the handful of students with excessive numbers of suspensions.
Their first analysis showed a half-of-a-suspension per year reduction for Black students in the treatment group, approximately 50 percent less than the average pre-treatment rate. Non-Black students in the treatment and control groups experienced no statistically significant changes in their suspension rates, leading to a reduction in the Black-White suspension gap for treatment group students of approximately two-thirds. Positive effects were even stronger among Black students who had experienced higher numbers of suspensions in sixth grade (i.e., pre-treatment). Results were similar the following year when students were no longer actively participating in the intervention.
Further analysis compared treatment and control group students for lesser disciplinary actions such as being sent to the principal’s office. Here, again, there was significant gap closing. Unfortunately, the study recorded no positive academic impacts associated with lower suspension rates, though this was not a major focus of the research design.
The stated goal of the self-affirmation writing exercise was to “help students access positive aspects of their identities less associated with troublemaking in school”—such as being a family member, enjoying sports, being creative, or having a sense of humor. This makes sense in the abstract, but the mechanisms by which the writing exercise induced these effects cannot be determined from the available data. In fact, it is unclear from the report whether teachers read the students’ written responses to the exercises, which could be a pathway to reducing race-based stereotyping of students in the first place. It must also be reiterated that the most-disruptive students were excluded from the analysis so the results apply only to the occasionally-disruptive, occasionally-misbehaving middle schoolers. The researchers properly note that identifying the mechanisms should drive further investigation.
But the findings are striking for such a simple intervention. How simple? The writing exercises were given just three times in each school year. Pencils, paper, and one hour of time spread out over seven or eight months—even doable virtually. It’s hard to get much simpler than that. Why wouldn’t schools want to jump on this even while the mechanisms at work here are being evaluated?
SOURCE: Geoffrey D. Borman, Jaymes Pyne, Christopher S. Rozek, and Alex Schmidt, “A Replicable Identity-Based Intervention Reduces the Black-White Suspension Gap at Scale,” American Educational Research Journal (September 2021).

Most agree that America must increase the racial and socioeconomic diversity of its selective high schools and colleges, as well as participation in its top professions. Yet debate rages over how best to achieve that praiseworthy goal. In K–12 education, the impulse has often been to relax standards or even give up on notions of academic excellence or giftedness in the name of equity and inclusion. While this approach appeals to some, it risks lowering the ceiling, holding back many young people who are ready to zoom ahead, and in the long run, diminishing the country’s competitiveness.
A surer approach is to increase the supply of top-notch education offerings in order to help more high-potential kids from disadvantaged backgrounds compete successfully with others of the nation’s best and brightest. That’s a tall order and one that U.S. education has long struggled to achieve. Studies by Johns Hopkins professor Jonathan Plucker and others have documented stark “excellence gaps” between high- and low-income pupils. A groundbreaking analysis of patent data by Harvard’s Raj Chetty and colleagues revealed that high-achieving children from low-income backgrounds rarely become inventors—what they call America’s “lost Einsteins.”
We at the Thomas B. Fordham Institute have also sounded the alarm about a meritocratic ladder with missing rungs and too narrow a top, as well as the inadequate attention given by U.S. schools to academically talented children. In 2011, we released a study that examined a national sample of third-grade high-achievers and found that a sizable number “lost altitude” by eighth grade. More recently, we published an analysis showing that Black and Hispanic students participate in gifted programs at lower rates than their peers (a phenomenon we termed the “gifted gap”). Our team also published a book showing that, while Black and Hispanic students have been participating in larger numbers in Advanced Placement classes, their passing rates on AP exams show the effects of weak preparation in elementary and middle schools.
Despite widespread exposure of these problems and valiant efforts by advocates, our nation’s most-able students continue to be overlooked—and if they come from poorer homes and neighborhoods the overlooking is almost certain to be worse. According to the National Association for Gifted Children, twenty states don’t even bother to report the number of students identified as gifted, twenty-three states fail to provide any funding for gifted education, and thirty-two states do not require universal screening for giftedness. At the federal level, the sole program dedicated to supporting gifted students is the tiny Jacob K. Javits Gifted and Talented Students Education Program.
Our home state of Ohio has gotten a couple of key policies right. For one, it has long required school districts to identify students as gifted and talented using a broad definition and a variety of metrics. More recently, the Buckeye State adopted a universal screening policy for giftedness. Ohio incorporates measures of achievement and growth among gifted students in its school accountability system, and it provides modest funding for identification and services. All good, as far as they go. But are they enough?
We decided to dig deep into the outcomes of high-achieving students in Ohio. How are smart kids there doing? Are they staying on top from elementary through high school? Are most of them acing their college exams and heading to four-year universities? Do we see disparities by race and socioeconomic status, even among students who had done well on their third-grade exams? And what about being formally identified as gifted—does that provide an extra boost?
To examine these questions, we turned to Scott Imberman of Michigan State University, a first-rate economist whose work includes a widely-cited study on the effects of gifted programs. We’re pleased to present his comprehensive study, Ohio’s Lost Einsteins: The inequitable outcomes of early high achievers, which relies on Ohio’s longitudinal databases containing anonymous student-level records. The focus of his analysis is the academic trajectory of the state’s “early high achievers,” defined as students who scored in the top 20 percent on third-grade exams in math or English language arts (ELA).
The first part of the report documents the basic outcomes of these early high achievers. Regrettably—but consistent with previous national studies—we see “excellence gaps” emerge by economically disadvantaged status and for Black students.
Figure A: ACT test participation (top) and 4-year college enrollment (bottom) among early high achievers
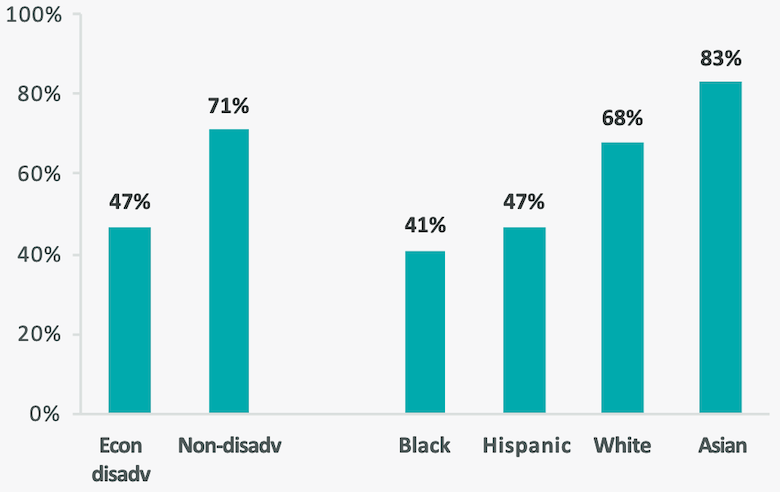
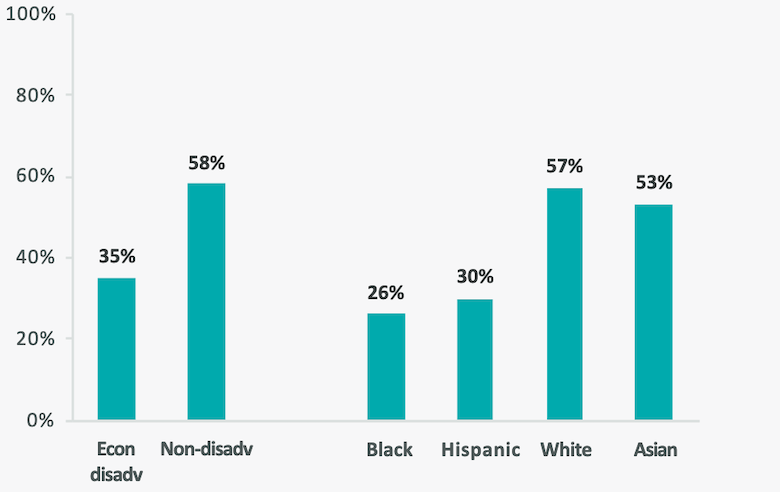
The report then turns to questions of gifted identification. Here we see that fewer than half of Ohio’s early high achievers are formally identified as gifted by eighth grade, reflecting either a high bar for identification or perhaps uneven application of the criteria for identification.[1] Thus, the terms “early high achiever” and “gifted student” are not interchangeable—and the raw outcomes data show that those high achievers who are identified as “gifted” outperform their non-identified peers.
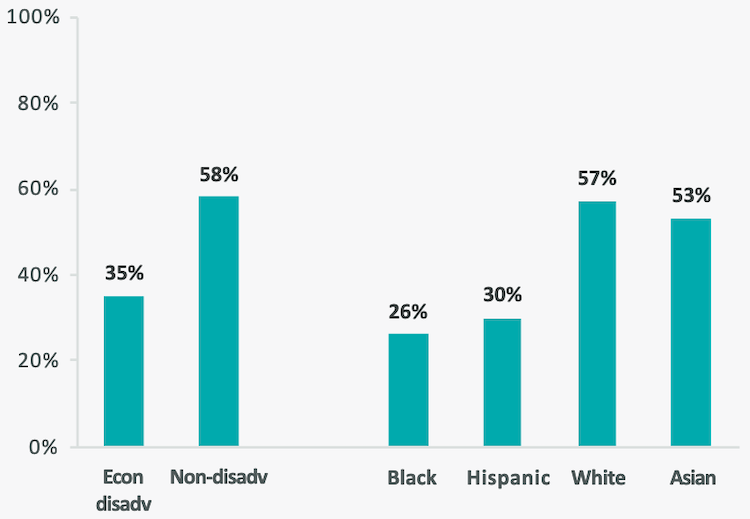
Economically disadvantaged and Black students were less likely to be identified. By eighth grade, 34 percent of economically disadvantaged high achievers were identified as gifted, compared to 53 percent of their nondisadvantaged peers. Meanwhile, 30 percent of Black early high achievers were identified as gifted versus 52 percent of White and 71 percent of Asian high achievers. Note that, during the period of this analysis, Ohio did not have a universal screening policy—that changed in 2017—possibly explaining some of the disparity in identification rates.
Figure B: Gifted identification by grade 8 among early high achievers
Rigorous causal analyses indicate that gifted identification itself provides a small boost to early high achievers from all backgrounds on state math and ELA exams, but the gains are more substantial for Black students, particularly in math. Though not causal evidence, Black high achievers who are identified as gifted outperform non-identified Black high achievers on ACT and AP performance and college-going outcomes.
Due to data limitations, this study cannot answer questions about whether receiving gifted services drove the results—Ohio does not mandate such services, just identification—or even which specific types of service benefitted children most. The state does not produce systemic data about the sorts of gifted services that students receive—if indeed they receive them—so we don’t know whether gifted students are mostly receiving meager hour-a-week “enrichment” or more intensive programming with specialized curricula and classrooms. What happens after a student is identified remains hidden inside a black box.
Nevertheless, it’s clear from the research—this study included—that more needs to be done on behalf of America’s high achieving kids, especially those from low-income backgrounds. What to do? Start by placing the needs of high-ability kids on the policy agenda. Consider just a few starter ideas:
—
Thousands of early high-achieving children—including smart kids of poor and working-class parents from places like Cincinnati, Dayton, and Mansfield, Ohio—are drifting their way through middle and high school. They don’t end up taking AP exams, achieving high marks on their ACTs, or going to four-year colleges, as one might expect. This not only limits these kids’ opportunities to move up the social ladder, but also threatens the nation’s economic competitiveness and derails our aspirations for a more just society where children from all backgrounds can become inventors, doctors, and business leaders. Rather than buying into the false assumption that high-achieving kids will do fine on their own, we need to do a better job of making sure that all high achievers, including those from low-income backgrounds, get the education they deserve.
[1] To be identified as gifted in math, students must score at the ninety-fifth percentile or higher on an approved nationally normed test; the same bar applies for identification in reading, science, and social studies. Slightly different criteria apply for identification in superior cognitive ability, visual or performing arts, and creative thinking, the remaining categories of giftedness in Ohio. For more on Ohio’s gifted identification policies and practices, see Ohio Department of Education, Assessments Approved for Gifted Identification and Prescreening (2021).