In fall 2022, the Ohio Department of Education released state assessment results from the 2021-22 school year. The data continue to reveal the massive learning losses that occurred during the pandemic, along with the uneven recovery in its wake. This report offers a close look at Ohio's achievement data from the 2018-19 to 2021-22 school years, and concludes with four recommendations that can help accelerate student learning across the Buckeye State. Download the full report or read it below.
Executive summary
Too many Ohio students are academically adrift. Without serious help, many will falter when trying to tackle college or launch careers. This situation has existed for decades, but it’s worse today—far worse—due to the pandemic. Consider just a few alarming numbers from the 2021–22 state assessments. Compared to 2018–19, just prior to the pandemic, statewide math proficiency rates are down ten percentage points in fourth and sixth grade and down fourteen points in eighth grade. Proficiency rates in high school algebra and geometry exams are down twelve and eight points, respectively. Reading proficiency rates, while recovering in fourth and sixth grade, are down five points in both eighth grade and high school.
The declines are steeper among economically disadvantaged students, students with disabilities, English learners, and Black and Hispanic students—thus widening achievement gaps that were already unacceptable before the pandemic hit. Compared to 2018–19, the math proficiency rate of economically disadvantaged students slid by fourteen percentage points in grades 3–8—a larger decline than nondisadvantaged students (ten points). Math proficiency rates for Black and Hispanic students in those grades fell by thirteen points, while rates decreased by ten and eight points for White and Asian students, respectively.
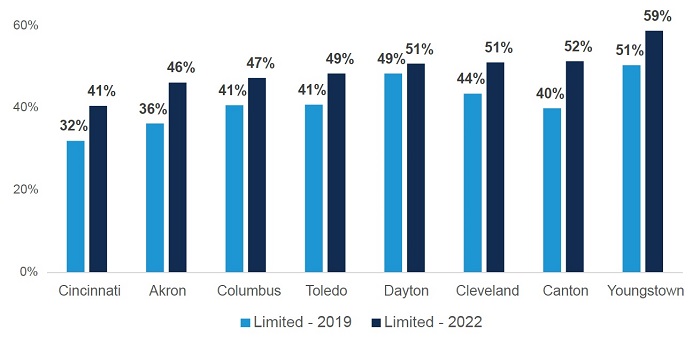
Plummeting proficiency rates translate into larger numbers of students with severe math and reading deficiencies. According to the Ohio Department of Education (ODE), students scoring at the “limited” achievement level—the lowest mark on state exams—demonstrate “minimal command” of grade-level standards. Stated bluntly, students in this category are failing academically, and unless they receive swift and serious help, they are on a pathway to functional illiteracy and innumeracy. Yet alarming percentages of Ohio students are now scoring at this level. In the Big Eight urban districts, about one in every two students—roughly 90,000 students—were “limited” in 2021–22.
Figure ES-1: Percentage of students scoring “limited” on state exams in Big Eight districts
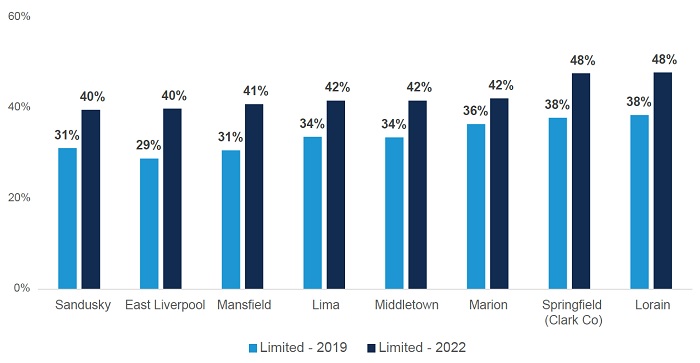
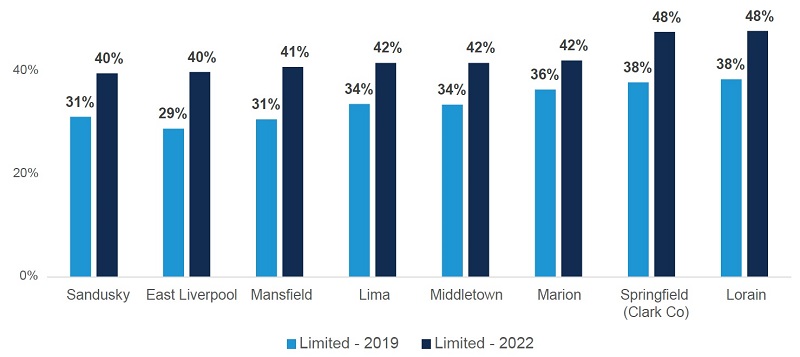
Academic catastrophe is not just a “big-city problem,” either. Figure ES-2 indicates that more than two in five students in midsized districts such as Middletown, Marion, Springfield, and Lorain scored at the lowest achievement level on state exams last year. And statewide, about one in four Ohio students—some 400,000 children—are now struggling to grasp even the most basic grade-level concepts.
Figure ES-2: Percentage of students scoring “limited” on state exams in selected midsized districts
Ohio is not alone, of course, in racking up terrible Covid-related learning losses, but the bad news keeps coming.[1] Last October, just a month after the release of state exam results, came the release of the 2022 results from the National Assessment of Educational Progress, a.k.a. the “Nation’s Report Card.” These test data reveal yet again the massive learning losses among students in Ohio and across the nation. It also indicated that Ohio’s Black and Hispanic students fared even worse than their national counterparts during the pandemic.[2]
This situation can be reversed but only if state and local leaders push for aggressive recovery efforts in Ohio schools. There is some evidence that students made more academic progress in 2021–22 than in a typical pre-pandemic year, likely reflecting schools’ ramped-up efforts to remediate learning losses. Progress, however, has been uneven: older students seem to be recovering at slower rates than their younger peers, and progress in math has been more muted than in reading.
Ohio still has much work ahead to ensure that the state’s Covid generation gets back on track. This report concludes with four policy recommendations that could bolster these efforts. They include ideas that aim to directly address the impacts of the pandemic (e.g., tutoring and summer school), as well as broader reforms that would strengthen the state’s K–12 education system as a whole and support higher achievement across Ohio.
Here’s the short version, with more detail to be found starting here.
- Provide parents with more timely information about their child’s achievement on state exams.
- Insist on strong quality measures for state-administered tutoring and summer school grants, while prioritizing programs that serve older students and those from less-advantaged communities.
- Require schools to use evidence-based curricula and support implementation through reimbursements for high-quality instructional materials and professional development.
- More effectively allocate state dollars to support low-income students through more accurate identification.
***
Everyone knows the tumult and setbacks brought on by the Covid-19 pandemic. Businesses closed, schools were shut, and millions of Americans “sheltered in place.” Far too many took ill and died. Yet even without schools to attend—and often slipshod experiences with the online replacements—time ticked on for Ohio students. The vast majority will still end their high school journey—ready or not—at the age of eighteen. Therein lies the challenge. Can Ohio restore to those learners what they lost while schools were closed and their lives were disrupted? Of course it can. But will it? The answer to that question hinges on the actions of today’s leaders.
Where students stand academically, and their post-pandemic progress
In March 2020, with the pandemic bearing down on the entire nation, schools across Ohio shut their doors and struggled to shift to remote learning. State assessments scheduled for that spring were cancelled, and accountability policies such as school report cards were suspended. The disruptions continued into the fall, as schools dealt with the public health crisis in various ways—some offering only a remote option, others a hybrid model, and still others opening for full-time, in-person instruction. With most Ohio schools returning to a semblance of normalcy by spring 2021, the state restarted its annual exams and released test results (though it again paused report card ratings for the year).[3]
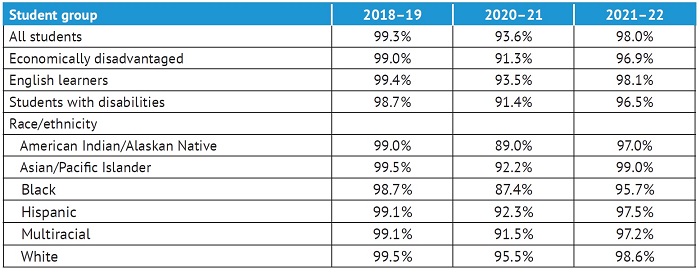
Test participation that year was spotty. As table 1 shows, 93.6 percent of Ohio students took exams in 2020–21, though rates were lower among economically disadvantaged, special-education, and Black students. Nevertheless, the assessments gave an early picture of the learning losses that had occurred. One study by Ohio State University professors Stéphane Lavertu and Vladimir Kogan estimated losses of one-third to a full year of learning, depending on grade level and subject.[4] Sharp declines in student proficiency rates were also visible (see figures 1 and 2 below).
By fall 2021, Ohio schools had reopened for in-person instruction. Participation in state assessments rose in 2021–22, almost reaching the near-universal rates seen prior to the pandemic. Statewide, 98 percent of Ohio students took state exams last spring, though slight differences in participation still appear by student group. The state also rebooted its school report card system and assigned school ratings, though it continued to suspend policies that require certain state actions as a result of poor performance on report card measures.[5]
Table 1: Statewide participation rates in state assessments, 2018–19 to 2021–22
Thanks to more accurate data from spring 2022 state testing, a clearer picture of where Ohio students stand academically—and how much progress is being made—has emerged. The following offers four takeaways.
Takeaway 1: Mixed recovery in student achievement
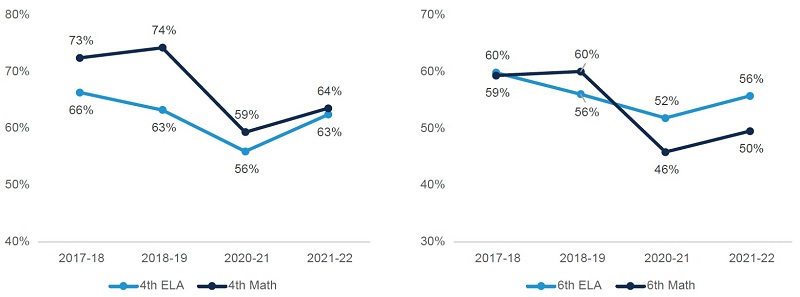
The latest data reveal a mixed picture of academic recovery in Ohio. In the earlier grades, there is some evidence of improvement post-pandemic. Figure 1, for instance, shows a fairly strong rebound in fourth- and sixth-grade English language arts (ELA) and math. In ELA, fourth- and sixth-grade proficiency rates in 2021–22 actually track closely with the pre-pandemic rates from 2018–19. Fourth- and sixth-grade math proficiency rates also increased relative to 2020–21 yet remain well below pre-pandemic levels.
Figure 1: Student proficiency in fourth- and sixth-grade math and ELA, 2017–18 to 2021–22
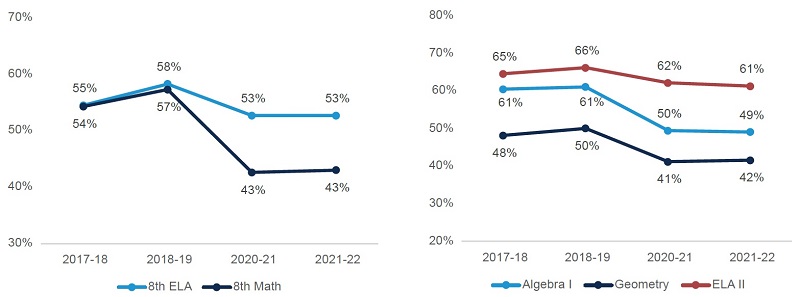
Unfortunately, recovery is stagnant in the higher grades. Figure 2 shows no gains in proficiency in eighth-grade math nor in ELA. Proficiency in both subjects remains well below pre-pandemic rates. There is also little evidence of recovery in high school. Proficiency on the state’s Algebra I and English II exams actually slid by one percentage point relative to 2020–21, while it ticked up just one point in geometry. On all three of these high school end-of-course exams, proficiency rates remain well below pre-pandemic rates.
Figure 2: Student proficiency in eighth grade and selected high school end-of-course exams, 2017–18
to 2021–22
Takeaway 2: Large and widening achievement gaps
For decades, education analysts have documented wide and worrying achievement gaps between disadvantaged students and their peers. While these gaps have slightly narrowed over time,[6] substantial disparities remained in the years just prior to the pandemic. In Ohio, for example, just 28 percent of economically disadvantaged students achieved proficiency on their eighth-grade exams in 2018–19, while 59 percent of their nondisadvantaged peers—more than twice the proportion—did so.
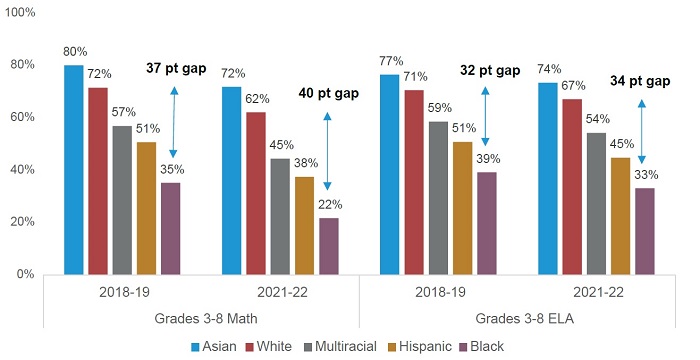
Disadvantaged students were at greater risk of serious learning loss during the pandemic. Their schools were more likely to stay closed longer, and many had fewer at-home resources to compensate. The figures below clearly show that the pandemic took a greater toll on Ohio’s neediest students, thus widening the preexisting achievement gaps. Figure 3 shows that the Black-White gap in third- through eighth-grade math widened from thirty-seven to forty percentage points between spring 2019 and spring 2022. The results are similar in ELA, with the Black-White gap growing from thirty-two to thirty-four percentage points in these grades (though not directly reported on the figure, the Black-Asian and Hispanic-Asian/White gaps grew, as well).
Figure 3: Proficiency rates in third through eighth grades by race/ethnicity, 2018–19 to 2021–22
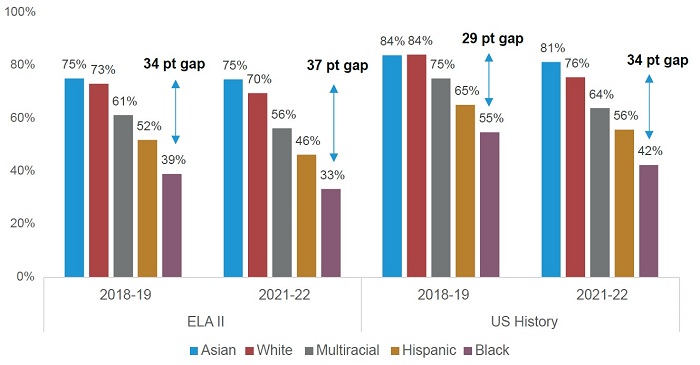
Similar gaps are seen in high school. On the two math exams, large gaps of thirty-five percentage points or more emerge between Black and White students, with the gap slightly widening in algebra but narrowing by one point in geometry. The achievement gaps on the high school English II and U.S. History exams are similar and grew by three and five percentage points in the respective subjects.
Figure 4: High school math proficiency rates by race/ethnicity, 2018–19 to 2021–22
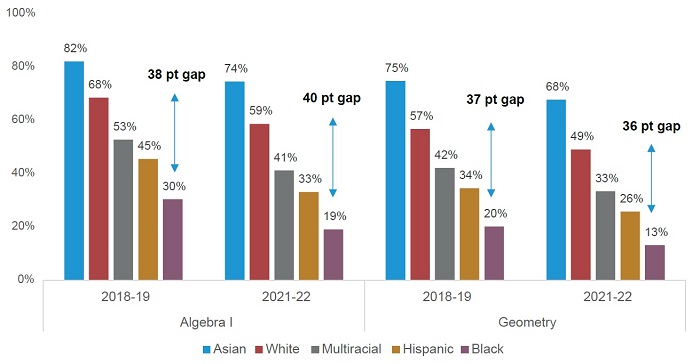
Figure 5: High school English and U.S. History proficiency rates by race/ethnicity, 2018–19 to 2021–22
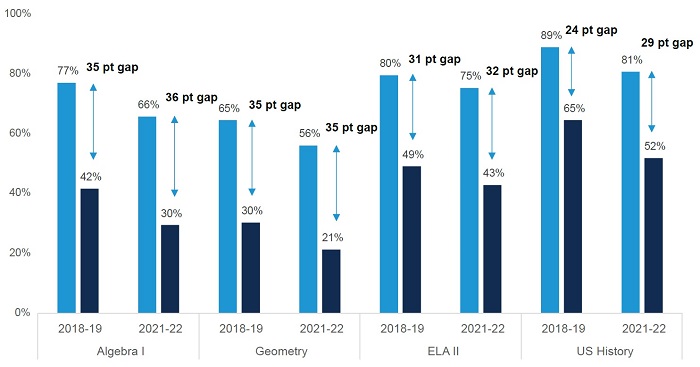
Large disparities in math and reading proficiency also exist between economically disadvantaged students and their nondisadvantaged peers. Figure 6 shows that differences in math proficiency by disadvantaged status grew by four percentage points in grades 3–8, while increasing by one point in ELA. Gaps in high school were unchanged to slightly wider, depending on the subject. Disparities by special-education and English-learner status are substantial and generally grew larger during the pandemic; those data appear in Appendix A.
Figure 6: Proficiency rates third through eighth grades by economic disadvantage, 2018–19 to 2021–22
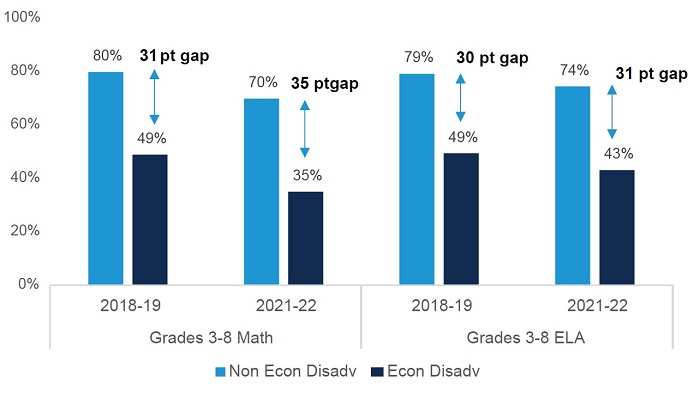
Figure 7: High school proficiency rates by economic disadvantage, 2018–19 to 2021–22
Takeaway 3: Severe academic challenges are widespread
Another way to look at the academic challenges facing Ohio is to examine the number of students who score in the lowest of the five achievement levels on state tests, which is somewhat politely called “limited.” Such students are clearly struggling to achieve even the most basic grade-level standards. ODE says they “demonstrate a minimal command” of grade-level standards, and this is the level reached by students who earn just 25 to 35 percent of the points possible on their state tests.[7] Without serious help and supports, students scoring at this level are highly likely to face functional illiteracy and innumeracy later in life.
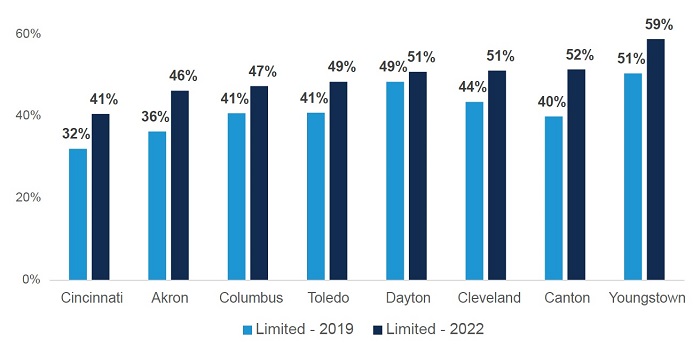
The problems in math and reading are greatest in Ohio’s high-poverty urban schools, but they are not confined to them. Figure 8 first shows the percentage of students scoring at the limited level in the state’s Big Eight districts. Prior to the pandemic, about two in five students in those cities scored at the “limited” level, but by spring 2022 that number had risen to roughly half. The highest rate of academic failure was in Youngstown, where a staggering 59 percent of students scored at this level, while Cincinnati had the lowest percentage (41 percent). With 182,000 students attending school in these eight districts, the data indicate that roughly 90,000 students are having serious difficulties achieving grade-level standards. And that, once again, is in just eight cities.
Figure 8: Students scoring “limited” on state exams, Big Eight districts, 2018–19 and 2021–22
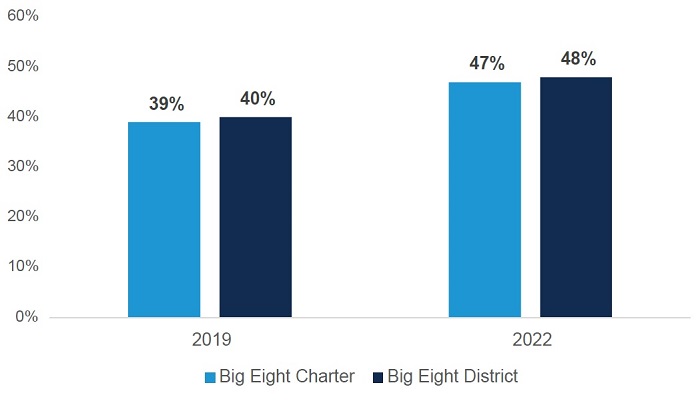
Growing numbers of low-achieving students are also enrolled in the public charter schools that operate in these cities. Figure 9 shows that nearly half of Big Eight charter pupils scored at the “limited” level in 2021–22, a percentage that tracks closely with their district counterparts.
Figure 9: Students scoring “limited” on state exams, Big Eight charter and district, 2018–19 and 2021–22
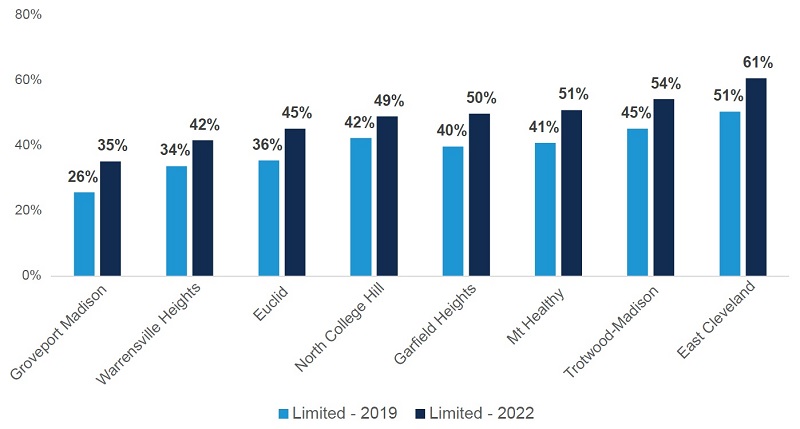
Serious academic deficiencies are also evident in Ohio’s inner-ring suburbs and higher-poverty small towns. Figure 10 shows the significant proportions of limited students in several districts surrounding Cincinnati, Cleveland, Columbus, and Dayton. In the 2,500-pupil district of Trotwood-Madison, for example, 54 percent of students scored at “limited” in spring 2022, while 61 percent of students in East Cleveland did so.
Figure 10: Students scoring limited on state exams in selected suburban districts, 2018–19 and 2021–22
Finally, we see that two in five students in several of Ohio’s small-town districts scored in the limited category last year. Forty-two percent of students in Lima, Middletown, and Marion scored at that level in 2021–22, while nearly half of those in Springfield and Lorain did so.
Figure 11: Students scoring limited on state exams in selected small-town districts, 2018–19 and 2021–22
Takeaway 4: Acceleration is uneven by grade, subject, and subgroup
Given the large learning losses discussed above, schools need to “accelerate” student learning faster than the pre-pandemic pace of academic growth. Such acceleration is especially critical for disadvantaged students who already face significant learning gaps and struggled most during the pandemic. But how fast did student learning grow from 2020–21 to 2021–22? Was it any faster than during pre-pandemic years? And are disadvantaged students making quicker progress than their peers?
To examine the “pace” of learning, we rely on an in-depth analysis of state assessment results that was published by Professor Vladimir Kogan of Ohio State University. His analyses, which track students’ learning trajectories over time, compare math and ELA growth from 2020–21 to 2021–22 to pre-pandemic growth rates between 2017–18 and 2018–19. Here’s what he found.
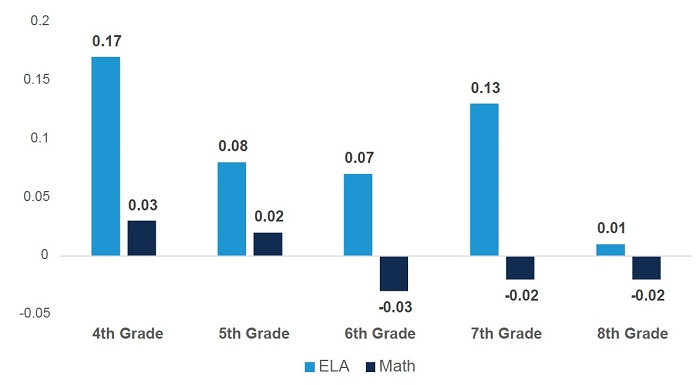
Figure 12 displays growth results by grade and subject in grades 3–8. Positive values indicate that students in a particular grade and subject made more growth from 2020–21 to 2021–22 than pre-pandemic cohorts; conversely, negative values indicate slower growth. On the positive side, students in grades 4–8 made more than typical progress in ELA. However, stronger-than-usual growth in math was less consistent, with slightly more than typical growth seen in grades 4 and 5 but less growth than usual occurring in grades 6–8. It’s hard to be sure what’s behind the stronger growth in the earlier grades, but it’s possible that greater participation in summer learning opportunities may be playing a role. Based on an analysis of third-grade test scores, which—unlike other grades—are administered in both fall and spring, Kogan suggests that the gains in that grade were made largely over the summer.
Figure 12: Annual growth from 2020–21 to 2021–22 versus pre-pandemic
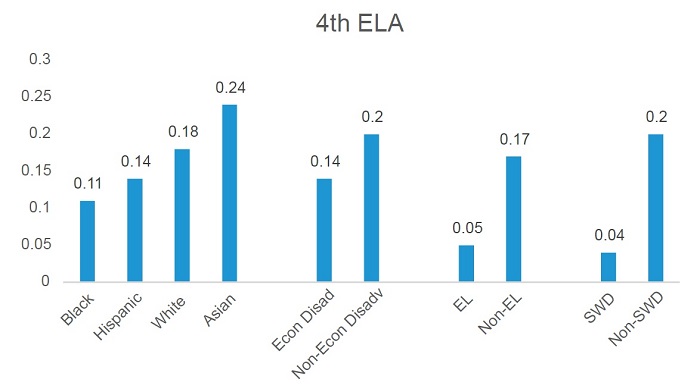
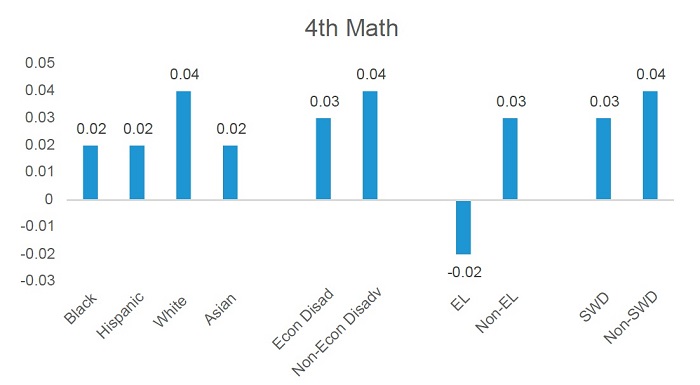
As for the achievement growth of historically disadvantaged students versus their peers, the results are somewhat disappointing. Looking at the fourth-grade data, for example, we see that disadvantaged students made somewhat less progress in both ELA and math than other student groups. Although disadvantaged students made more-than-usual progress last year, their nondisadvantaged peers posted even stronger gains.[8]
Figure 13: Fourth-grade annual growth from 2020–21 to 2021–22 versus pre-pandemic by subgroup
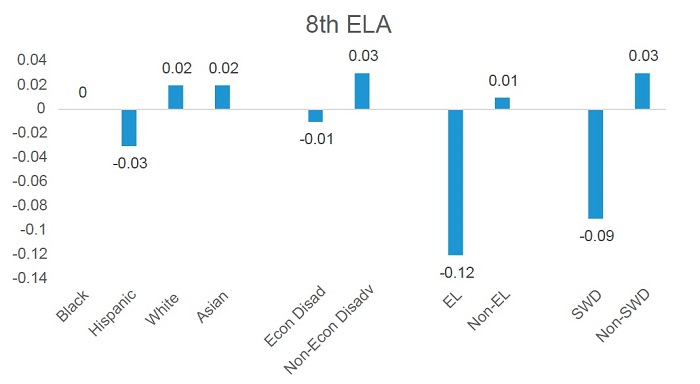
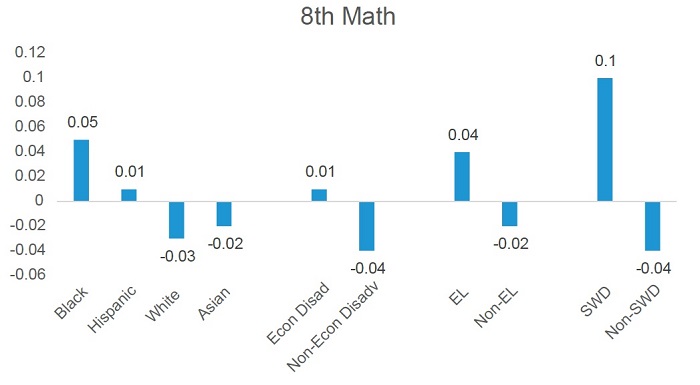
The results in eighth grade are more mixed. In ELA, historically disadvantaged student groups made less progress than their peers, but in math they made more progress.
Figure 14: Eighth-grade annual growth from 2020–21 to 2021–22 versus pre-pandemic by subgroup
Based on his analyses of the growth data, Kogan concludes as follows:
Unfortunately, there was no consistent evidence that student groups who suffered the most pronounced initial declines in the first year of the pandemic—particularly Black students, economically disadvantaged students, and those attending districts that remained remote the longest—have recovered any faster than their peers. In other words, the achievement gaps that expanded early in the pandemic largely remained last year.
In the end, the data are clear: Ohio students lost significant ground during the pandemic—and recovery remains too slow and uneven, with disadvantaged students struggling most to get back on track.
Conclusion and recommendations
Student achievement in Ohio suffered greatly during the pandemic. Remote education was mostly a disaster, and many schools and students lost their academic edge. Thankfully, schools have returned to normal, and some academic rebound is evident in the data. Yet the persistent learning losses, wide achievement gaps, and uneven post-pandemic progress call for policy actions that can ensure that all Ohio students get back on track. To move the needle faster, we offer four recommendations for state policymakers. The ideas include more targeted initiatives, such as increased use of high-dosage tutoring, that schools should implement to directly address the impacts of the pandemic, as well as broader reforms that would position Ohio’s overall K–12 education system for greater success over the long term.
- Provide parents with more timely information about their child’s achievement on state exams. Surveys indicate that parents are underestimating the pandemic’s impact on their child’s academic progress. One national survey found that more than 90 percent of parents in spring 2022 said their child is reading and doing math at or above grade level.[9] Given this misunderstanding—influenced by frequently inflated course grades given by teachers—it’s no surprise that another survey found lukewarm parent interest in tutoring or summer school.[10] State exam results provide essential, sometimes more candid, information for parents about their child’s academic standing. But these results aren’t useful if they arrive too late, aren’t easy to understand, or don’t make it home at all. To ensure parents receive information in a timely manner, lawmakers should require schools to either mail, or post in a secure online portal, students’ test-score reports by June 30th.[11]
- Insist on strong quality measures for state-administered tutoring and summer school grants, while prioritizing programs that serve older students and those from less-advantaged communities. Intensive tutoring and summer programs have been the two most-discussed ways to boost achievement in the wake of the pandemic. To their credit, Ohio policymakers have implemented grant programs, using federal Covid-relief funds, to support these initiatives.[12] Governor DeWine has proposed (in his FY 2024–25 budget) to spend another $15 million in state dollars to continue support for high-dosage tutoring. Yet poor quality and inconsistent participation can diminish the impact of such programs. While Ohio should continue to support these types of efforts, policymakers need to ensure that grantees meet clear quality requirements. Tutoring grantees, for instance, should be required to implement “high-dosage” programs—i.e., during the school day, at least three days per week, with five or fewer students, and led by a trained tutor.[13] Summer school providers should be required to offer programs that run at least five weeks with a minimum of three hours per day of academic instruction and that use high-quality curricula.[14] In such grant programs, the state should prioritize funds for schools and educational providers that support older students and those from less-advantaged communities. As discussed in the present report, students in middle and high school have struggled most to catch up in the wake of the pandemic—and they also have the least amount of time to do so before exiting high school. Students living in less-advantaged communities were also more likely to lose ground during the pandemic, and many continue to struggle to achieve at basic levels.
- Require schools to use evidence-based curricula, and support implementation through funding for high-quality instructional materials and professional development. Even the best tutoring or summer school program will be hard-pressed to overcome ineffective classroom instruction. Though the state has traditionally deferred to local schools on matters of curriculum, it should take a stronger stance as research has made clear—especially in reading—that certain approaches are better for students than others.[15] Researchers have also documented that instructional materials matter, too, with certain textbooks proving to be more effective at raising achievement.[16] Ohio policymakers should make sure that all schools are implementing proven practices and effective curricula and have the supports needed to rigorously implement them. Ohio should follow the lead of Louisiana, which created a state-funded reimbursement program for when schools adopt high-quality materials; it should also follow North Carolina, which now requires teachers to receive professional development in the science of reading.[17] To his credit, Governor DeWine recently made such steps part of his budget proposals. The full legislature should embrace these ideas, and if passed, ODE should ensure strong implementation of these initiatives.
- More effectively allocate state dollars to support low-income students through more accurate identification. Ohio policymakers have long understood the need to devote additional resources for low-income pupils. Today, the state directs about $500 million per year in supplemental aid for districts and charter schools based on their percentage of economically disadvantaged students via a component known as Disadvantaged Pupil Impact Aid (DPIA). Yet the state misallocates a significant portion of these funds, the result of a federal policy shift that now allows certain schools to identify all students as economically disadvantaged—even when some are from higher-income households.[18] As a result, the inflated rates dilute the funding available to students who are truly low income. To target these dollars more effectively, the state needs a more accurate count of disadvantaged students. One possibility is shifting to “direct certification,” which identifies low-income students when their families participate in programs such as TANF or SNAP.[19] If funding were based on this head count, more dollars would flow to schools that actually have the greatest needs, thus increasing their capacity to implement programs such as high-dosage tutoring or raise the pay of effective teachers. This change would also make dollars available to increase the base per-pupil amount in the DPIA component, reducing the likelihood of reductions to districts and enhancing the funding for schools that are truly serving large proportions of low-income students.
The unprecedented events of the pandemic knocked tens of thousands of Ohio students off-track. But Ohio’s Covid generation will still need the same knowledge and skills that their predecessors acquired to succeed in life after high school. Their employers aren’t going to give free passes if they can’t compose a coherent email or keep count of expenses. A less-skilled workforce will be a drag on Ohio’s economy, leaving the state with a diminished capacity for innovation and scientific progress.[20] The good news, however, is that state leaders can avoid these consequences by taking action today on behalf of Ohio’s students. Are they up for this a once-in-a-lifetime challenge? Let’s hope so. Students and families are counting on it.
Endnotes
[1] For a review of national studies on the pandemic’s impact on student performance, see Sarah Cohodes et. al., Student Achievement Gaps and the Pandemic: A New Review of Evidence from 2021–22 (Tempe, AZ: Center on Reinventing Education, August 2022). For in-depth analyses of Ohio data, see Vladimir Kogan and Stéphane Lavertu, How the COVID-19 Pandemic Affected Student Learning in Ohio: Analysis of Spring 2021 Ohio State Tests (Columbus, OH: Ohio State University, February 2022), and Vladimir Kogan, Assessing the Academic Recovery of Ohio Students: An Analysis of Spring 2022 Ohio State Tests (Columbus, OH: Ohio State University, September 2022).
[2] For an overview of those results, see Aaron Churchill, “Ohio’s dismal NAEP results demand an assertive policy response,” Ohio Gadfly Daily, October 25, 2022.
[3] State exams are given in grades 3–8 math and ELA, grades 5 and 8 science, and high school Algebra I, Geometry, English II, Biology, U.S. History, and U.S. Government. Save for one of the high school math exams as well as the U.S. History and U.S. Government exams, all of these assessments are required under federal education law.
[4] Kogan and Lavertu, How the COVID-19 Pandemic Affected Student Learning in Ohio.
[5] Ohio’s revamped report-card system and the ratings from 2021–22 are discussed in Aaron Churchill, Fine-Tuning Ohio’s School Report Card (Columbus, OH: Thomas B. Fordham Institute, January 2023). The main consequences for schools that were put on hold include identification of districts for academic distress commissions and automatic closure for low-performing charter schools.
[6] M. Danish Shakeel and Paul E. Peterson, “A half century of student progress nationwide,” Education Next 22, no. 4 (August 2022).
[7] The “performance-level descriptors” for each grade and subject are available at Ohio Department of Education, “Performance Level Descriptors.” For the raw test scores that equate to the various achievement levels, see Appendix H in Cambium Assessment, Annual Technical Report: Ohio’s state tests in English language arts, science, and social studies, 2020-2021 school year (Washington, D.C.: Cambium Assessment, October 2021).
[8] Subgroup results for all grades 4–8 are reported in Kogan, Assessing the Academic Recovery of Ohio Students.
[9] Learning Heroes, “Hidden in Plain Sight: A way forward for equity-centered family engagement” (research deck, Learning Heroes, June 2022).
[10] Dan Silver, Anna Saavedra, and Morgan Polikoff, “Low parent interest in COVID-recovery interventions should worry educators and policymakers alike,” Brookings Institution, August 16, 2022.
[11] ODE’s web page “Family Score Reports Interpretive Guide” includes links to the score report template.
[12] See ODE’s web pages “Summer Learning and Afterschool Opportunities Grants,” and “Statewide Mathematics and Literacy Tutoring Grants.”
[13] Carly D. Robinson et. al., “Accelerating Student Learning with High-Dosage Tutoring” (brief, Design Principles Series, EdResearch for Recovery, February 2021).
[14] Catherine H. Augustine and Heather L. Schwartz, “Summer Learning Is More Popular Than Ever. How to Make Sure Your District’s Program Is Effective,” Rand Corporation, March 30, 2022.
[15] In reading, effective instruction has become known as the “science of reading,” an approach that emphasizes phonics, vocabulary, and background knowledge for fluent reading. For accessible coverage, see Emily Hanford’s work at American Public Media.
[16] Cory Koedel and Morgan Polikoff, Bang for Just a Few Bucks: The Impact of Math Textbooks in California (Evidence Speaks Reports, Vol 2, #5, Economic Studies, Brookings Institution, Washington, D.C., January 5, 2017).
[17] Robert Pondiscio, “Louisiana Threads the Needle on Ed Reform,” Education Next 17, no. 4 (July 25, 2017), and Ariel Gilreath, “Retraining an Entire State’s Elementary Teachers in the Science of Reading,” Hechinger Report, November 10, 2021.
[18] Ohio bases economically disadvantaged identification on eligibility for subsidized meals, which has historically been open to students from families with incomes at or below 185 percent of the federal poverty level. Under a 2010 federal policy change known as the Community Eligibility Provision (CEP), certain districts and schools may offer all students subsidized meals, regardless of their income. This results in inflated—100 percent—economically disadvantaged rates across many Ohio schools. For more on CEP, see ODE’s web page, “Community Eligibility Provision.”
[19] For more on direct certification, see ODE, “Direct Certification Manual” (2022).
[20] For projections of the potential long-term toll of learning loss on economic outcomes, see Kristen Blagg, The Effect of COVID-19 Learning Losses on Adult Outcomes (Washington, D.C.: Urban Institute, Income and Benefits Policy Center, February 2021), and Eric A. Hanushek, “The Economic Cost of the Pandemic: State by State” (essay, Hoover Education Success Initiative, Hoover Institution, January 2023).


