
Here’s how ADC districts performed on state report cards
Academic Distress Commissions (ADCs) have a long and controversial history in Ohio.

Academic Distress Commissions (ADCs) have a long and controversial history in Ohio.


Academic Distress Commissions (ADCs) have a long and controversial history in Ohio. They were first created in 2005 as a way for the state to intervene in districts that consistently failed to meet academic standards. The law was significantly strengthened in 2015, and was promptly met with immediate and fierce pushback from district advocates. By 2021, lawmakers had caved to political pressure and created an easy off-ramp for the three districts that were under ADC control: Youngstown, Lorain, and East Cleveland. This off-ramp was pitched as a compromise—control of the district would return to the local school board and its chosen superintendent, but in exchange, they would be tasked with developing academic improvement plans containing annual and overall improvement benchmarks. ADCs would be permanently dissolved if districts met a majority of these benchmarks by June 2025 (previously, districts had to achieve state-defined performance targets to exit).
Official implementation of these plans began during the 2022–23 school year. State report cards for that year—the report cards released earlier this month by the Ohio Department of Education—were meant to be the first check-in on how things were going under these new improvement plans. Thanks to the state budget enacted at the end of June, though, things are a little more complicated. That’s because the budget contained a tiny provision that dissolved Lorain’s ADC and its academic improvement plan. As a result, Lorain is no longer required to demonstrate that it’s improving on behalf of its students. Its counterparts in Youngstown and East Cleveland, however, didn’t benefit from the same carve out.
This tiny change sets up a hugely interesting comparison. This year’s state report cards are no longer a simple check-in. Now, they’re an opportunity to compare the district that state leaders deemed worthy of an academic free pass—Lorain—to the other two that weren’t quite so “lucky.” Below is an examination of each district’s results in four of the report card’s most significant areas: achievement, progress, early literacy, and chronic absenteeism.
Achievement
Achievement is the only test-based report card indicator that appeared on each of the three districts’ improvement plans. Specifically, the plans focus on performance index (PI) scores, which measure the state test results of every student and award districts points based on the state’s six achievement levels. The higher a student’s achievement, the more points the district earns. For example, a student who scores at the advanced level earns their district 1.2 points, while a student testing at the basic level (just below proficient) earns 0.6 points.
The chart below depicts performance index scores in ADC districts, with averages from the Ohio Eight urban districts included for comparison. It’s important to remember that the PI calculations award zeros when students do not participate in state assessments. The number of untested students was significantly higher in 2020–21, the height of pandemic-related disruptions and school closures. That—combined with learning loss—depressed some districts’ PI scores that year.
Figure 1. Performance index scores, 2018–2023
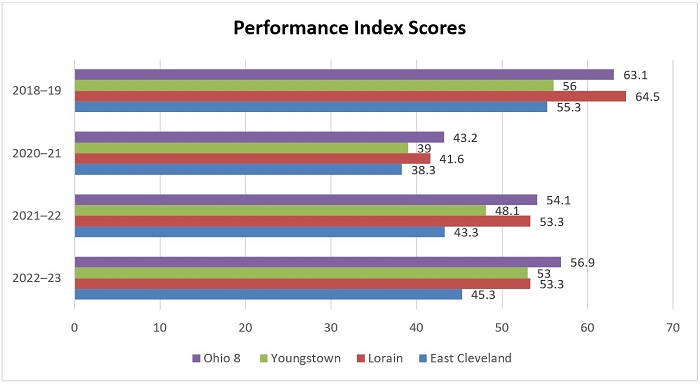
Results from the 2021–22 school year indicate the beginnings of an academic bounce back. The Ohio Eight average and results from the three ADC districts are all higher than the year prior. Based solely on these data—which are what lawmakers had available to them during the budget cycle—Lorain was outperforming the other ADC districts and closing in on the Ohio Eight average. Perhaps advocates from Lorain used this as evidence that they were worthy of receiving an early release from state oversight.
But struggling districts need to prove that they’re getting better over time. That’s why the ADC off-ramp that was put into law in 2021 required districts to implement an improvement plan and track results through June 2025. Unfortunately, lawmakers decided that didn’t matter for Lorain. And now, report card results from 2022–23 have revealed that Lorain hasn’t continued improving. In fact, its performance index score is flat compared to the year prior, while scores ticked up statewide and in the other ADC districts. East Cleveland’s score went up slightly, while Youngstown’s jumped by five points.
Progress
Ohio’s progress component measures the academic growth students make over the course of a year. This measure is crucial, as it showcases a district’s or school’s contribution to student learning while yielding results that are closer to neutral with respect to schools’ demographics. Even in districts where students are far behind in reading and math achievement, the progress component can reveal positive academic growth.
The table below breaks down the progress ratings of each ADC district for the 2021–22 and 2022–23 school years. East Cleveland and Youngstown remained poor performers at just one and two stars, respectively, in both years. Their lack of growth should be a red flag, as a consistent four- or five-star rating is needed to close achievement gaps. But Lorain’s rating should also cause concern. In 2021–22, the district earned four stars. That meant students made more progress than expected. But in 2022–23, its progress rating dropped to two stars. That means students made less progress than expected. In the time span of one year—the same year that lawmakers decided Lorain had done enough to earn a free pass—the district’s progress rating dropped from positive and promising to negative and discouraging.
Table 1. Progress ratings for ADC districts 2021–22 and 2022–23

Early literacy
Ohio is on the cusp of a significant early literacy overhaul centered on the science of reading. This overhaul makes results on the early literacy component even more important than usual, as results from 2021–22 and 2022–23 will offer a baseline against which to compare future results.
The table below breaks down the early-literacy results for each ADC district. Results for 2021–22 are shown in blue, while those for 2022–23 are shown in red. Once again, Lorain is not the ADC district that performed best. That would be East Cleveland, which earned two stars overall and had nearly half of their third graders score proficient on the reading portion of the state test. By comparison, Lorain and Youngstown earned only one star and had just one-third of their third graders score proficient. Perhaps most troublesome are the results indicating that Lorain moved just 16 percent of its students from off track to on track in reading. Youngstown, on the other hand, moved 21 percent of its students, while East Cleveland doubled Lorain’s total and moved 32 percent. Also of note are the universal promotion rates of all three ADC districts: Without a retention requirement, they waved through practically all third-graders to fourth grade regardless of whether they were prepared to succeed there.
Table 2. Early literacy scores for ADC districts 2021–22 and 2022–23

Chronic absenteeism
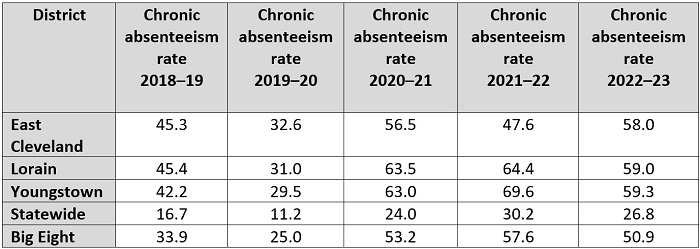
Chronic absenteeism has been a hot topic in Ohio as of late, and rightfully so. Student absences have soared in recent years, and have become a prominent roadblock in Ohio’s efforts to mitigate pandemic-caused learning loss and improve student outcomes. Fortunately, Ohio has tracked chronic absenteeism data on its state report cards since 2017. As a result, we can examine chronic absenteeism rates in all three ADC districts over time, and compare them with the statewide average and the average in the Ohio Eight.
As the table below demonstrates, student absences skyrocketed once the pandemic hit. Chronic absenteeism rates during the 2021–22 school year were particularly bad, but two ADC districts had truly appalling numbers: Lorain had a chronic absenteeism rate of 64 percent, while Youngstown had a rate of 69 percent. Those rates got better during the 2022–23 school year, but are still well above 50 percent. East Cleveland, meanwhile, saw its absenteeism rate rise significantly this year.
Table 3. Pre- and post-pandemic chronic absenteeism percentages
***
There is one more crucial report card measure worth mentioning: overall grades. This measure takes into account all of the report card components and combines them into a concise, easy-to-understand measure of district performance. Unsurprisingly, overall grades from ADC districts are not inspiring. Youngstown, which outperformed Lorain and East Cleveland on several measures, was awarded 2.5 stars. Lorain and East Cleveland were each awarded two stars. These results are even more concerning within the context of the overall distribution of scores across the state. Only fourteen of over 600 districts were awarded two stars, and another forty-six were awarded 2.5 stars (just one district received one or 1.5 stars). That puts Lorain and East Cleveland in the bottom 2 percent of districts statewide and Youngstown in the bottom 8 percent.
District advocates will likely argue that this is only one year of results, and that it’s going to take time for ADC districts to work themselves up from the bottom of the barrel. But that was the whole point of the ADC transition plan established in 2021. Chronically-underperforming districts were given a timeline and standards (albeit questionably low ones) against which they were expected to improve. They were even provided with the local control they demanded to do so. After one year, that local control hasn’t yet seemed to benefit students. In fact, in Lorain, things have gotten worse. And yet, Youngstown and East Cleveland are still under state oversight and Lorain is not. To be clear, this doesn’t mean that Youngstown and East Cleveland also deserved special treatment. It means that lawmakers should have resisted political pressure and insisted that all three ADC districts prove that they were getting better over time. If they had, they wouldn’t be facing the uncomfortable question of why they gave a free pass to a district that now seems to be moving backward.

For more than two decades, Ohio’s school report cards have shed light on the strengths and weaknesses of the state’s public schools. This year’s report card is no different. As has already been discussed on this blog, the release of 2022–23 results revealed issues that need serious attention—mathematics performance and absenteeism among them—as well as areas in which the state is making stronger progress. Reading proficiency, for example, has rebounded surprisingly quickly, post-pandemic.
But the performance of urban schools, particularly those in the Ohio Eight cities, remains concerning. This analysis examines the most recent data from areas, starting with an overview of proficiency rates and then moving to district and charter school results along three key report card components—performance index, value-added, and overall ratings. Spoiler alert: The results are sobering across the board, though with a few bright spots.
Student proficiency
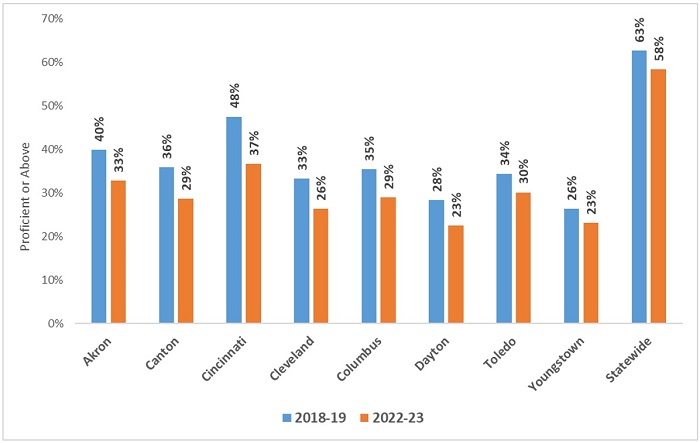
Historically, proficiency rates in the Ohio Eight cities (listed in figure 1) have fallen far below statewide averages, reflecting in part higher poverty rates but also greater school dysfunction. Regrettably, not much changed on the proficiency side in 2022–23. An abysmal 29 percent of Columbus students achieved proficiency on last year’s state exams; rates were even lower in Cleveland (26 percent), Dayton (23 percent), and Youngstown (23 percent). As the chart below indicates, proficiency across all eight of the districts remained below pre-pandemic levels. Compared to the statewide averages, proficiency rates across the Ohio Eight lagged some 20 to 35 percentage points behind.
Figure 1: Percent of students scoring proficient or above on state exams, Ohio Eight districts and statewide
Low achievement translates into poor post-secondary readiness outcomes. This year’s report card shows that less than 1 percent of Cleveland students passed three or more AP exams during high school, 5 percent achieved college-ready benchmarks on the ACT or SAT exam, and less than 1 percent earned industry-recognized credentials. In Columbus, rates were 2 percent (AP), 6 percent (college-ready), and 14 percent (credentials). In sum, poor literacy and numeracy continues to plague Ohio’s major cities, and remains an enormous barrier to economic and social advancement for the 200,000 plus students who live in urban communities.
* * *
Clearly, students in the Ohio Eight are in tremendous need of excellent schools. What does school quality look like in these cities? The next sections turn to the results of both district and public charter schools on rated components of the report card.
Performance index
Ohio has long reported performance index (PI) scores as an overall measure of student achievement in a school or district. Like a weighted GPA, schools receive more credit on this measure when students achieve at higher levels on state exams. The PI also combines results across all state assessments, including those in English language arts, mathematics, science, and the high school exams for U.S. history and government. Though they are somewhat different measures, PI scores are close counterparts to proficiency rates. As noted in the discussion above on proficiency rates and indicated in the PI data below, results on both measures tend to correlate with a school’s demographics.
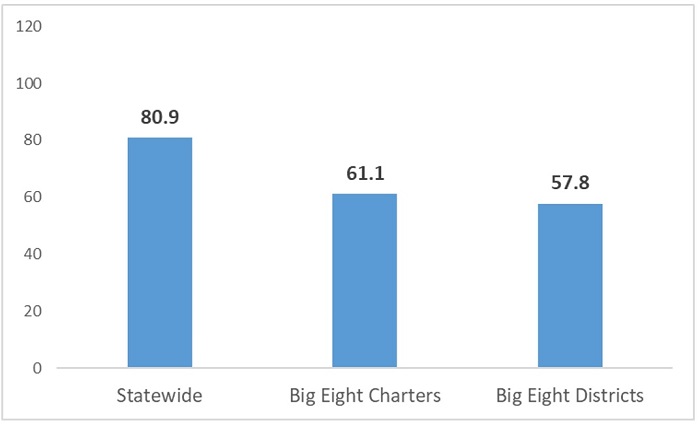
Figure 2 shows average PI scores for the Ohio Eight districts and the charter schools located in those cities. As is clear, scores across both sectors trailed well behind the statewide average—reflecting, again, the large achievement gap—but charters on average posted slightly higher scores than their district counterparts (61.1 versus 57.8).
Figure 2: PI scores in the Ohio Eight versus statewide, 2022–23
As for PI results by city, charters edged the local district in Cleveland, Columbus, Dayton, and Toledo, but lagged in Akron, Canton, and Cincinnati. The highest-scoring charter sector was Columbus’s (63.3) while Cincinnati’s school district was tops on the district side (62.8). Though not displayed here, the vast majority (90 percent) of Ohio Eight district and charter schools received 1- or 2-star ratings on the Achievement report card component, which is based entirely on PI results.
Table 1: PI scores by Ohio Eight city, district and charter

Value-added
Alongside the PI, value-added (VA) is the other key measure on the report card. Unlike the PI, which captures achievement at a point in time, VA tracks individual student’s learning gains or losses over time. This look at academic “growth” allows us to identify effective schools that are helping students make significant progress—no matter where they start the year (whether low- or high-achieving). Conversely, VA also flags less-effective schools that are allowing achievement to slip. For instance, VA would ding a school whose average student falls from the 50th to the 45th percentile. Because VA takes into account students’ prior achievement, it produces more poverty-neutral results. As we’ll see, schools in the Ohio Eight can and do receive top marks on this measure.
Figure 3 displays the Progress component ratings, which are based solely on schools’ VA results. Statewide, 35 percent of school buildings received 4 or 5 stars on this component, while another 28 percent received 1 or 2 stars. Progress ratings were similar in the Ohio Eight, with 29 percent of district schools receiving 4 or 5 stars and 31 percent of charter schools receiving such ratings. While most students attending these schools still need more help to reach proficiency, their schools are helping them make progress toward that goal. On the other side of the spectrum, 28 and 27 percent of Ohio Eight district and charter schools, respectively, received 1 or 2 stars. Almost all of these are struggling schools where achievement is weak and students are falling even further behind.
Figure 3: Progress ratings statewide and for Ohio Eight district and charter schools
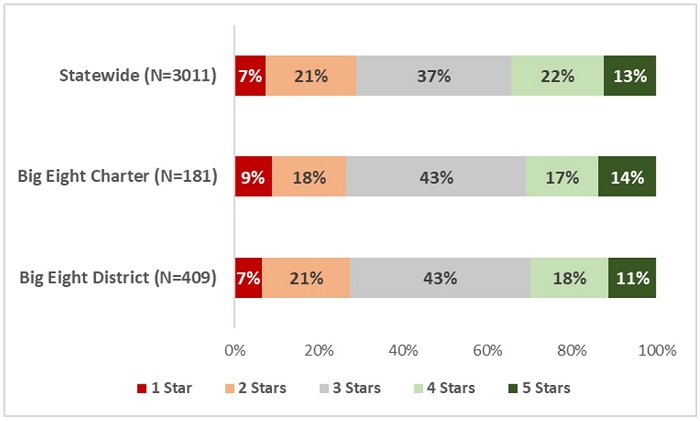
Table 2 shows the percentage of Ohio Eight schools receiving 4 or 5 stars for Progress by individual city. When the focus is on top-rated schools, charters outperformed district counterparts in Akron, Cincinnati, Columbus, and Dayton in 2022–23. Meanwhile, districts performed better in Canton, Cleveland, Toledo, and Youngstown.
Table 2: Progress ratings by Ohio Eight city, district and charter

Overall ratings
For the first time since 2019, Ohio assigned an Overall rating that summarizes school performance on the various components of the report card. These elements include the PI (i.e., Achievement) and VA (i.e., Progress) measures, which are weighted more heavily in the Overall rating calculations, as well as the Gap Closing, Graduation, and Early Literacy components. For the sake of brevity, we omit discussion of the latter three dimensions.
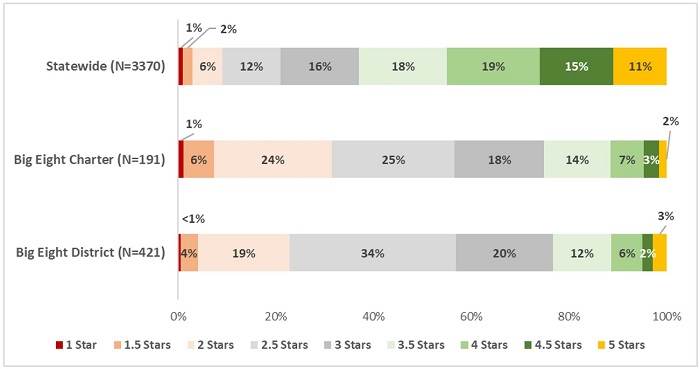
Figure 4 displays the Overall ratings statewide and for the Ohio Eight. As is evident, marks were generally lower in the Ohio Eight compared to statewide: 37 and 23 percent of Ohio Eight charter and district schools received 2 or fewer stars, a much higher rate than statewide (9 percent). At the same time, fewer Ohio Eight schools received top marks. As for district and charter comparisons, the results were something of a mixed bag. On the one hand, charters—as noted above—had a higher percentage of low-rated schools than districts. Yet on the other hand, charters also had a slightly higher proportion of highly-rated schools: 26 percent of Ohio Eight charters earned 3.5 stars or above versus 23 percent of Ohio Eight district schools.
Figure 4: Overall ratings statewide and for Ohio Eight district and charter schools, 2022–23
***
Let us conclude with four takeaways.
1. No one should be satisfied with student achievement in the Ohio Eight. There remains much work ahead—in both charter and district sectors—to help urban students read and do math on grade level.
2. Ohio is in sore need of more high-performing urban schools. Even on the value-added measure, which provides a clearer picture of school effectiveness, only a minority of Ohio Eight schools—roughly one in three—are pushing students forward. That’s simply not enough, especially in the wake of the pandemic.
3. Progress and Overall ratings help identify high-quality urban schools. In the Ohio Eight, schools receiving 4- or 5-star Progress ratings, or 3.5 star or above Overall ratings, merit a closer look from school-shopping parents, as well as community leaders looking to support the growth of excellent schools.
4. Narrowing Ohio’s staggering achievement gaps should stay atop the policymaking agenda. No state has successfully closed the achievement gap. But that doesn’t give Ohio leaders a free pass. All students—no matter their zip code or background—should be able to read and do math proficiently by the end of high school. How exactly to accomplish that goal remains a complicated question, but state leaders can ensure that achievement gaps continue to receive attention and that serious ideas to narrow them are discussed.
Ohio’s annual report card always elicits a variety of responses. Sometimes, it’s validation for a job well done. Other times, it means some soul-searching. The Ohio Eight results continue to reveal the sobering fact that tens of thousands of urban students are struggling with basic math and reading skills. At the same time, it’s another urgent call for more and better public school options in Ohio’s largest cities. Every student deserves the opportunity to reach their full potential. In the Ohio Eight, there is much work ahead to help all students achieve their dreams.

School report cards are out, and the results reveal the persistent challenges facing Ohio students in the aftermath of pandemic-era disruptions to education. While test scores ticked up in 2022–23 relative to last year, math scores remain substantially below pre-pandemic levels and achievement gaps remain wide. In Columbus and Dayton school districts, for example, 46 and 51 percent of students, respectively, scored “limited” on state assessments—the lowest mark—roughly double the proportion of students at this level statewide (23 percent).
Accelerating student learning remains a moral imperative, and a continuing challenge for Ohio’s policymakers and educational leaders. There has been much discussion about how to boost achievement, but one of the most basic ways to move the needle might be hiding in plain sight: simply making sure that students attend school.
Unfortunately, absenteeism soared during the pandemic and remains at alarmingly high levels. Statewide, chronic absenteeism rates increased from 17 to 27 percent between 2018–19 and 2022–23. That translates to 418,382 students who were chronically absent last year. Such students miss more than 10 percent of the school year for any reason, whether excused or unexcused. Based on a 180-day year, that is equivalent to eighteen or more days of school—nearly a month worth of learning. That’s a lot of valuable instructional time lost.
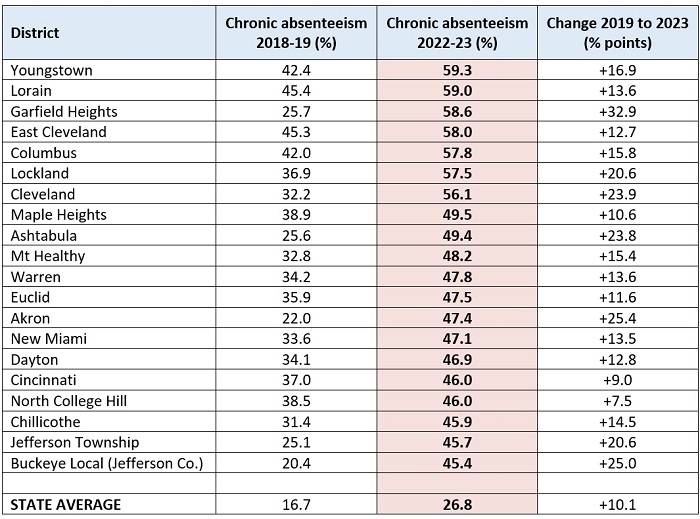
The state average masks the sky-high rates of absenteeism across many Ohio districts. The table below indicates that more than half of students were chronically absent in Youngstown, Lorain, Garfield Heights, East Cleveland, Columbus, Lockland, and Cleveland. Staggering rates of absenteeism are also evident in big-city districts such as Akron, Dayton, and Cincinnati, as well as smaller districts such as Ashtabula, Chillicothe, and Buckeye Local. As the rightmost column indicates, chronic absenteeism rates were significantly up in 2022–23 compared to pre-pandemic levels. In Youngstown, chronic absenteeism rates were 17 percentage points higher than in 2018–19; rates skyrocketed by 33 points in Garfield Heights—the largest increase of any Ohio district.
Table 1: Districts with the highest rates of chronic absenteeism in 2022–23
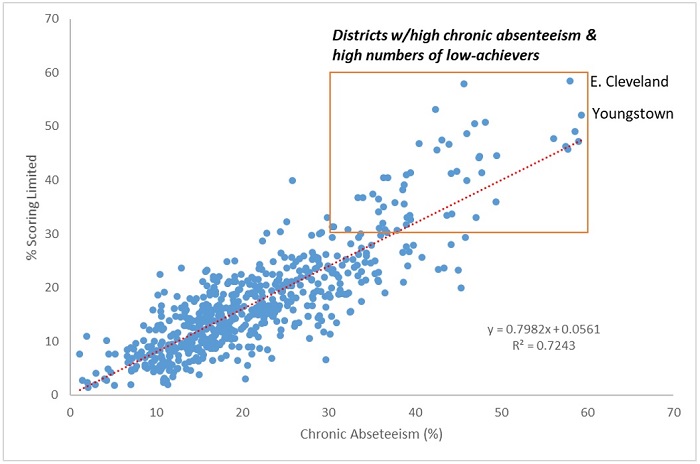
Districts with high chronic absenteeism rates tend to have large numbers of low-achieving students. The figure below displays the correlation between chronic absenteeism and the percentage of students scoring “limited”—again, the lowest achievement level on state exams. The districts in the top right corner of the figure (outlined in orange) had chronic absenteeism rates of 30 percent or higher and more than 30 percent of students scoring limited in 2022–23. At the very top right of the chart, we see East Cleveland, where 58 percent of students were chronically absent and 58 percent of students scored limited. In Youngstown, 59 percent of students were chronically absent and 52 percent scored limited.
Figure 1: Relationship between chronic absenteeism and low student achievement in Ohio districts, 2022-23
Of course, multiple factors lead to low achievement, including poverty and ineffective instruction. But poor attendance contributes to these academic deficiencies, as well. Moreover, low achievement can further depress attendance, as struggling students get frustrated and decide not to attend school. A recent analysis of national assessment data suggests that the spike in chronic absenteeism played a major role in pandemic-era learning loss.
To their credit, national and state leaders are recognizing the importance of school attendance. President Biden recently called for an “all-hands-on-deck approach” to combatting the wave of chronic absenteeism. Before him, President Trump pushed for schools to reopen faster, recognizing the critical role in-person instruction plays in student learning. Closer to home, the Ohio Department of Education has declared an “attendance crisis,” and noted on this year’s state report card that “missing too much school has detrimental effects on a student’s learning trajectory.” Just prior to the pandemic, community leaders launched the Stay in the Game! initiative to encourage attendance; that program takes on greater importance (and could be expanded) as chronic absenteeism has become more prevalent in Ohio.
Making sure that students are in school will take even more concerted efforts on the part of Ohio’s leaders, schools, and parents. On a leadership level, state and local leaders should continue to communicate a strong, consistent message that attending school is essential to student success. And Ohio legislators should stand firm in state efforts to reduce chronic absenteeism and not tamper with policies that promote consistent attendance (there is a misguided proposal that would do just this). They should insist on complete and accurate attendance data collections, and could even explore a value-added-type measure that would shine light on schools, including high-poverty ones, that are most effective at improving attendance.
Meanwhile, schools can take practical steps to support better attendance. Here are four (and more can be found in a recent EdResearch for Recovery brief and Tim Daly’s terrific essay):
Speaking of parents, they should also be enlisted in the fight against chronic absenteeism. Moms and dads can make sure that their kids are up and ready to go in the mornings and getting plenty of sleep at night. For parents of adolescent children, they can make sure screens are off at a reasonable hour and phones are left outside bedrooms. They can reinforce to older children just how important it is to attend school, even if they’re not seeing the value of school in the moment. Parents should plan appointments and vacations at times that don’t interfere with school and resist pressure from their children to allow them to stay at home. With educational choice expanding in Ohio, parents can also work to find schools where their children feel motivated to learn and have a stronger sense of belonging. (Lack of interest in schoolwork and bullying are two reasons why students may not show up.)
The pandemic knocked thousands of Ohio students off track and widened already unacceptably large achievement gaps. Too many students, however, are still missing significant chunks of class time, and that is making academic progress all the more difficult. Making sure that state and community leaders, schools, and parents are on the same page about the importance of attendance—and taking actions to encourage it—would be a great step toward ensuring that all students are catching up.

Data show that America’s current manufacturing workforce is aging and retiring as the sector is expanding exponentially and its demand for workers outpaces supply. Thus, a new report from the RAND Corporation looking at the career and technical education pathways designed to take postsecondary students directly from the classroom to the manufacturing floor is especially timely. It expands the research in this understudied area, focuses on efforts in Fordham’s home state of Ohio.
Data come from the Ohio Longitudinal Data Archive, drawing on information from the state’s higher education institutions and technical colleges, as well as from state unemployment insurance records. Student records include when each student first enrolled in a college or program; the duration of their enrollment; the program type, courses taken, and grades; whether and when the student earned a degree; and the type of degree earned. The technical college records are similar but include a course-based proxy for specific credentials earned. The data cover postsecondary enrollments and degrees earned between 2006 and 2019. The unemployment data cover 2007 through 2021, and all wage estimates are presented in 2021 dollars. To delineate “manufacturing-related” programs—the specific focus of their analysis—from other career and technical courses, the researchers use Classification of Instructional Programs (CIP) codes. As you might imagine, the list is heavy on engineering, construction, metalwork, and plastics courses.
In 2019, more than 30,000 students were enrolled in manufacturing-related postsecondary programs in Ohio. Approximately 1,600 were enrolled in technical colleges, 13,500 in associate degree programs at traditional two- and four-year institutions, and 13,800 in bachelor’s degree programs at those institutions. Interestingly, the previous decade showed a sharp decline in the number of students pursuing associate degrees and a steady rise in the number pursuing bachelor’s degrees. Technical college enrollment remained largely flat during that time. In terms of completion, approximately 7,700 students earned a manufacturing-related credential in 2019. Not surprisingly, given the enrollment trend, the largest share earned a bachelor’s degree. The number of completers at technical colleges was down against its high point a few years earlier. That total number also includes individuals who earned a manufacturing-related certificate independent of formal higher education settings (adult apprenticeships, formal upskilling by current employers, etc.), which nearly equaled the associate degree completers. In short, Ohio’s manufacturing employers should have been swimming in applications from skilled employees.
Data show that 82 percent of those who completed a technical college program were employed within a year of completion, compared to 84 percent of those who completed a certificate, 83 percent of those who completed an associate degree, and 65 percent of those who completed a bachelor’s degree. Those percentages remained fairly strong for up to five years post-completion, indicating that degrees and credentials are valuable to their recipients. However, a much smaller share of those credentialed individuals were primarily employed in the manufacturing sector. To wit: Just 38 percent of those who completed a technical college program were employed in Ohio manufacturing at one year post-completion, compared to 27 percent of those who completed a certificate, 25 percent of those who completed and associate degree, and 30 percent of those who completed a bachelor’s degree. Those percentages also remained similar after five years.
Where were they going instead? Construction, retail, technical services, administrative/support, and waste management/remediation services were the biggest recipients of manufacturing-credentialed workers in 2019, with a perhaps-predictable differentiation in professional versus service employment based on whether workers earned bachelor’s or sub-bachelor’s degrees or credentials. The attrition does not appear to be driven by industry pay gaps, as Ohio’s manufacturing industry pays higher wages than do other industries into which credential-earning workers opt. White males are more likely than females and non-white men to move directly from credential to employment, both in manufacturing and non-manufacturing jobs, and their wages are higher, as well.
The bottom line seems to be that even with a fairly clear pathway from the graduation stage to the factory floor, Ohio needs more newly-credentialed individuals to take that step, especially if a more-diverse manufacturing workforce is desired. Unfortunately, that is easier said than done. The report suggests geographic concerns (too few manufacturing jobs in the local areas where students are graduating) and skill mismatches (credentials earned are not the ones local employers need) as prime areas where gaps could be addressed. It is to be hoped that as the Silicon Heartland takes root and expands outward from central Ohio, the new and growing manufacturing presence here will bring on a concomitant effort to reach into the education world and help shape existing training and credentialing programs to their needs, to build new ones as needed, to welcome nontraditional employees, and bridge any gaps or mismatches between school and work.
SOURCE: Lisa Abraham, Christine Mulhern, and Lucas Greer, “Strengthening the Manufacturing Workforce in Ohio,” RAND Corporation (August 2023).

There is no shortage of research into the impacts of school and district accountability systems on education-related student outcomes. But a recently published paper adds a new twist by examining the criminal activity and economic self-sufficiency of adults who were impacted by South Carolina’s accountability efforts when they were high school students.
Introduced in 2000, South Carolina’s accountability system evaluates all public schools according to a set of continuous performance metrics that are then converted into five discrete school ratings—unsatisfactory, below average, average, good, and excellent. The state uses these labels to reward and sanction schools. High ratings are associated with additional funding, while schools that receive low ratings face a range of possible consequences that include leadership change, restructuring, and state takeover. The worse the rating, the more disruptive the state’s intervention. The researchers assert that South Carolina’s system is designed to resist any potential efforts by schools to “game” the outcome by focusing on and improving non-academic rating areas (like attendance or graduation rates) or by excluding low performers from testing in high-value grades or subjects.
The researchers used administrative data that allowed them to connect former students to state databases in which they appear as adults. They employed a quasi-experimental design using regression discontinuity and local randomization. The full sample comprised 160,000 students who were first-time ninth graders in the 2000–2001 to 2002–03 school years and attended 194 different high schools across the state. The sample included slightly more males than females; 41 percent of students were Black and 55 percent White. As in most places, school ratings correlate negatively with the percentage of Black students attending and with the fraction of free-lunch-eligible students. All students were followed—to the extent that they appeared—in three datasets: the South Carolina State Law Enforcement Division’s detailed arrest records from 2000 to 2017 (including demographic information on the arrestees, offense data, and the type of crime committed), incarceration records from the state’s Department of Corrections, and administrative records from the South Carolina Department of Social Services regarding enrollment in social welfare programs. Students were followed beyond high school in three cohorts through approximately age thirty-four. Treatment effects were calculated based on the first high school they attended.
The topline finding is that state intervention in low-performing schools was beneficial to students’ later-life outcomes. Specifically, students in schools that were rated just below the cutoff for intervention were 1.8 percentage points less likely to be arrested in adulthood in comparison to students who attended schools that were just above the cutoff. These impacts were nearly double for females than for males. The researchers found null effects on future incarceration, likely due to the arrest data being largely driven by alcohol and drug-related crimes—offenses typically not associated with long-term incarceration.
Although limited, some positive impacts of state accountability were also seen in the study’s measure of future economic stability. To wit: Female students attending schools with marginally lower accountability ratings around the intervention cutoff were 4.2 percentage points less likely to enroll in the Supplemental Nutrition Assistance food stamp program (a.k.a. SNAP) as adults than their female peers from higher-rated schools. There were null effects observed on females’ enrollment in the Temporary Assistance for Needy Families (TANF) program, and for males’ enrollment in either SNAP or TANF. The researchers note that the SNAP finding may be even more significant than it appears. Since the average monthly SNAP benefit can make up around one-fourth of a recipients’ total gross income, students positively impacted by school improvement efforts as adults and not relying on SNAP benefits likely have higher overall incomes than their SNAP-enrolled peers. Although this is speculation on the part of the researchers rather than something observed in the data.
Digging into mechanisms, the researchers find evidence of a simple and direct explanation: Experiencing state-mandated interventions appears to prompt schools to increase their academic standards and to boost the academic success of their students. The researchers do not break down the specific interventions experienced in any given school, although the worse the original performance, the more thorough a change the state required. The data do show more students being retained in low-rated schools, but without any net change in grade progression rates, as compared to higher-rated schools. This, coupled with the researchers’ assertion that South Carolina’s system resisted gaming, seems to indicate a concentrated effort to remediate students to grade-level standards—as quickly as possible. The data also show a consequent rise in exit exam scores and academic eligibility for the state’s LIFE college scholarship program. In short, better achievement in school leads to less negative life impacts as adults. And ironclad disruptive accountability is a path to get better achievement outcomes. Simple.
SOURCE: Ozkan Eren et al., “School Accountability, Long-Run Criminal Activity, and Self-Sufficiency,” NBER Working Papers (August 2023).

Ohio has long been a pioneer in school choices for students and families. It is home to one of the nation’s first private-school scholarship programs, focused on Cleveland. Ohio was also an early adopter of public charter schools, which today serve roughly 120,000 students. Just this year, lawmakers took historic steps forward by creating a universal private-school scholarship and increasing charter funding to more closely match local districts. But even with these measures in place, educational choice remains a contentious issue.
What’s next for the Buckeye State on education choice? How can state policymakers continue to empower parents and expand options for more children who need and seek them, while also promoting academic excellence and strong civic values in all schools? Is there a way forward in resolving the ongoing and sometimes acrimonious debates about choice?
The Buckeye Institute, School Choice Ohio, and the Thomas B. Fordham Institute are pleased to announce an in-person event featuring Ashley Berner of Johns Hopkins University. Dr. Berner is author of Pluralism and American Public Education: No One Way to School. She draws on international research to illustrate “educational pluralism,” a structure for public education in which governments empower choice by design—and academic accountability by design.
Join us on October 17th at the Athletic Club of Columbus to learn more about this important concept used by most of the world’s democracies, and how it might be the way forward for Ohio.
The event will feature a presentation by Dr. Berner, followed by a conversation with Fordham’s President Emeritus and nationally-renowned education thought leader, Chester E. Finn, Jr. Audience engagement will be encouraged as the event explores where Ohio is on the path to educational pluralism and—perhaps more importantly—where it should be on the path.
Full video of the event is here: